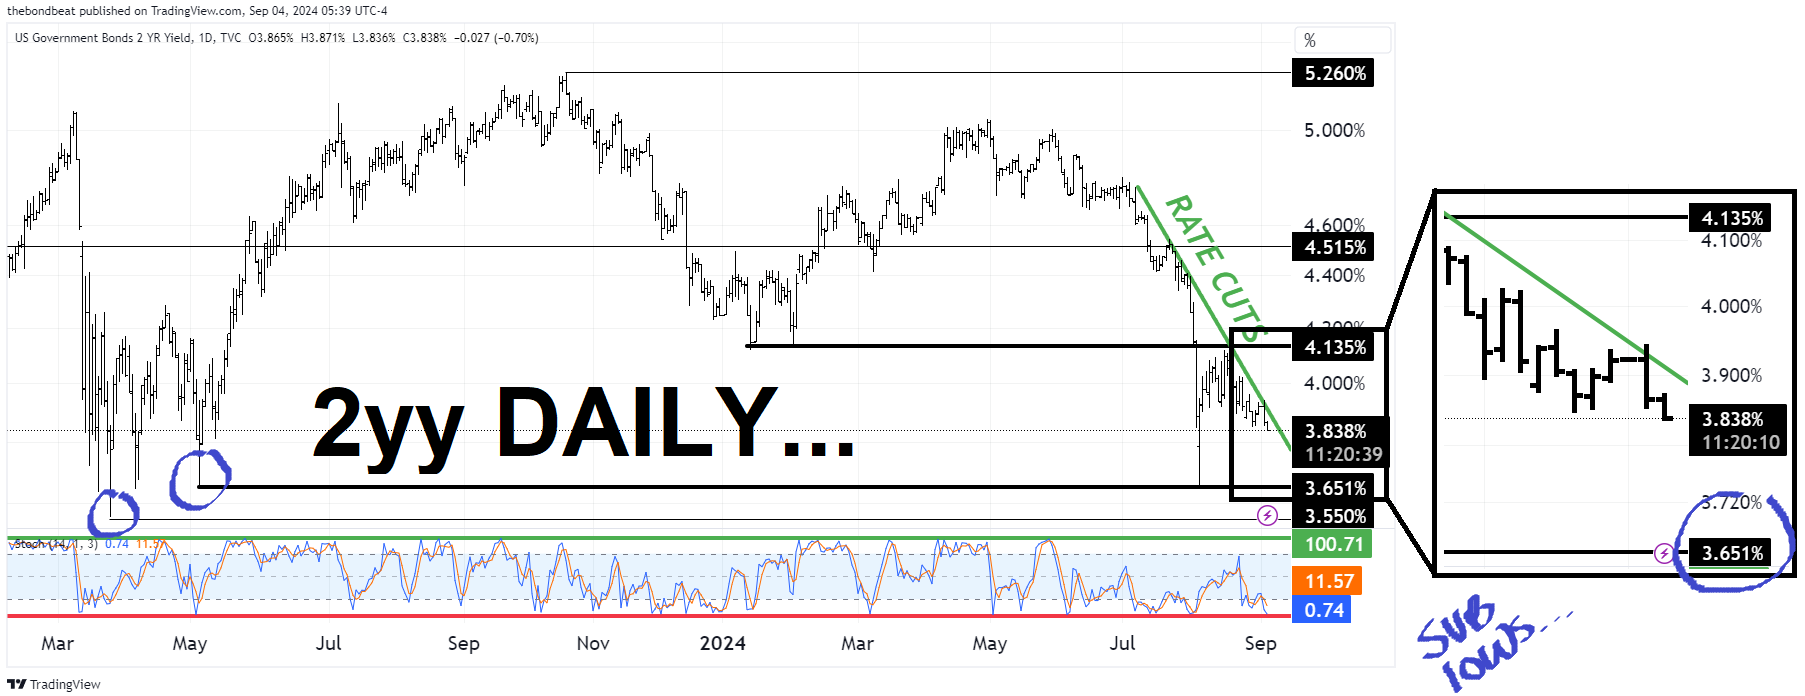
… Good morning 2yy as America gets back to work — selling of stocks and buying of bonds and so … Bad is good or no, wait. good is good and bad is bad so … whatever the case stonks were down early and so, bonds went bid (despite or because) and so … whatevs …
ZH: US Manufacturing ISM Signals Accelerating Stagflation As PMI Turns Downright Apocalyptic (see what you wanna see, say whatever you wanna say…RenMAC TWITTED a visual HERE, for example)
… And while most output subindexes remain deep in contraction territory, one continues to rise: the one that should not be doing that: we are talking of course about prices paid which rose again, from 52.9 to 54.0, beating estimates of 54.0, and resuming its ascent since the start of 2023. In fact, compared to an 8-month lagging CPI print, one can be assured that we have seen the lowest CPI prints for this cycle …
… by days end, mkts wrap …
ZH: Semis Slaughtered As September Starts Off With Carnage Everywhere
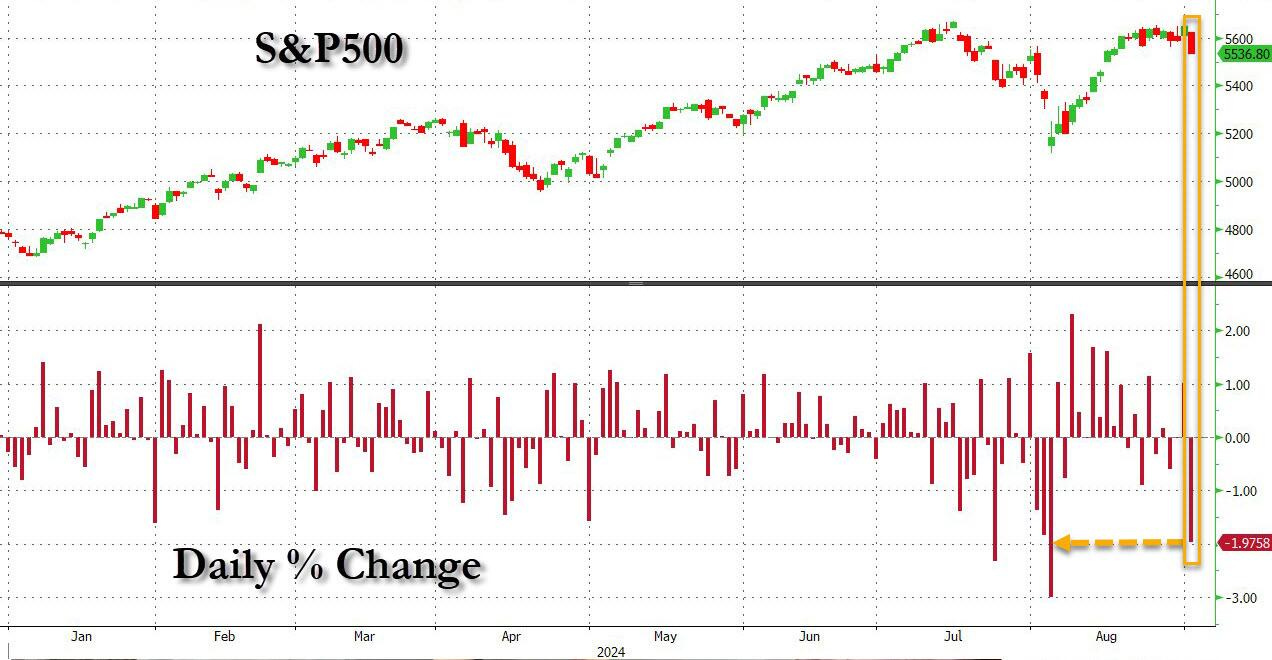
… And boy were we right: traditionally the worst month for stocks, bonds, gold and bitcoin, September started off with a bang - not a whimper - which saw the S&P plunge 2.4%, its biggest drop since the August 5 meltdown and its worst start to a month since May 2024 when the S&P plunged 2.8%...
… but, but … rate cuts? … here is a snapshot OF USTs as of 646a:
… and for some MORE of the news you might be able to use…
NEWSQUAWK: US Market Open: Equities continue to slip lower, DXY flat ahead of US JOLTS & JPY gains … Bonds are incrementally firmer, taking impetus from the subdued risk sentiment; EZ/UK PMIs had little impact on the complex … USTs are slightly firmer ahead of US JOLTS Job Openings, which marks the first jobs release ahead of ADP and NFP throughout the week. Currently, toward the mid-point of 114-00+ to 114-09 bounds, eclipsing yesterday's best.
Finviz (for everything else I might have overlooked …)
Moving from some of the news to some of THE VIEWS you might be able to use… here’s SOME of what Global Wall St is sayin’ which ranges from BLAME ISM to it’s NOT ‘bout ISM …
BARCAP: Manufacturing ISM still lackluster in August
The ISM manufacturing composite firmed somewhat in August, but remained at the lower end of the lackluster range that has prevailed since late 2022. This firming mainly reflected indications of a return to stockbuilding, alongside signs of firming upstream cost pressures on domestic goods.
BARCAP: July construction spending drops but sees upward revisions to prior months
Construction spending fell 0.3% m/m in July, driven by declines in private construction spending. Today's data come alongside upward revisions to both May and June spending.
…The main catalyst for the sell-off was initially the latest ISM manufacturing print, which renewed investors’ concerns that the US economy is running out of a bit of momentum. The release came in beneath expectations yet again, at 47.2 in August (vs. 47.5 expected), which was only a modest pickup from the disappointing July reading. On top of that, the new orders subcomponent fell to its lowest since May 2023, at 44.6. So there really wasn’t much good news to focus on at all, and it’s added to the downbeat backdrop ahead of Friday’s all-important US jobs report. On that the employment subcomponent did pick up from a 4-year low of 43.4 last month to 46.0 but this is still low, and the 17th month below 50 in the last 20 months. However, this has been a period when overall payrolls have been strong so the manufacturing read through to the rest of the economy is certainly not automatic…
…As investors priced in more rate cuts, that led to a fresh rally among US Treasuries that took the 2yr yield (-5.3bps) to just 3.86%. That’s the lowest closing level for the 2yr yield since the regional banking turmoil in early 2023, and the 10yr yield (-7.2bps) also saw a sharp decline to 3.83% with a small additional -0.38bps dip overnight. This is bucking the seasonal trend as September has seen the Global Bond Ag decline for the last seven years with 10yr UST yields up in 7 of the last 8 Septembers. Still nearly 4 weeks of the month left though…
A week of key US economic data ends with the employment report on Friday and then the FOMC’s pre-meeting blackout period goes into effect. Given the focus on downside labor market risks, the report should be the main determinant of whether the Committee delivers a 25 or 50bp cut at its upcoming meeting.
If history is any guide, when the dust settles on the week and blackout begins, the market should be close to fully pricing the meeting’s eventual outcome. As today’s chart shows, the realized surprise in the fed funds rate relative to OIS pricing for it at the start of blackout has typically been less than 3bp, over the current cycle as well as the longer post-GFC sample. (The recent notable outlier was June 2022, when a big upside CPI surprise during blackout led the Fed to hike 75bp.)
The implication for this week is that the employment report is likely to leave pricing for September at around 28bp or 47bp of cuts vs. current pricing of 31bp (next week’s CPI report may leave scope for a bit more uncertainty than usual). As for the conditions likely to deliver each, an unemployment rate of 4.2%, or 4.3% with decent payroll gains (+130-150k) – outcomes in line with over 90% of forecasts in Bloomberg – should lead the market to price close to a 25bp cut. An unemployment rate of 4.4% or broader signals that the labor market is continuing to slow rather than steadying around current levels should lead the market to price closer to 50bp.
Does a tree falling in a forest make a sound if no-one is around to hear it? Does a market collapse in early August count if everyone was on holiday while it happened? These are the great philosophical questions of our time.
Now that September has arrived, there's no doubt everyone in the market will hear whatever we get out of Friday’s US jobs report and the Fed meeting on September 18. However, today’s CoTD shows that September has often been weak for many financial assets with the trend even more exaggerated in recent years.
Some stats for Septembers
Bloomberg's Global Ag bond index has seen a negative total return for each of the last seven Septembers.
10yr USTs have seen higher yields in 7 of the last 8 Septembers with Gilts higher 9 out of the last 10. In addition, the last 9 Octobers have seen higher Treasury yields as well. One argument for why this pattern may occur is that global bond issuance (government and corporate) dries up over the summer holidays (encouraging a bond rally) and then surges in September and October (encouraging a sell-off)…
…The S&P 500 has been lower for the last four Septembers.
By the end of the month, we’ll also be just 5 weeks away from the US election and close election races (as this still is) usually promote sideways to lower equity markets in the build-up, before a big rally whoever wins after the event. This ties into the seasonals, as we’ve only seen 6 negative Novembers for the S&P 500 since 1995 with 11 of the last 12 higher.
So seasonals do matter! They won't work every year but on balance the trends have worked well over several decades.
Bonds rallied as risk-off sentiment dragged risk-assets lower. Significant euro and dollar issuance did not seem to prevent the decline in yields. Markets are already pricing in significant central bank easing and thus the front end of US and eurozone yield curves had less room to fall
NatWEST: US Election Preview (table on p13 for RATES/curves reactions which range from dem sweep and modest bear steepener to dem split = bull flattener a DJT split = bullish and DJT sweep = bear steepener is what catches MY attention and makes worth a click)
Unpopularity Contest Vice President Harris is riding a wave of momentum, enough to push her to be a modest favorite. Republicans have an edge in the Senate, making a Harris sweep not impossible, but less likely. The Harris legislative agenda may not be fully implemented even in Democratic sweep scenarios given a likely extremely narrow Senate majority. We think divided government likely sees lower USTs and flatter curves as markets price out more extreme fiscal scenarios possible under united government. A Trump presidency is more likely to come in a sweep, unlocking risk of fiscal stimulus, tax cuts, and higher deficits. A return to America First trade and foreign policy each imply a stronger USD on a Trump victory, but potential Fed changes and Trump’s desire for a weaker USD add uncertainty. We think a Harris win, especially one with divided government, points to continuity in policy and would mean a weaker USD as markets price out Trump scenarios.
We present one chart that suggests the early August turbulence might not yet be over
We have always exhorted our readers to watch Japan closely as it has consistently been a forerunner of major market moves (eg the late 1990s tech bubble started to deflate first in Japan). Until the implosion of the yen carry trade in early August, there was very little investor interest in Japan. That has now changed…
… Any normalisation of Japanese interest rates would have a major market impact - not just in the short term (by unwinding the yen carry trade) but also in the longer term as higher Japanese interest rates would curtail the exporting of investment flows. I can remember back before the Japanese bubble burst when 10y bond spreads were only 75bp vs the US (in September 1990) instead of the current c300bp spread now! Yield convergence would have a profound effect on the investment outlook. One chart though stands out as showing Japan has already converged back with the US…
Equity markets had one of their funny turns yesterday. Some commentators, searching for scapegoats, want to blame the US ISM manufacturing sentiment poll. This seems unfair, as the ISM sentiment poll does not know what it is doing. Despite sentiment signaling five months of contraction, US manufacturing output is above where it was at the start of the year.
Do these sort of financial market moves matter in the real world? Wealth effects are not as large as the headlines might suggest. Wealth effects aside, central banks only need to be concerned if markets become disorderly and threaten financial stability (per the UK’s Truss debacle, for instance), or if markets are reflecting a change in economic fundamentals. Neither seems to be the case at the moment.
US data dominate the calendar. The JOLTs job openings data is expected to decline, reflecting reduced churn in labor markets. It will still be above pre-pandemic levels, reflecting a structural shift in recruiting (the lower cost of advertising jobs allows companies to “fish” for staff without necessarily having openings).
US July factory orders data are expected to bounce back from a weaker June figure. US trade data rarely excites—surprising given the rise of economic nationalism and tariffs being imposed on US consumers.
Wells Fargo: ISM Rises for the Wrong Reasons in August
Summary A headline increase to 47.2 for the ISM manufacturing index says more about a back-up in inventories than it does about a meaningful improvement for the factory sector. Excluding the inventory contribution, the index would have been down 0.8 points.
Wells Fargo: Construction Spending Dipped in July Residential and Nonresidential Outlays Both Declined
Summary High Interest Rates Remain a Headwind for Construction
Total construction spending declined 0.3% July. The monthly drop was owed to a pullback in both residential and nonresidential outlays. Although total spending is still up 6.7% over the past year, construction activity is losing momentum as elevated financing costs narrows the pipeline of new projects getting started. Lower interest rates should eventually help bring about a turnaround, however ongoing weakness in the forwardlooking Architecture Billings Index (ABI) suggests a material recovery is still off in the distance.
What will lower interest rates mean for commercial real estate? We hope you will join us for a webinar on Wednesday, September 25 at 1:00pm ET for a discussion on the findings of an upcoming special report covering the economic and commercial real estate outlook titled Is the Tide Turning for Commercial Real Estate?
The latest data from the Treasury shows that the US government now pays out on average $3 billion in interest expenses per day, including weekends, see chart below.
If the Fed cuts interest rates by 1%-point and the entire yield curve declines by 1%-point, then daily interest expenses will decline from $3 billion per day to $2.5 billion per day.
Bloomberg: September Gets Started With Déjà Vu From August (Authers’ OpED) The first day back after Labor Day was terrible for stocks — wake me in October.
…The Philadelphia Stock Exchange semiconductor index, charting the most exciting stocks of the moment, had its worst day since March 2020, when Covid-19 hit; the market cap of Nvidia Corp., the phenomenon of the age, fell by $280 billion, the most ever by one company in one day; oil prices dropped to their low for the year; the S&P 500 fell more than 2% for the first time in a month; and the VIX rose by 33% to top 20 points once more, a volatility level that typically suggests that anxiety is high.
What’s most alarming about all this is that the best explanation anyone could offer was the date. September is historically the worst month for the US stock market (although that has much to do with the fact that the 9/11 terrorist attacks and the Lehman Brothers bankruptcy both happened in this month)…
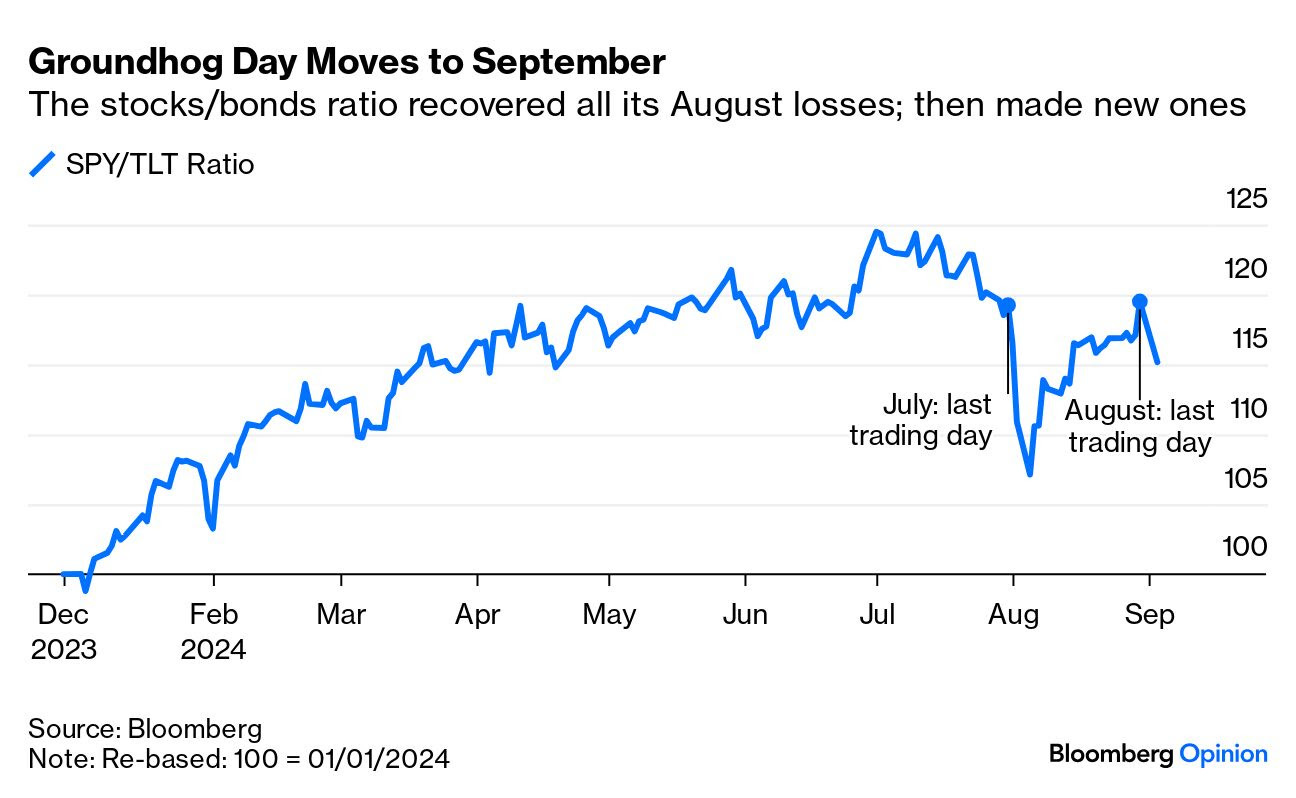
…Flight to Safe Havens: Gold, the most obvious haven, dropped slightly Tuesday. So did Bitcoin, its putative modern high-tech replacement. Bond yields fell, so there was some move to havens, but not by a lot, and still not as far as during the scare in early August. Using the biggest exchange-traded funds for the S&P 500 and 20-year bonds as a proxy, stocks had recovered to exactly their level of July 31 by the end of last month, and started September the same way they started August:
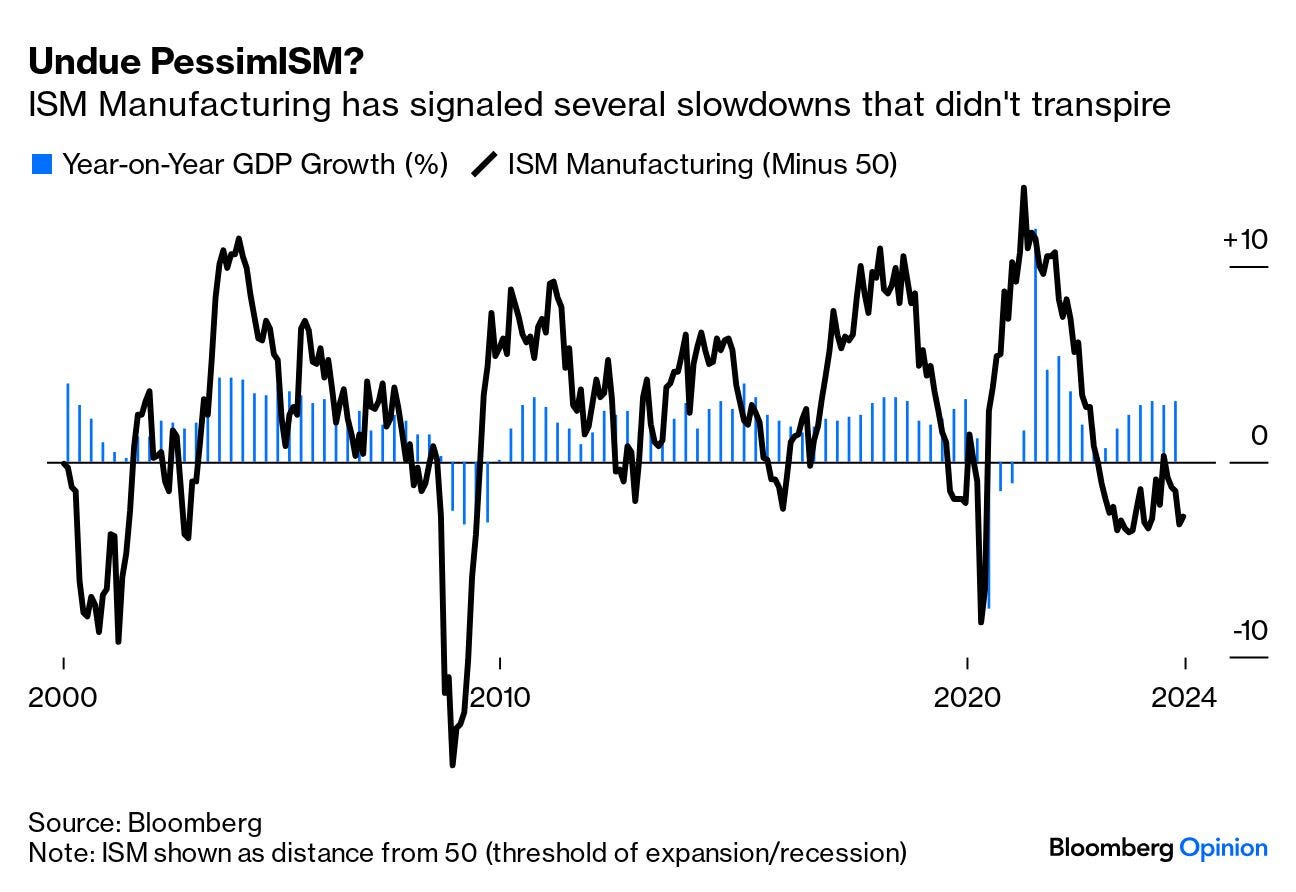
…How seriously should we take ISM? Manufacturing is an ever smaller part of the US economy, and its strength as an indicator looks increasingly questionable. So far this century, the ISM has dipped below 50, the notional threshold between expansion and recession, five separate times without a slowdown resulting. That’s a lot of false positives. This time, it has shown manufacturing in horrible trouble for a while:
…Unemployment. On Friday we will get the August unemployment data report. Expectations are for a rate of 4.2% which is slightly lower than last month’s surprising 4.3% reading.
This has quickly become the focal data point since the Fed kept rates flat just two days before last month's reading. That reading spiked unexpectedly higher and caught markets by surprise igniting a rapid and short-lived sell-off in the market.
The Fed has since stated that due to a rise in unemployment and in order to maintain their dual mandate of lowering inflation while keeping the labor market stable that they now have the ammunition to cut rates as early as their September 18th meeting.
Let’s see if we get any surprises this Friday. Clearly the market is watching this number closely.
September Preview… I’m not quite sure Green Day was referring to the stock market when they wrote Wake Me Up When September Ends, but given its historical results the song is apropos.
September is the worst month for the market, period. The below chart from 1980 to now shows it's the only month that is negative on average. You can go back to 1928 and it is still negative.
So what exactly causes this ”September Effect”? There are several theories, but none seem to provide a simple, logical answer. Theories range from people back from summer vacation readjusting their portfolios locking in gains and tax harvesting losses. Some argue parents liquidate assets to pay for education (fun fact - this is true in my case).
Whatever the real reasons, it's a statistical fact that for nearly 100 years, going back to 1928, it is the worst performing month of the year with only a 55% chance that it finishes higher during that time.
How about election years? Great question, let's take a look.
Since 1980, it is also lower during election years while surprisingly August has been the best performing month. The two month period before the November election has been consistently weaker, but October is the weakest month and then we finish the year off strongly.
That pattern has played out to form over the last two election cycles which also has one similar characteristic to it as this current cycle does - it involves Donald Trump.
Remember 2016?
That was a controversial election. There was much uncertainty about what the outcome may be and we saw extreme volatility going into Election Day.
What happened after Election Day? The market formed a near term bottom and then rallied into year end.
Remember 2020? …
Hedgopia: S&P 500 Itching To Break Out At 5640s; Large-Cap Momentum Unlikely To Sustain Unless Tech Gets Mojo Back
Sherwood: Your portfolio’s missing puzzle piece is finally back
The negative correlation between stocks and bonds returned during August’s market unrest.
One side effect of the disruptive, violent price action across financial markets in August: it seems to have restored some normality to a key relationship in the investment universe.
Stocks and bonds aren’t moving in the same direction any more.
The 21-session correlation between the daily change in the S&P 500 and long-term US Treasury bonds is now at its most negative since the second quarter of 2023, when the stock market was rebounding following the mini-crisis in regional banks.
Through most of the past two years, stocks and bonds have been moving in tandem. Surprisingly, persistently hot inflation was putting upward pressure on interest rates, and traders bet that these higher borrowing costs (along with high prices!) would eventually put enough pressure on businesses and consumers that the economy would tip into recession…


Many on WS are waiting for the NFP report on Friday....
A report that has recently been shown to be subject to a 30% revision......
Sometimes, I wonder about the intelligence of the people on WS......