…Economist Rudi Dornbusch is known to have said that economic expansions do not die of old age; they are murdered.
This has been true for the last 50 years:
2020 = COVID 2008 = Financial Crisis, $145 crude oil 2001 = Tech crash/9/11 1991 = Iraq invaded Kuwait (400% rise in crude) 1982 = 200-year high in interest rates 1980 100-year high in inflation 1974 = Arab Oil Embargo
Too many think the economy will either roll over or "pop." It does not work that way. It does not die of old age.
In a capitalist economy, investors, like most of those reading this, give money to good ideas and take it away from bad ideas. This means the economy continuously self-adjusts, so the natural state is to expand and grow 90% of the time…
… AND for somewhat MORE on CLAIMS at 231k as the GOTCHA! moment for Team Rate Cut, well … a rather large German institution has a few words just below, asking IF, “…231k initial claims high enough to go long the front-end? Not yet...”
Fair and balanced? From the buy or sellside to the WHYSIDE … let the thinkers think and you as the asset managers and / or traders … well, go ahead and TRADE whichever view you choose…
Meanwhile, back at the ranch, Yellen celebrated as …
ZH: Yields Slide To Session Low After Stellar 30Y Auction
… and by days end …
ZH: Gold, Bonds, & Stocks Rip After 'Bad' Data On 'Quietest Day Of The Year'
… so, no selling of quiet markets but are we supposed to BUY them? THAT memo never went around (or I missed it over the years…).
Here’s a DAILY look at ‘The Belly’ … will update longer-term visuals over the weekend, ‘weather permitting’ …
5yy DAILY:
… here is a snapshot OF USTs as of 705a:
… HEREis what this shop says be behind the price action overnight…
… WHILE YOU SLEPT Treasuries are slightly richer with the long-end leading on ~85% 30d volumes. Overnight activity was generally choppy in a ~2bp range, with a few blocks in Tokyo: 15.7k FV buyer, 8.8k TU seller, 3.7k UXY sale. Desk flows saw fast$/programmatic sellers in the long-end overnight, while London hours has seen some sociable bank demand arise in bonds. With Fed-speak and U-Michigan sentiment data on the docket, we see a general risk-on tone after the constructive wrap-up of supply (for USTs and IG). APAC equities were up overnight (KOSPI +0.6%, NKY +0.4%, HSI +2.3%) and European/US bourses are looking sanguine as well here at 7am (DAX +0.6%, FTSEMIB +1.1%, Nasdaq +0.4%). Crude is also back within shouting distance of $80, Gasoline futures +1%, and Copper is rallying 3% on the session so far. Gilts are seeing decent outperformance (10y -3.5bps) with a flattening bias seen across EGBs (Gmy 2s10s -2.5bps).
… and for some MORE of the news you might be able to use…
NEWSQUAWK: US Market Open: Equities firmer, GBP benefits post-GDP ahead of a slew of Fed speakers & ECB Minutes … USTs are flat, EGBs bid though to a lesser degree than Gilts, which have shrugged off hawkish GDP data … USTs are flat with specifics light thus far though the docket ahead is packed with multiple Fed speakers. USTs are holding at 109-03+ matching yesterday's auction-driven high but still a handful of ticks shy of the WTD peak at 109-09.
Initial claims jumped 22k, to 231k, in the week ended May 4. While the latest estimate intensified sentiment that the labor market might be slowing faster than expected, the jump is exaggerated by one-offs from distribution industry layoffs in the New York area.
… While the latest estimates pose risks that significant slowing in the labor market may be afoot, our view is that they reflect a return to prior norms following unusually low readings in mid-April. This return would be broadly consistent with April's slower increase in payroll employment (+175k), which fell about 65k short of consensus forecasts -- which were conditioned, in part, upon signals from the low level of initial claims. We retain our view that the FOMC is most likely to initiate cuts in September, at the soonest, and that it is quite unlikely that the committee would bring forward the timing of cuts based on anything less than a material deterioration in the labor market. Today's readings come nowhere close to surpassing that bar.
BARCAP US CPI Inflation Preview (April 2024 CPI): Limited progress
We forecast a 0.39% m/m SA rise in headline CPI, taking the annual rate lower to 3.4% y/y. We estimate that core CPI decelerated modestly, rising 0.34% m/m, as an easing in services prices is partly offset by a rebound in core goods inflation, led by used cars. We forecast the NSA index to print 313.705.
… April inflation prints along the line of our forecasts will likely not give the FOMC confidence that inflation is progressing towards its 2% target. However, these estimates are also unlikely to fuel concerns of a re-acceleration in price pressures, and should support the FOMC's higher-for-longer stance. All told, we retain our baseline that the FOMC will cut only once this year, no sooner than September, with December being almost equally likely, based on our expectation that inflation will begin to ease June onward, aided by a moderation in labor market conditions.
We expect a modest easing in US core inflation in April, the first of a string of prints that should look lower than Q1’s numbers, albeit remain hotter than H2 2023 price data.
A fall in shelter inflation should lower core CPI inflation to 0.3% m/m rounded, we estimate, although the possibility of a delay to this moderation tilts risks to core inflation to the upside.
While some pullback in motor vehicle insurance inflation is likely, we think overall non-shelter services inflation will remain firm, with a more material moderation not occurring until H2 2024.
We think the Fed will welcome this modest progress but remain cautious on the inflation front, requiring multiple months of improved readings before seriously considering a rate cut.
DB: Is 231k initial claims high enough to go long the front-end? Not yet...
Today's initial jobless claims surprised the upside with 231k vs 212k consensus and 209k in previous print. In our last week's analysis on the application of the Sahm rule in trading, we find that using the Sahm rule as a trading rule can generate positive excess return and a quite good hit ratio for a single factor strategy, but at the expense of high volatility and missing half of a market rally. Current 4-week average of initial claims is 7.10% (red bars in charts below) above its 12-month low, which is very close to our first optimal trading threshold. If initial claims in next 4 weeks still stood at 231k, the increase from its 12-month minimum would reach 15.07% (orange bars in charts below). Both levels saw >60% hit ratios and positive excess return in backtesting (in both average and median terms), although they are not local optimal.
… That jobless claims data was the initial catalyst for the advance yesterday, and up until that point, S&P 500 futures had actually been in negative territory. The release showed that initial jobless claims were up to 231k (vs. 212k expected) in the week ending May 4, which was their highest level since late-August, and above every economist’s estimate on Bloomberg. But even though the data was weaker than expected, it meant investors grew more confident that the Fed would still cut rates this year, as it added to recent prints suggesting the labour market could be cooling. For instance, last week’s data showed job openings were down to a 3-year low in March, whilst the broader U6 measure of unemployment (which includes the underemployed and those marginally attached to the labour force) rose to its highest in over two years in April, at 7.4%.
But even with the uptick in jobless claims, this isn’t necessarily a leading indicator of a downturn. For instance, there was a previous spike last year, which pushed the 4-week average above 250k by late-June. But after that, the numbers came down again shortly afterwards, and there wasn’t a notable rise in the unemployment rate. And for the time being at least, the smoother 4-week average is still only at 215k, so it’s important to bear in mind that lots of other indicators are still looking more positive, and the Atlanta Fed’s GDPNow indicator is suggesting that Q2 growth will come in at an annualised +4.2% rate.
This belief in future rate cuts was supported by the Bank of England’s latest decision as well. The main headline was that they kept rates unchanged at 5.25%, in line with expectations. But unlike the March meeting, when the vote was 8-1 to keep rates on hold, there was now a 7-2 split after Deputy Governor Ramsden also voted for a cut. Moreover, there was an additional line in the statement, which said that the committee would “consider forthcoming data releases and how these inform the assessment that the risks from inflation persistence are receding.” Then in the press conference, Governor Bailey said that a cut at the next meeting in June was “neither ruled out nor a fait accompli”, and he suggested that the reductions in bank rate could be “possibly more so than currently priced into market rates”. There are two more CPI prints coming out ahead of the BoE’s next decision, so those will be in focus ahead of that, and this morning we’ve also got the Q1 GDP release shortly after we go to press.
Overall, the decision and these comments led investors to price in a growing probability of a rate cut by the next BoE meeting in June, with overnight index swaps raising the chance from 55% the previous day to 60% by the close. Front-end gilts also rallied on the prospect of faster rate cuts, with the 2yr yield coming down by -5.7bps. 10yr gilts did lose a bit of ground, with yields up +0.2bps, but that was actually an outperformance relative to the rest of Europe, where yields on 10yr bunds (+3.3bps), OATs (+4.3bps) and BTPs (+3.7bps) all saw larger moves higher.
Meanwhile in the US, Treasuries outperformed after the jobless claims data led futures to dial up the likelihood of rate cuts this year. For instance, 46bps of cuts were priced in by the December meeting at the close, up +1.9bps relative to the previous day. In turn, the 2yr yield was down -2.1bps to 4.82%. And 10yr yields were down -4.1bps to 4.45%, with long-dated Treasuries supported by a solid 30yr auction that saw the highest direct bidder share since July…
Goldilocks: Initial Jobless Claims Increase More Than Expected
BOTTOM LINE: Initial claims increased by more than expected, and continuing claims increased in line with expectations. Over half of the increase in initial claims took place in New York, and we suspect that seasonal adjustment difficulties around the end of the academic year could explain some of the increase.
MS CPI Preview: The Descent Begins (wasn’t it supposed to begin … like last year?)
We forecast core CPI inflation fell to 0.29%M in April (0.3%M cons, 3.6%Y annual rate). Core goods remain in negative territory, and services come in lower with softer car insurance inflation. We see headline at 0.37%M due to higher food and energy inflation (3.4%Y, NSA Index: 313.747).
RBC: It's hard to leave (higher rates) when you can't find the door (to lower inflation)
Highlights:
Upside inflation surprises year-to-date in the U.S. will keep the Fed on the sidelines for now – we continue to expect the first cut to the fed funds target in December, contingent on both growth and inflation gradually and persistently slowing.
The Fed’s still hopeful that inflation can cool even if the economy doesn’t. But we think persistent unwinding in price pressures won’t come without some slowing in the economy.
In Canada, slowing growth momentum is reaffirming our call for a rate cut from the BoC in June.
The ECB and BoE are both expected to start easing around the summer as well, but at a slower pace after.
Media reports suggest US President Biden plans to announce new taxes on US consumers of products from China, specifically, electric vehicles and solar products. These taxes are not as broad as the consumer taxes imposed by US President Trump, but they are reflective of the trends of scapegoat economics and prejudice politics. Economic nationalism is a specific manifestation of those trends.
US May Michigan consumer sentiment reminds investors why sentiment polls should not be trusted —the gulf between registered Democrats’ and registered Republicans’ views highlights the problems of surveying a polarized society. Inflation expectations will only reflect current food prices (falling in a third of cities) and fuel prices (generally rising). Inflation expectations do not matter much (economically) if people do not act on those expectations…
One of our competitors claims that we are in a recession. Another claims that we will soon be in a recession. The most widely anticipated recession of all times is turning into the longest widely anticipated recession of all times.One day, the diehard hard-landers will be right. Was today the day? We're sure that their heartbeats quickened on today's jobless claims report. Consider the following:
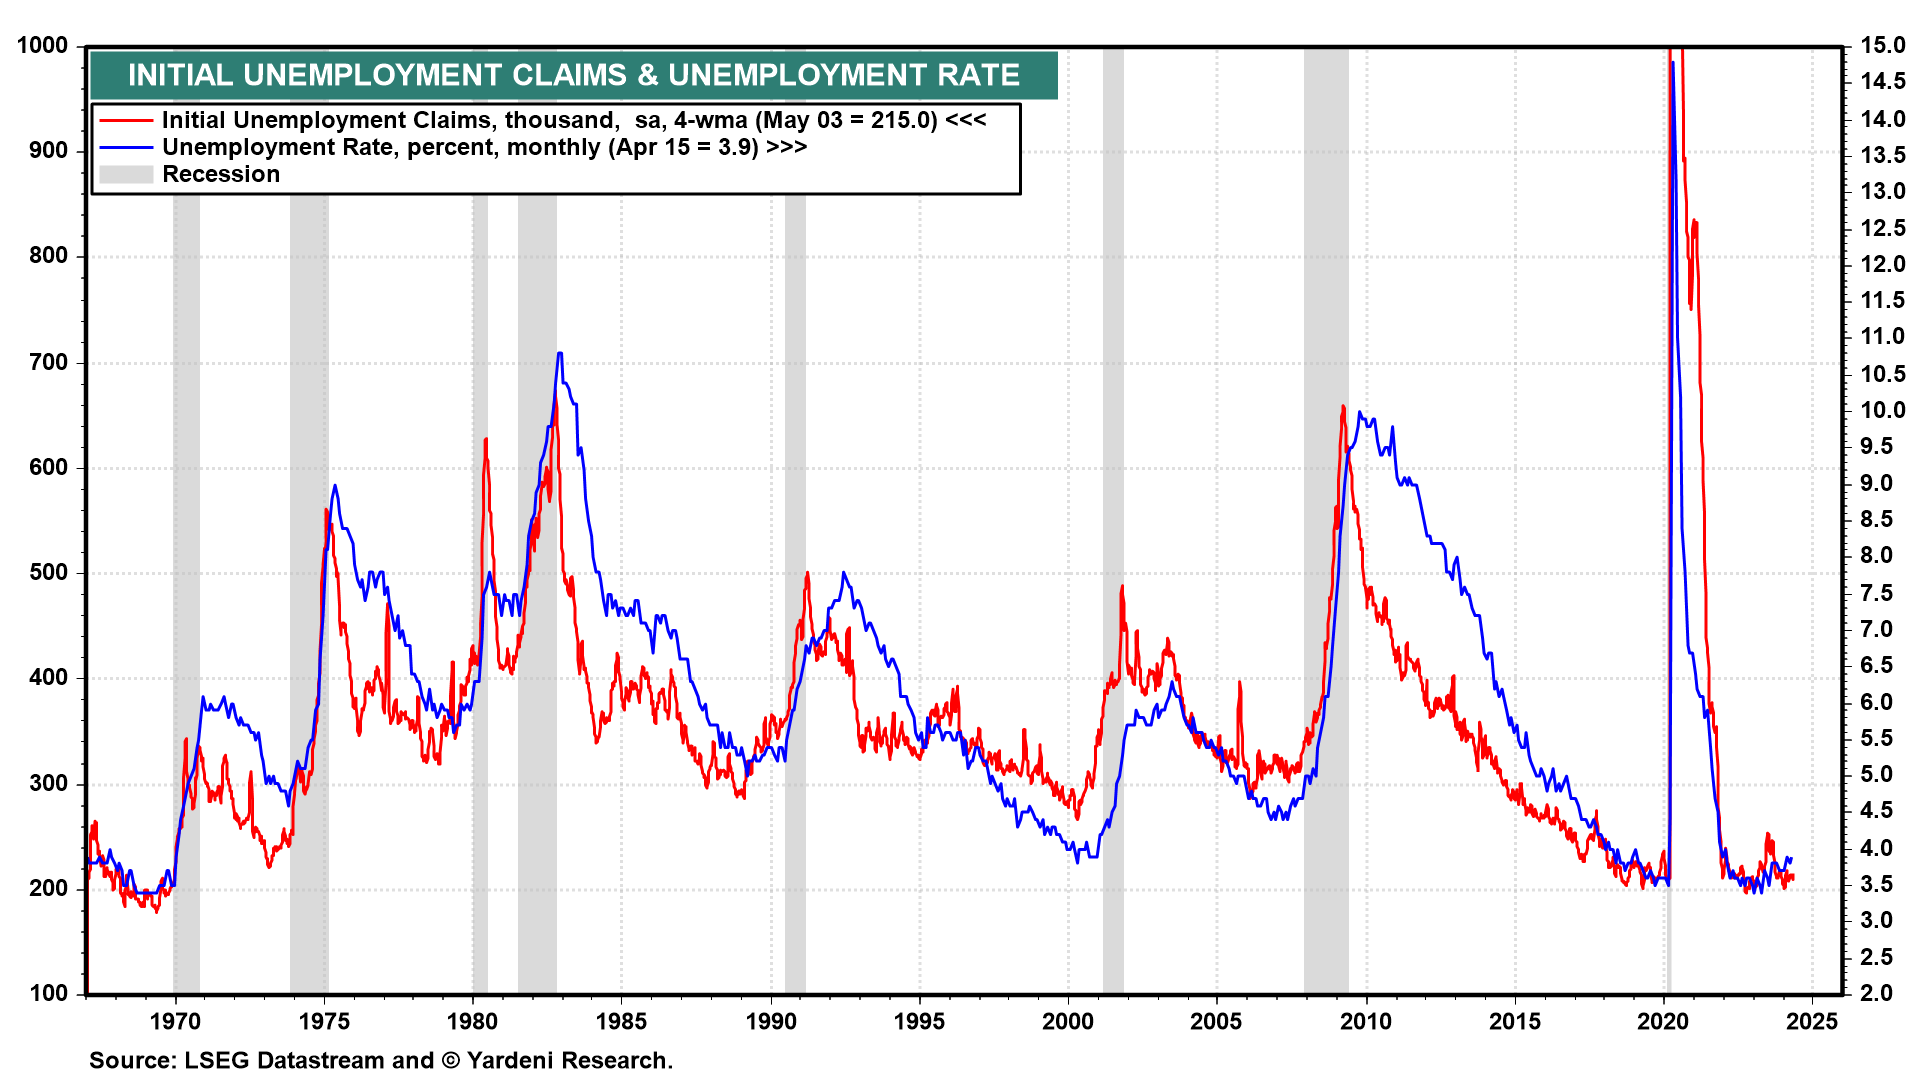
(1) Initial unemployment claims hit their highest level since August during the May 4 week. They rose 22,000 to 231,000 (sa [seasonally adjusted]), one of its first meaningful increases after a string of low readings. Recall, jobless claims are often a good leading indicator for where the economy is heading—managers don't reduce their payrolls when they're looking to expand their business. This comes on the heels of April's nonfarm payrolls print, which showed the smallest employment gain since October. Furthermore, the unemployment rate ticked higher last month to 3.9% (chart).
However, the unemployment rate is best correlated with the four-week average of jobless claims, which remained low at 215,000. We won't be surprised if the jobless rate remained below 4.0% in April for the 28th consecutive month. If the latest data signal a recession, then so far it is mostly in New York, which saw an increase of more than 10,000 (nsa [not seasonally adjusted]), accounting for more than half the total gain of 19,690 (nsa).
(2) The labor market remains robust, to be sure, but employees who see fewer opportunities might be more hesitant to ask for a raise or quit outright. Indeed, growth in wages is quickly falling from its recent peak, and the number of quits is back down to pre-pandemic levels (chart).
(3) In our opinion, S&P 500 forward earnings per share is an excellent coincident indicator of nonfarm payroll employment in private industry (chart). That makes sense since profitable companies hire, while unprofitable ones fire. Forward earnings rose to a record high during April, consistent with a solid labor market. So we don't buy the claim that the latest jobless claims is just the beginning of a significant downturn in the labor market and the economy.
(4) Nevertheless, we won't be surprised if Fed officials start talking more dovishly. That should give stocks and bonds a boost, especially after their recent hawkishness sent bond yields higher and weighed on equities.
… And from Global Wall Street inbox TO the WWW,
Bloomberg: We Need To Talk About Recession Risk Again
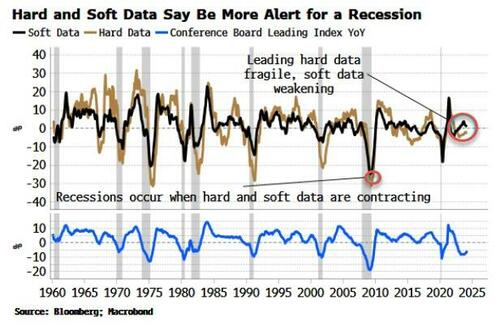
… The upgrading of recession risk has been prompted by the weakening in soft data in recent weeks, coinciding with hard data that remains fragile.
The manufacturing ISM is one of the single-most important data points for the economic and stock outlook…
… Recessions occur when both hard and soft data are contracting at the same time. Using the inputs to the Conference Board’s Leading Index, growth in leading hard-data has been turning higher, but is still contracting, while leading soft-data is close to slipping into the contraction zone. That would be ominous for recession risk.
Revisions will also be key to monitor. Typically data sees its biggest revisions before and after the occurrence of a recession. Data can be revised lower very quickly which is why recessions can happen faster in revised time than in real time.
What does all this mean practically for investors?
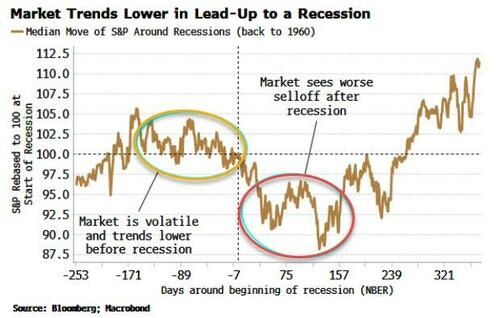
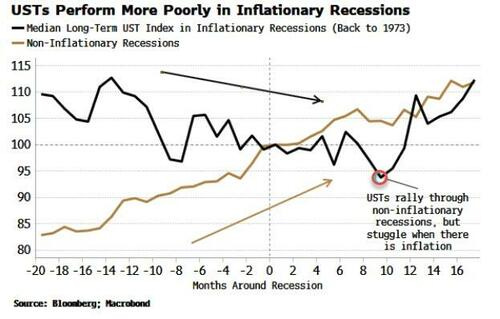
It leaves stocks more vulnerable. As the chart below shows, even though equities see a sharp drawdown after a recession begins (which, remember, we don’t know when that is until after the fact when the NBER announces it), they begin selling off beforehand. Moving to the right of the S curve means more volatile stock prices with a bias lower, even if it does not ultimately mean a full recession-like decline and an end to the bull market.
It also means bond yields are more likely to see some retrenchment in the coming months. But with elevated inflation in the background, bonds are primed to not rally as much as in non-inflationary recessions (see chart below). Moreover, yields are still structurally biased higher due to waning interest in owning USTs at current prices, and an inundation of supply.
Investing is about gauging forward probabilities. The probability of a near-term recession is currently low, but in a month’s time it could be much higher. That would be a lot of new information asset prices would have to quickly digest. A more nimble investment stance is advised at this trickier part of the cycle.
Bloomberg(via ZH): Stocks And Bonds Rise Together As Inflation Fears Take Backseat (banks buying / NOT buying .. caught ME attention :) esp in light of the above … cuz if we’re talking recession again then should banks be NOT divesting ? askin’ for a friend … and all those on Team Rate Cut)
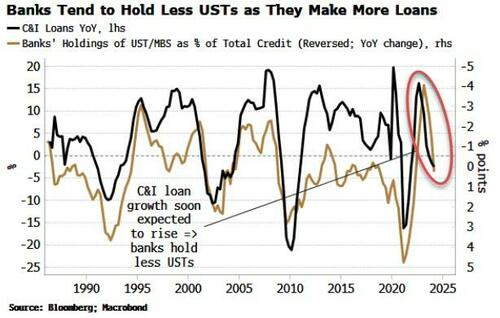
… Banks have also been on net divesting themselves of Treasuries and agency securities over the last two years from 33% of assets to 30%. There was little to suggest that is about to start rising again from the latest Senior Loan Officer Survey, released on Monday for the three months to the end of April. The net percent of banks tightening standards for C&I loans remained steady, after rising in the quarters since SVB’s bankruptcy. That leads C&I loan growth by about six-to-nine months.
As the chart below shows, banks tend to reduce their holdings of less profitable Treasuries when they make more commercial loans.
That continues to make it more likely the household sector will be the buyer of last resort for Treasuries, and if inflation continues to be a problem, demand a higher yield premium to do so.
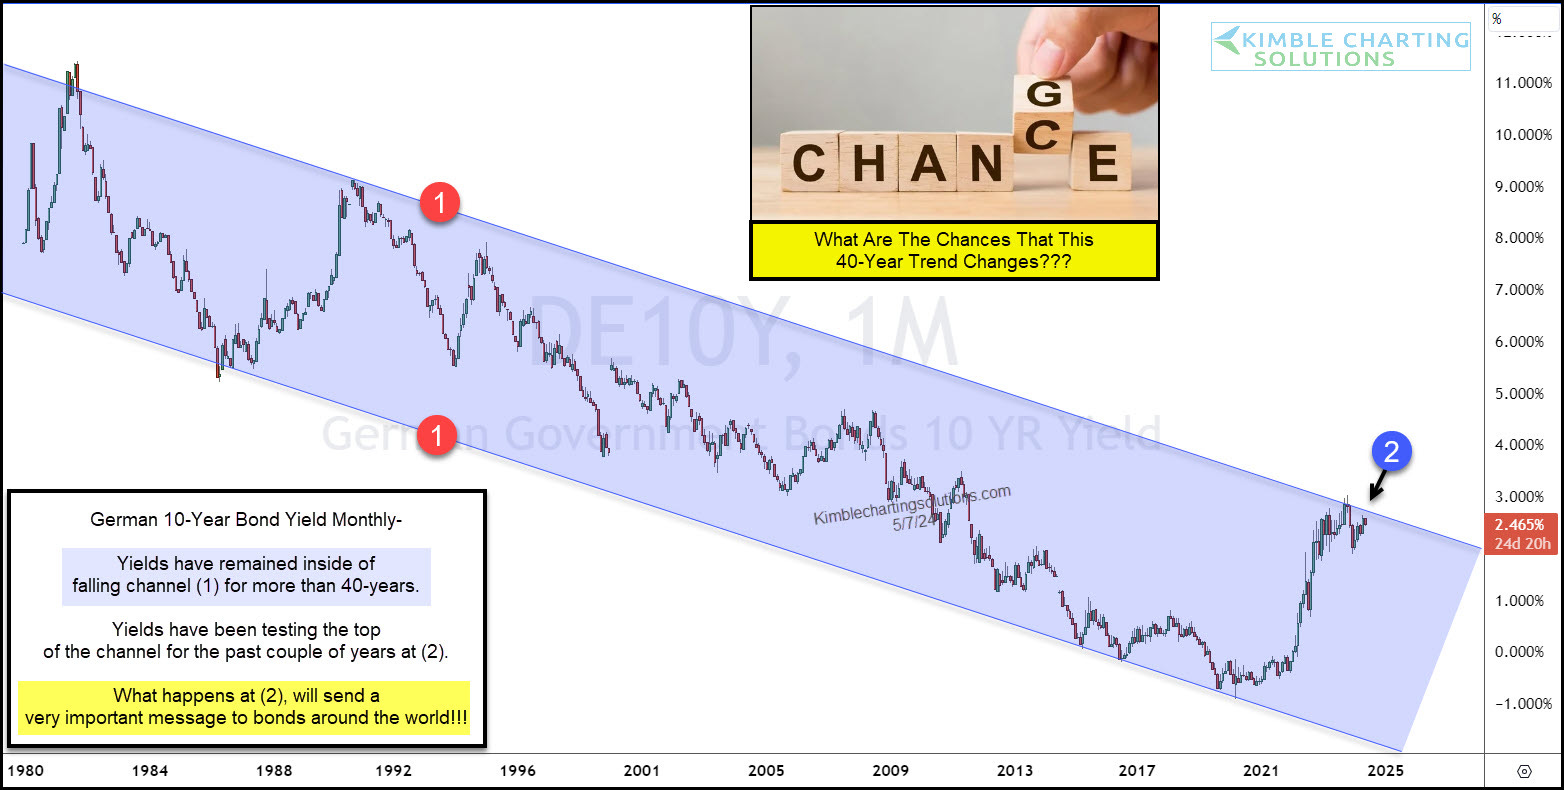
Kimble Charts: Is German 10-Year Bond Yield Nearing Historic Breakout? (as go Bunds so goes USTs?)
McClellan: Gold Shows an Oil Price Bottom Ahead - Chart In Focus (oh well … rate CUT / hike and election implications?)
WolfST: Our Favorite Recession Indicator: Next Recession Keeps Moving Further Out
It’s time again to look at the trends in claims for unemployment insurance benefits…
… Our favorite recession indicator. The number of people who are still claiming unemployment insurance benefits at least one week after the initial application – people who haven’t found a job yet – started rising out of the historic trough from late 2022 through March 2023. But by summer 2023, the number stabilized at what is still a historically low level, currently at 1.78 million.
A higher level of continued claims suggests that it takes a little longer on average for people to find a job after they got laid off.
This “frying pan” pattern, as we have come to call it, has started cropping up in a lot of economic data coming out of the pandemic, formed by an undershoot and then a return to normalization.
Recessions from the Great Recession back through the early 1980s began when continued claims for unemployment insurance spiked through about the 2.6-million mark (black line in the chart below).
Our indicator for an oncoming recession is when the blue line gets close to the black line. Today’s level of 1.78 million is far below recessionary levels, pointing instead at a labor market that is still tighter than in nearly all periods of the past 50 years.
What this labor market is telling us recession watchers here is that there is still no recession in sight, and we’ll just have to keep watching for it.
AND I’m done, for now. HOPE to have something over the (Mothers Day) weekend but if not, you know I’m out making last minute preparations … :)


Weapons of Mass Migration | NEW Documentary
https://www.theepochtimes.com/epochtv/weapons-of-mass-migration-5640408?utm_source=ref_share&utm_campaign=copy
Defending the Republic
Good News Friday.....
https://substack.com/app-link/post?publication_id=726749&post_id=144500024&utm_source=post-email-title&utm_campaign=email-post-title&isFreemail=true&r=1ecjk0&token=eyJ1c2VyX2lkIjo4NDU2NjAxNiwicG9zdF9pZCI6MTQ0NTAwMDI0LCJpYXQiOjE3MTUzNDEwMjUsImV4cCI6MTcxNzkzMzAyNSwiaXNzIjoicHViLTcyNjc0OSIsInN1YiI6InBvc3QtcmVhY3Rpb24ifQ.KjWkehLa8t9TgPmelL3weJ8tEYA_ir998DHMKBanJxI