while WE slept: USTs quiet, Bunds, Gilts lead; stripping demand SURGE (LDI community, #GotDuration, Barclays); "investors currently have the biggest steepener bias in the last 10 years" (BNP)
Good morning … As we begin this weeks duration supply ($58bb 3s, $39bb 10s and $22bb Bonds), I’ll lead with a look at 3s …
3yy DAILY: 4.00% psychologically important, then 3.90 / 87 (latter being 55dMA)…
… and note momentum (stochastics, bottom panel) do appear to be overSOLD and that is a good setup — ie CONCESSION — where risk / rewards seem balanced to favorable for some sort of ‘rental’ or dip buying …
… in as far as setup for this afternoons 3yr, a look at this mornings early set of data from small biz …
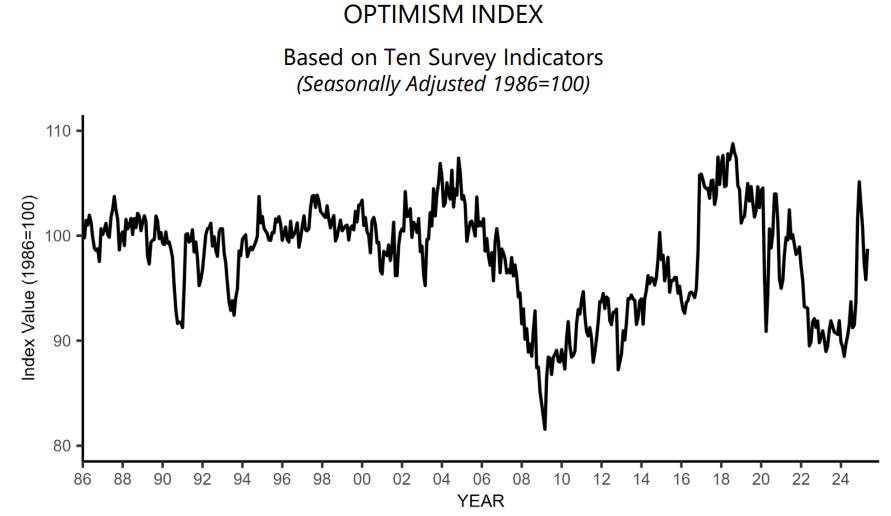
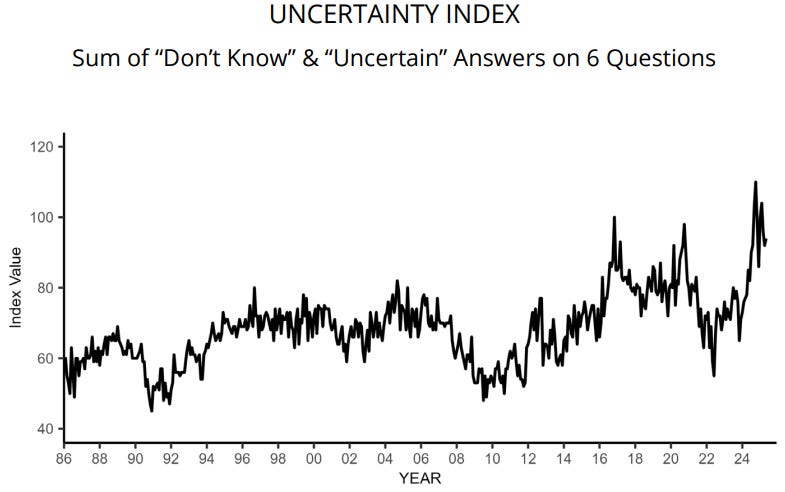
NFIB May 2025: Small Business Optimism Increases in May
The NFIB Small Business Optimism Index increased by three points in May to 98.8, slightly above the 51-year average of 98. Expected business conditions and sales expectations contributed the most to the rise in the index. The Uncertainty Index rose two points from April to 94. Eighteen percent of small business owners reported taxes as their single most important problem, up two points from April and ranking as the top problem. The last time taxes were ranked as the top single most important problem was in December 2020.
Although optimism recovered slightly in May, uncertainty is still high among small business owners. While the economy will continue to stumble along until the major sources of uncertainty are resolved, owners reported more positive expectations on business conditions and sales growth. -NFIB Chief Economist Bill Dunkelberg
Key Findings Include:
A net 1% (seasonally adjusted) of owners viewed current inventory stocks as “too low” in May, up 7 points from April and the highest reading since August 2022. This was the largest monthly increase in the survey’s history.
The net percent of owners expecting better business conditions rose 10 points from April to a net 25% (seasonally adjusted).
The net percent of owners expecting higher real sales volumes rose 11 points from April to a net 10% (seasonally adjusted). This component contributed the most to the Optimism Index’s improvement.
Twenty-two percent (seasonally adjusted) plan capital outlays in the next six months, up four points from April and the highest reading of this year.
The percent of small business owners reporting labor quality as the single most important problem for business fell three points from April to 16%.
Fourteen percent of owners reported that inflation was their single most important problem in operating their business, unchanged from April.
When asked to rate the overall health of their business, 14% reported excellent (up one point), and 55% reported good (down one point). Twenty-eight percent reported the health of their business was fair (up one point) and 4% reported poor (unchanged).
…. AND a quick check of the rear-view mirrors (says a guy who’s helping bring new driver safely onto the streets — everyone OFF the sidewalks!!) …
ZH: Inflation Expectations Tumble As Latest NY Fed Survey Suggests Fed Late To Cut
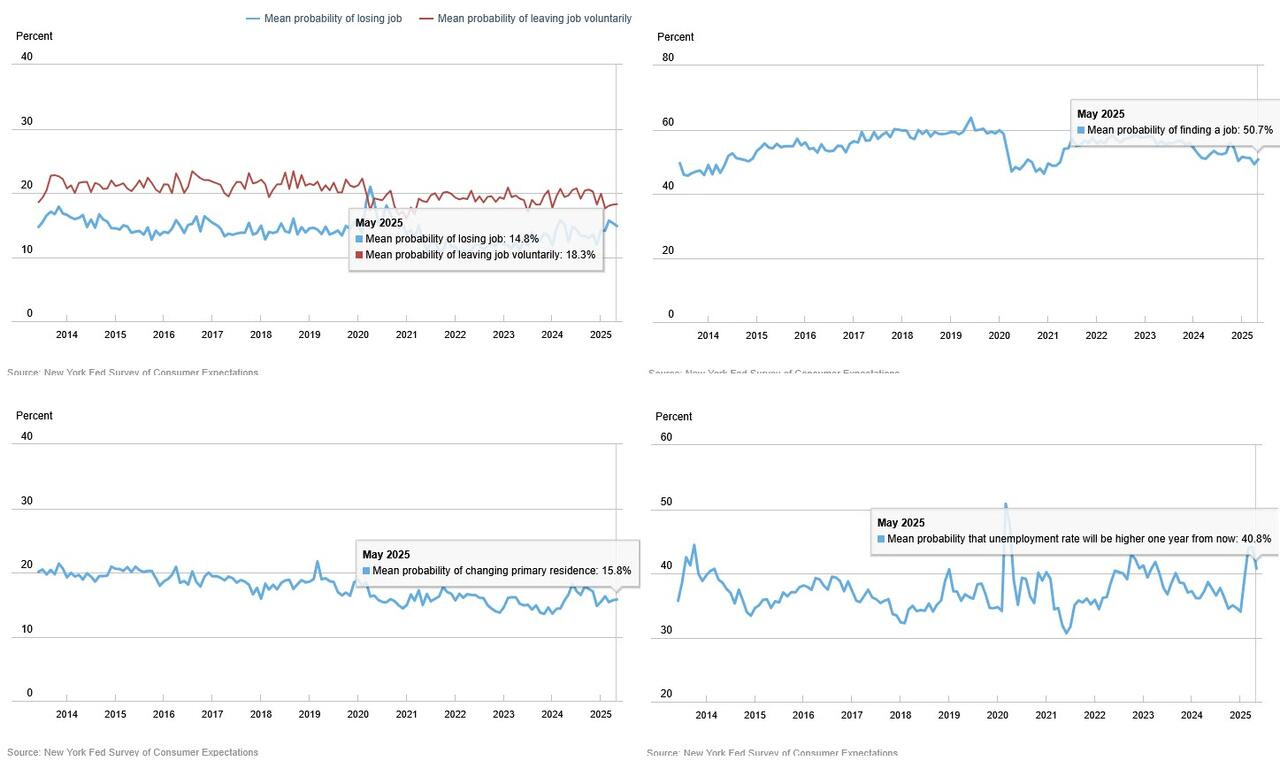
… It wasn't just inflation expectations that improved: Americans’ views about their job prospects also improved slightly in May. The perceived probability of losing one’s job in the next year dropped 0.5%, while respondents’ likelihood of quitting voluntarily ticked up. The mean expectation that the unemployment rate will be higher one year from now decreased 3.3% to 40.8%.
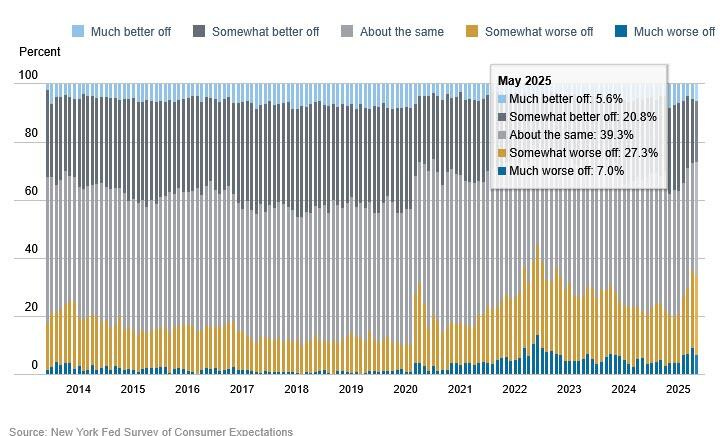
But wait, there was even more good news (ahead of the idiotic UMich report later this week): Households’ perceptions of their own finances also improved, with the share of respondents saying they will be worse off in a year declining slightly.
… Finally, the mean perceived probability that the US stock market will be higher 12 months from now increased.
Average perceived probability of missing a minimum debt payment over the next three months decreased by 0.5 percentage point to 13.4%, the lowest level since January 2025.
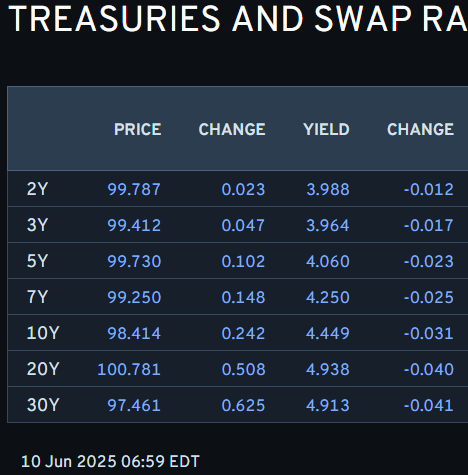
… this all seems to ME to bode well for front-end supply today, at the very least … I’ll keep going but first … here is a snapshot OF USTs as of 659a:
… for somewhat MORE of the news you might be able to use … a few more curated links for your dining and dancing pleasure …
NEWSQUAWK US Market Open: US equity futures lacklustre and Fixed bid as US-China talks commence; Lutnick says they are “going well” … Gilts outperform as the UK labour market cools, USTs await US-China day two and 3yr supply ... USTs are broadly in-line with Bunds though the magnitude of gains is a little less, given that US equity futures have proven to be more resilient than European peers this morning; though, US equity sentiment is still very much on the back foot. Thus far, this has taken USTs to a 110-12 peak. If surpassed, Friday’s pre-NFP high resides at 110-29. The US data docket is light, focus turns to US-China talks in London and a 3yr auction thereafter.
Finviz (for everything else I might have overlooked …)
Moving from some of the news to some of THE VIEWS you might be able to use… here’s some of what Global Wall St is sayin’ …
This first one was mentioned in an email to me from a contact with A Terminal and I’m thankful to have stumbled on the note — better late than not at all, especially ahead of this weeks duration on offer …
In the US, incoming hard data show gradual moderation, including the labor market. The absence of adverse fiscal news has allowed the long end to outperform globally. In Europe, markets are stuck awaiting clarity on various fronts. In Japan, supply-demand for superlongs likely will remain in focus.
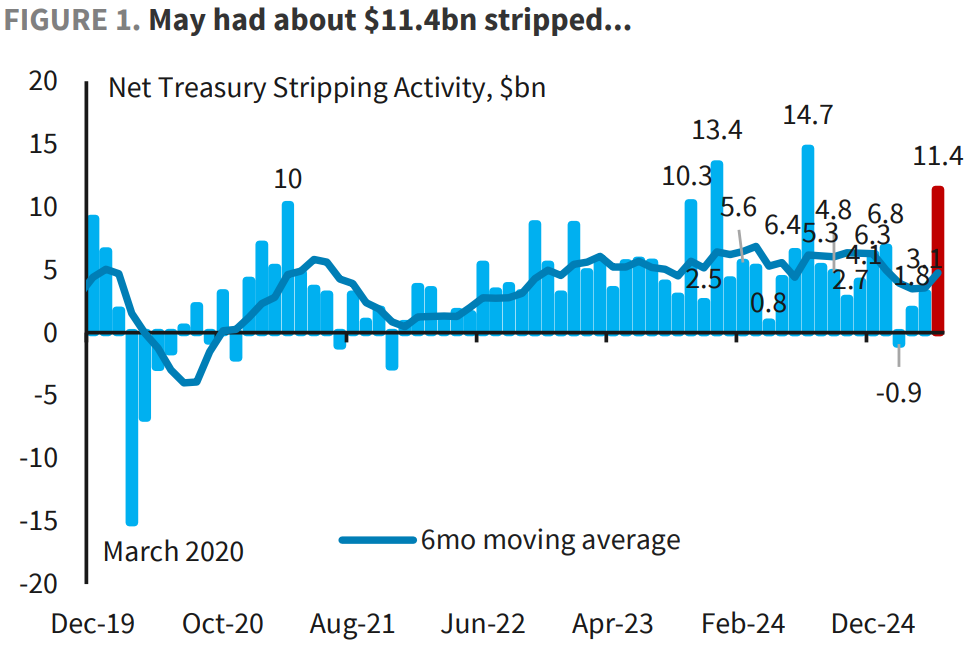
…United States: Treasuries Stripping demand surges amid long-end sell-off in May May stripping activity surged to $11bn, the fourth largest monthly volume on record. Stripping activity was concentrated at the long end, notably in Feb55s, which saw $6bn of demand. Improved pension funding ratios and higher discount rates are driving LDI demand to lock in higher yields.
Summary: Long-end Treasury yields increased sharply in May. The move reflected reduced recession fears driven by easing tensions on the tariff front between the US and China as well as concerns around the fiscal outlook from the House tax bill and the broader rate sell-off across developed markets.
May saw $11.4bn notes and bonds net stripped ( Figure 1), which was the fourth largest monthly stripping volume on record and higher than historical averages for the month ( Figure 2). Most of the pick-up in stripping demand was in the 2050+ maturities with $9.3bn net stripped, concentrated in the February maturities ( Figure 3 and Figure 4).
Pension funding ratios improved in May, supported by higher discount rates and a rebound in equity markets. Historically, stripping demand tends to rise when long-end forward rates increase, as LDI investors seek to extend duration at more attractive yield levels. The notable pick-up in stripping activity during the month points to strong long-end demand from the LDI community, in our view.
Overall, strong stripping demand in May pushed the year-to-date stripping pace to $22bn, which was already ahead of the same period in 2024.
Best in the biz much like Seinfeld — a show about nothing — a recap of whatever was (or wasn’t) yesterday …
…Treasuries put in a reasonable showing on Monday with the front-end of the market outperforming, albeit well within the prevailing range. In fact, the price action was more about partially retracing Friday’s NFP-inspired selloff. This isn’t to downplay the relevance of the above-consensus payrolls print, but rather to acknowledge that the magnitude of Friday’s move was as much about positioning as it was responding to yet another better-than-expected employment update. Clearly the market had gotten a bit ahead of itself by pricing in the downside risks for the labor market resulting from the uncertainty associated with the trade war. Of course, the risk remains that as each incremental solid payrolls print reinforces the ‘resilience’ narrative, waiting for the Godot of a softer labor market will become increasingly tiresome – at least from the perspective of it being a bond-bullish underpinning…
…The real wildcard for the week appears to be the 10- and 30-year auctions. Investors are eager for any sign that demand for Treasuries has materially fallen based on the trade war. While supply events thus far since Liberation Day have shown the opposite, the allure of the narrative remains compelling to the bond bears and auction are seen as the most likely moments for such weakness to occur. Recall that the last 20-year auction tailed an average amount (1.1 bp) for a refunding 20-year, but still triggered a sharp selloff and chatter about lackluster demand for US duration. The market remains vulnerable to any sign of weakness in this respect and while we’re biased for another solid round of takedowns, we’re all too cognizant that many in the market are eager for a pullback in non-dealer awards…
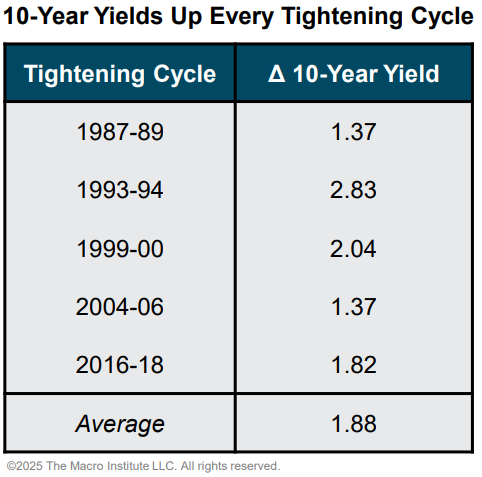
… following up YESTERDAYS note / idea that steeper curve might offer compensation for uncertainty …
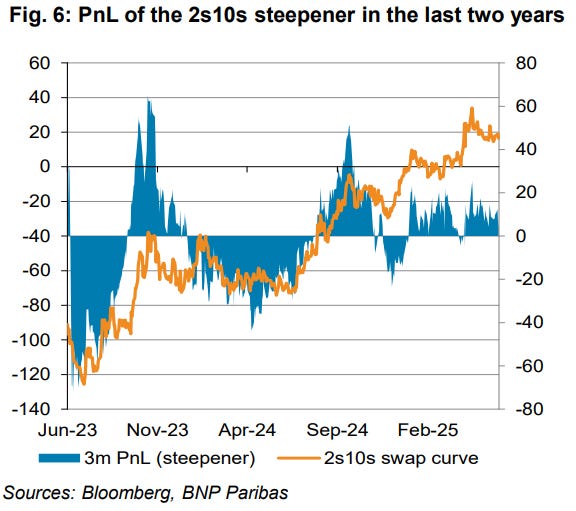
BNP US rates: Steepeners – big, but not as beautiful
Investors keep telling us the curve steepener is a beautiful trade, and they are positioned big(ly) in it. Our new Curve Option Skew Indicator (COSI) – a metric to measure the market’s curve positioning bias – shows that investors currently have the biggest steepener bias in the last 10 years.
We doubt that steepeners are as beautiful as they are big. These trades (1) have only worked in spurts when adjusted for negative carry and (2) are very crowded, while (3) a modest slowdown in growth, a more benign deficit path (our view) and the possibility of coupon cuts are all pathways to bull flattening.
We suggest 2s10s conditional bull flatteners. This trade does well within our core view of better-than-feared deficits and a modest slowdown in growth, but doesn’t lose if grey swan risks such as a “Liz Truss moment” materialize in Treasuries.
I interrupt for a couple more techAmentally driven charts from one of the best in that biz …
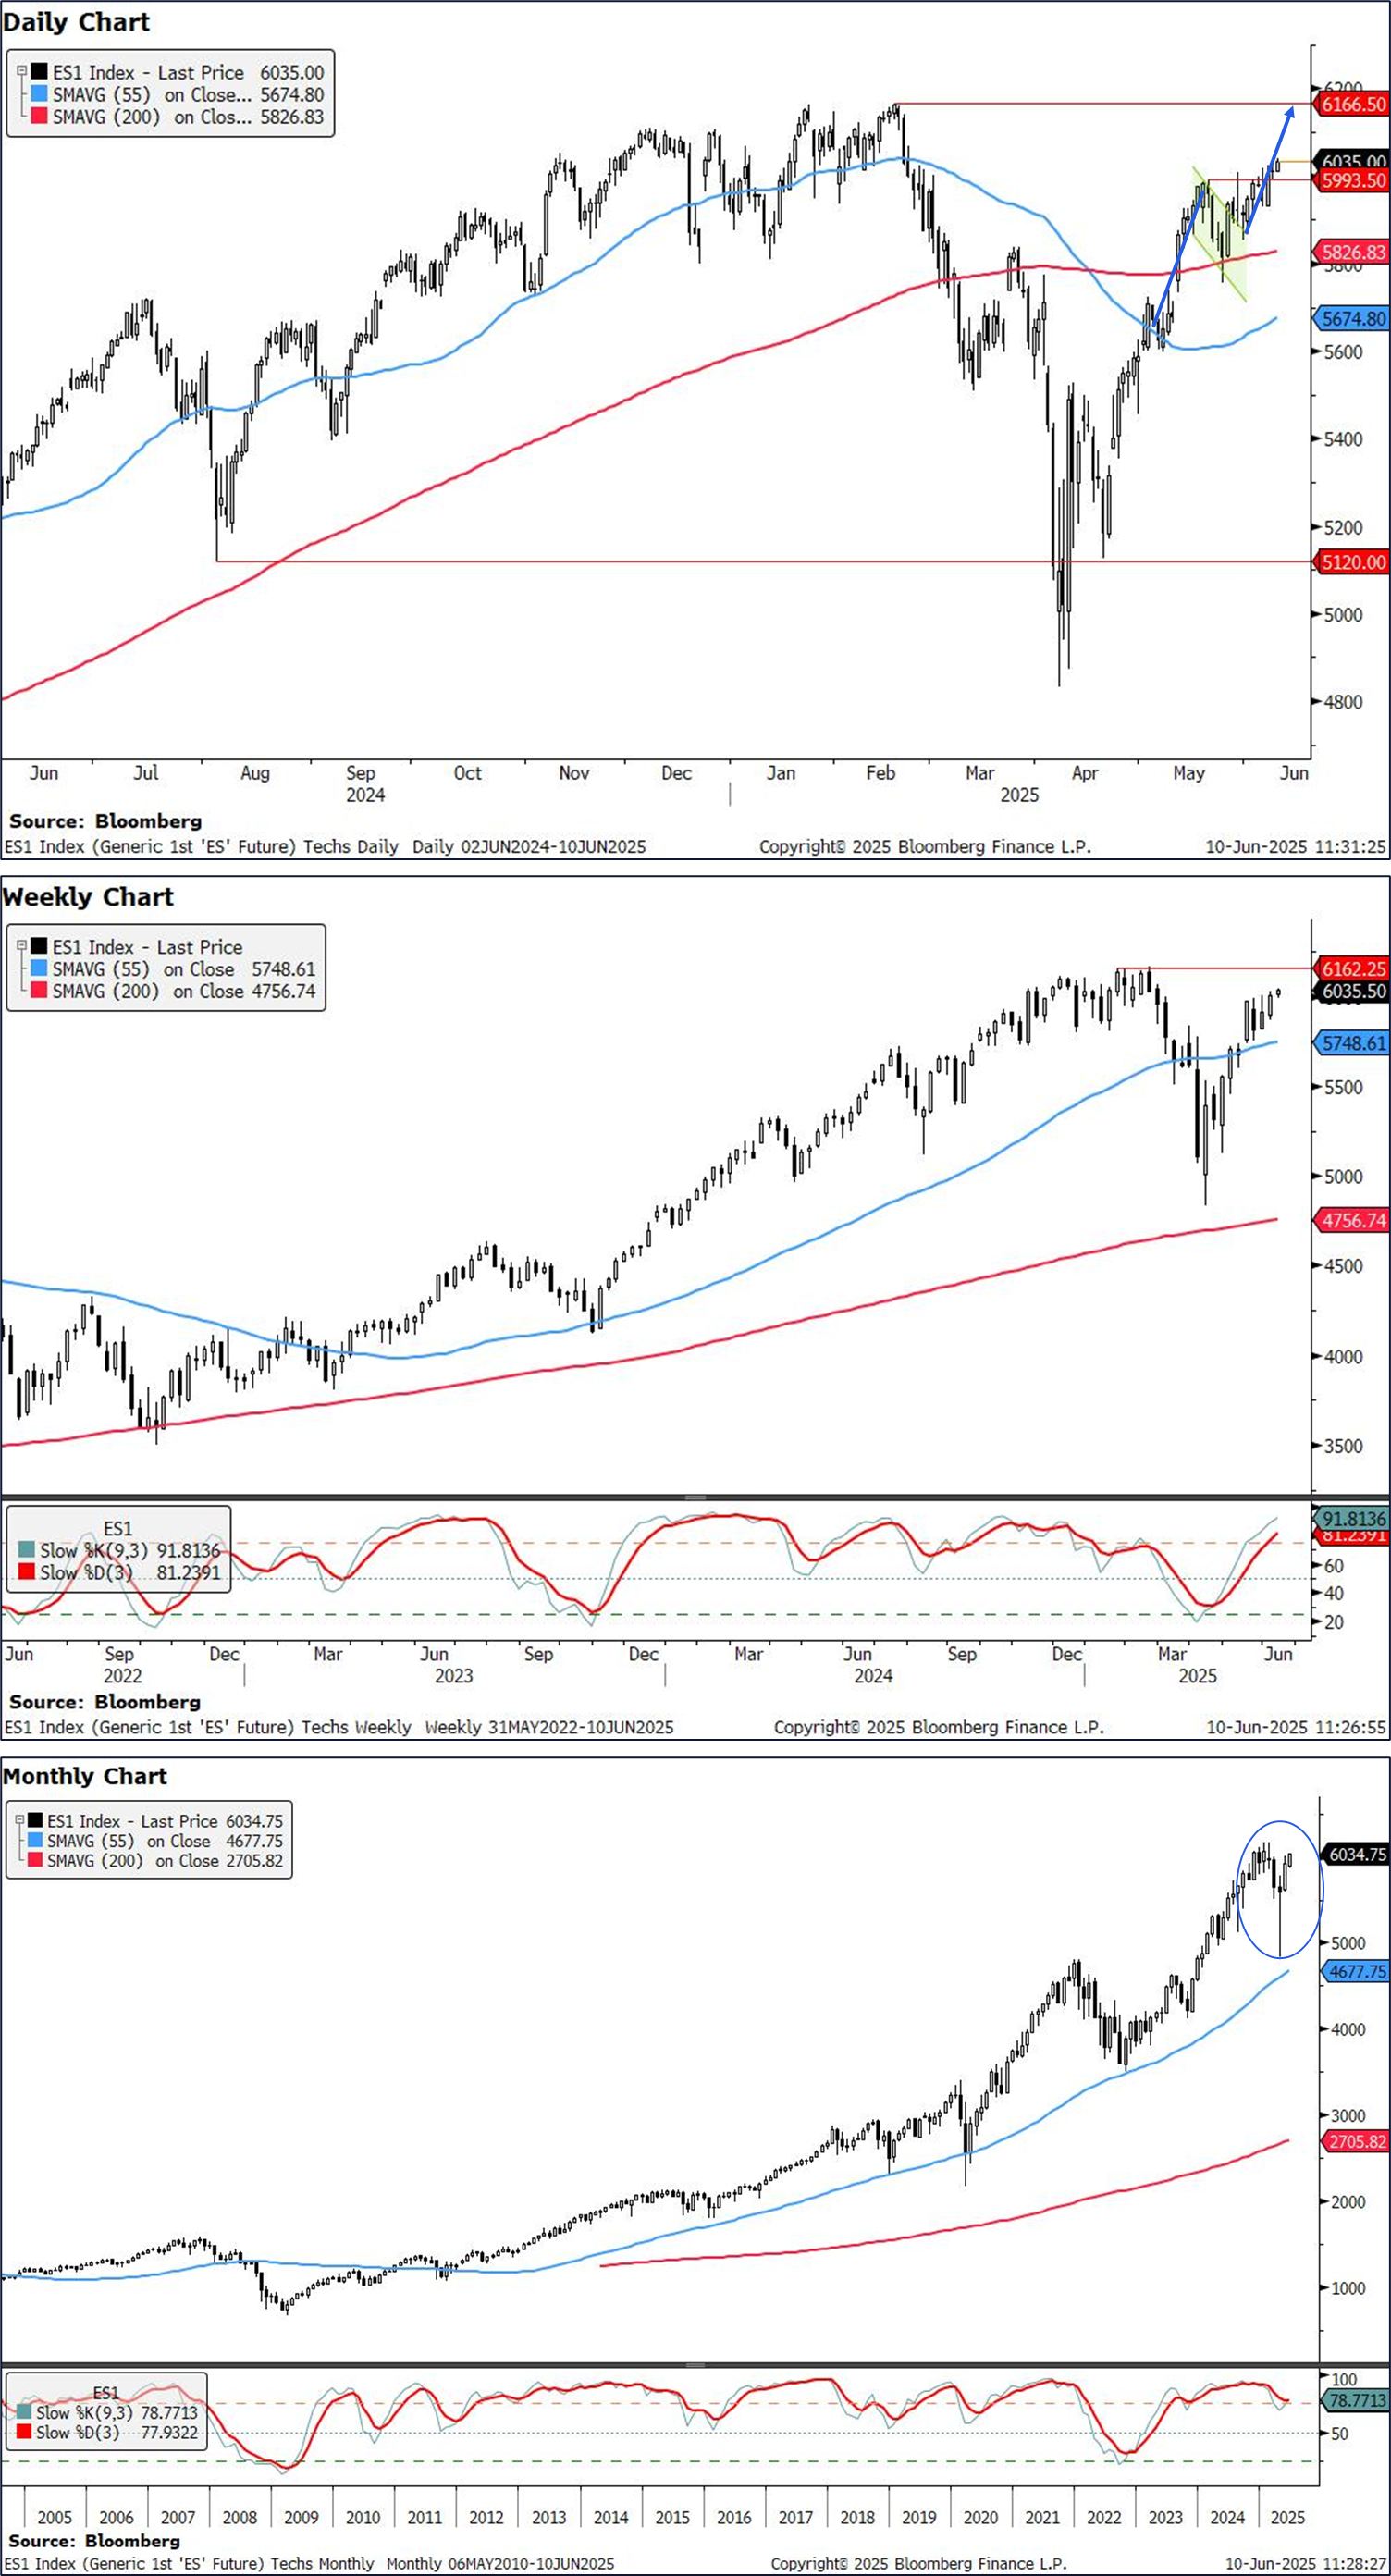
Tuesday, Jun 10, 2025, 0:40 CitiFX: US stocks look rosy
US stock futures have closed weekly above resistance levels. Techs formations, momentum as well as broader macro are positive. We think S&P e-minis and Nasdaq 100 futures can rally towards their respective ATH, and potentially beyond.
S&P e-minis (ES1):
ES1 has closed weekly above the 5994 level (May 20 high) that we had been watching. At this stage, the picture looks very bullish for ES1:
We have closed weekly above the resistance at 5994, providing the directional break we had earlier been looking for
This happens with a shorter term bullish flag formation at play, suggesting we could move towards the ATH at 6166.50.
Monthly morning star formation suggests medium term bullishness
Weekly slow stochastics is in overbought territory, but we are not close to a crossover yet, suggesting room for a move higher.
US hard data continues to be strong, defying weaker soft data, as evidenced by the NFP print (see our econonomists' review here)
CTAs continue to be 'max long' on S&P futures according to our CETS team's tracker.
Broader sentiment around trade deals also looks positive
Overall, the environment looks positive for US equities here. We think the rally can extend towards resistance at 6167 (All time highs). A break beyond that leaves subsequent resistance at around 6367 (ascending resistance). We see support only at 5827 (200d MA).
… read on for a look at TECH which is very much like longest of long duration assets (ie 30s) …
A morning catchup AND separately, a few charts from a large German operation …
…Who knew quiet Mondays were still a thing? Its only taken until June but maybe we can start easing back into weeks again. Famous last words I’d imagine. To be fair we were all waiting for the outcome of the US-China trade talks, which will now carry on into today. Indeed, after the volatility of the last two months, it was striking just how little any of the major assets shifted yesterday, with the S&P 500 (+0.09%) barely budging while 10yr Treasuries (-3.2bps) saw their narrowest daily trading range in over 6 weeks. The calm is unlikely to last though with more trade talk headlines likely to come through today, US CPI to look forward to tomorrow and that 30yr Treasury auction on Thursday…
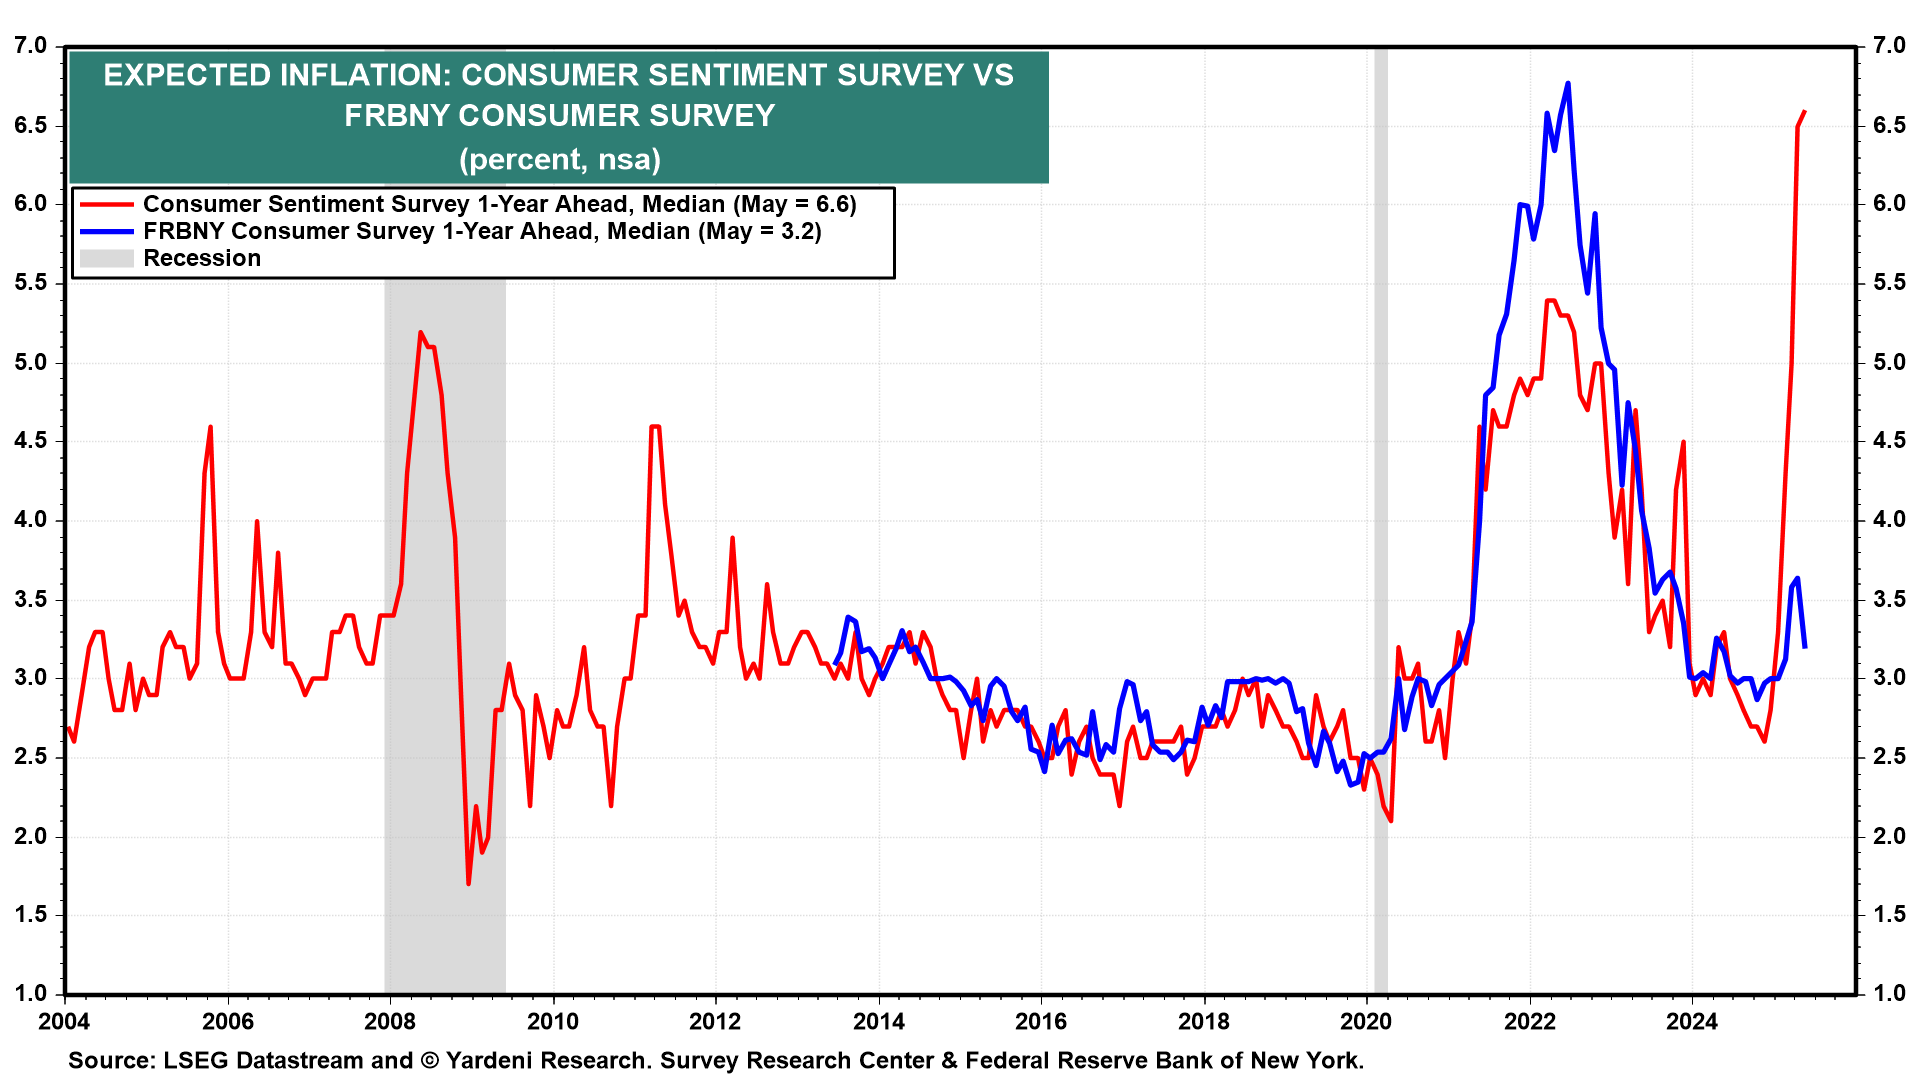
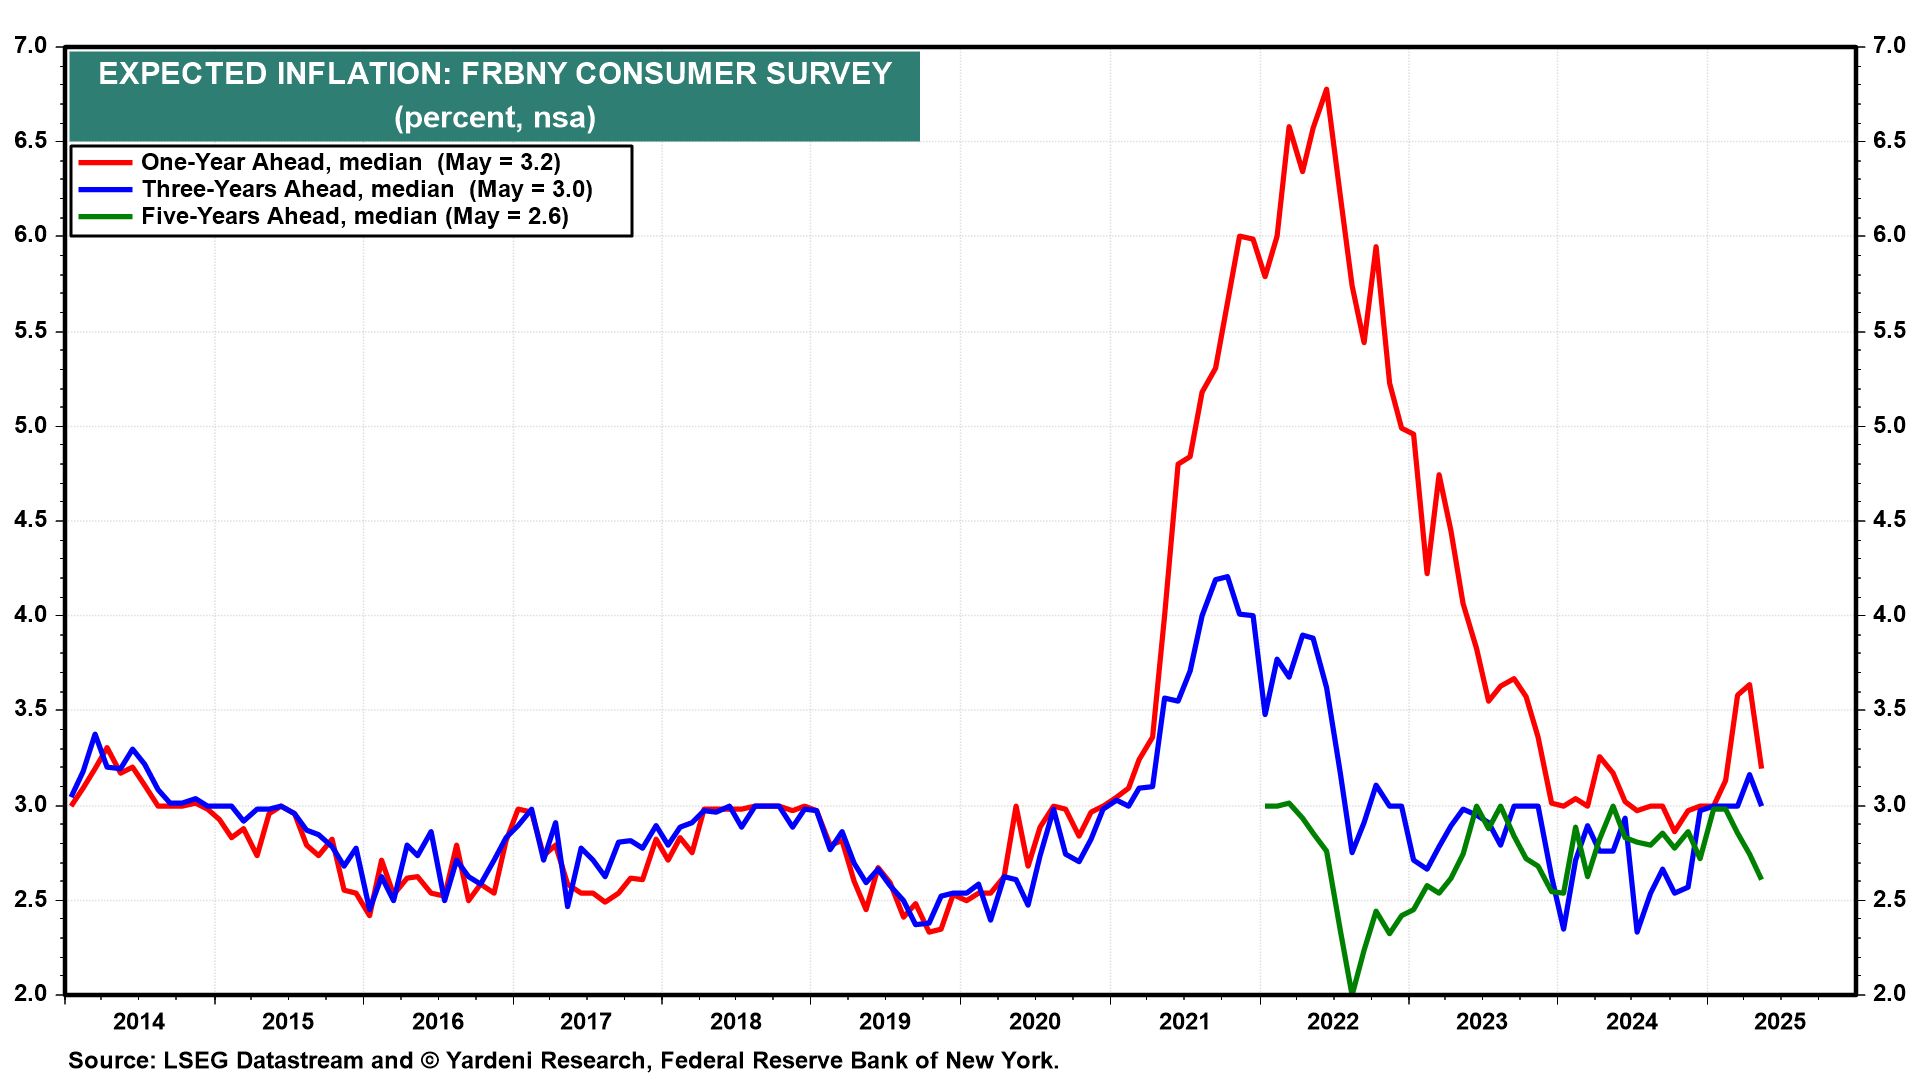
…In a generally light session, one supportive factor was some positive news on the inflation side, as the New York Fed’s Survey of Consumer Expectations showed a clear decline in inflation expectations. 1yr expectations came down four-tenths to 3.2%, whilst 5yr expectations were down to a 14-month low of 2.6%. So that was a far more benign assessment of inflation relative to other measures, as the University of Michigan’s reading had shown 1yr expectations surging up to 6.6% in May. So that was seen as encouraging ahead of the CPI print tomorrow, and that in turn supported a rally in front-end Treasuries, with the 2yr yield down -3.3bps on the day to 4.00% and the 10yr down -3.2bps to 4.47%, while 30yr yields were -2.8bps lower ahead of that monthly supply on Thursday…
09 June 2025 DB: Monthly charts: Easy come, easy go, little high, little low
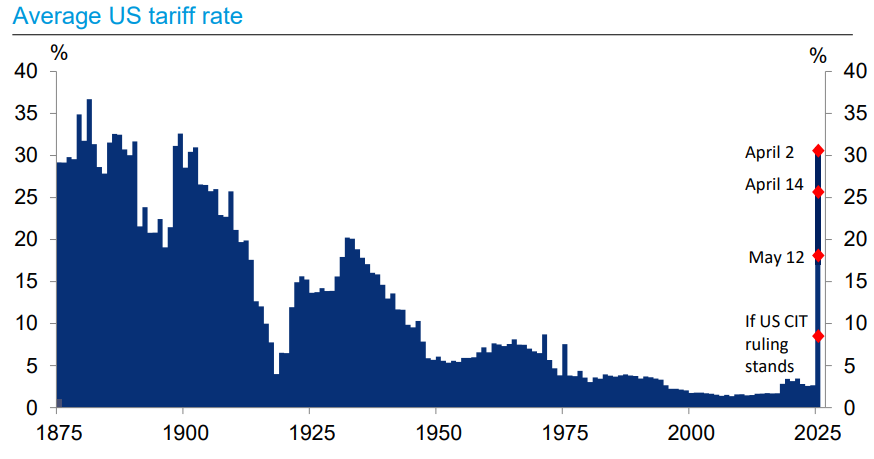
…Effective tariff rate near highest in a century, though recent court ruling could mitigate some of the rise
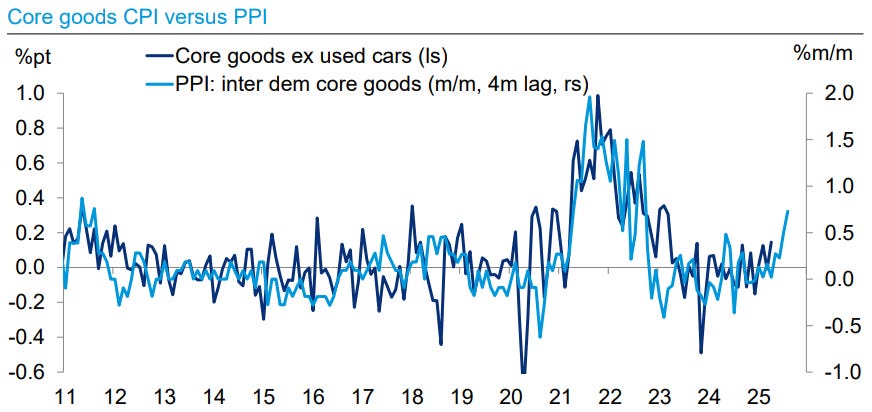
…Tariff effects have shown up in PPI and should soon be evident in CPI
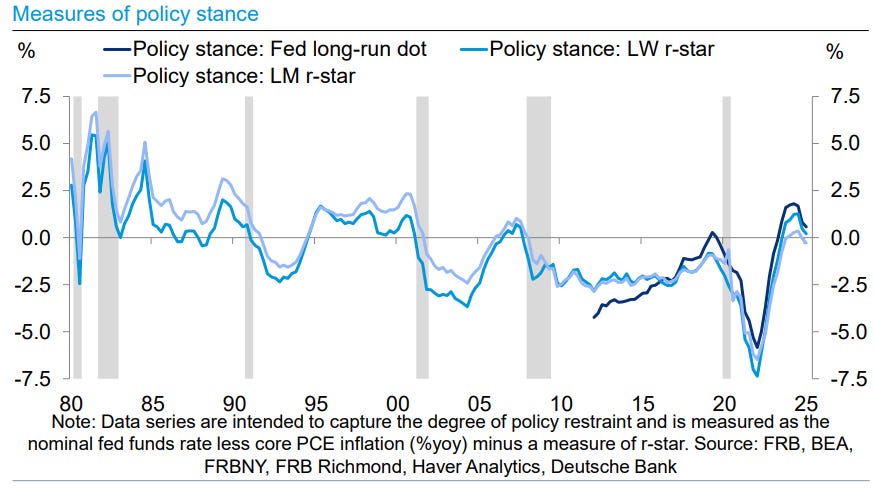
…How restrictive is policy? Depends on the measure of r-star
… How can we have lower inflation and higher tariffs at the same time?
Because, as we’ve been saying all along, the link between tariffs and inflation is overrated. Yes, the specific items that are tariffed might rise in price, but that means less money left over to buy other goods and services, which reduces those prices. Tariffs shuffle the deckchairs on the inflation ship, not how high or low the ship sits in the water. That’s up to the money supply.
None of this suggests the Fed won’t reverse course and fully let down its guard. In spite of all the progress, we are still above the Fed’s 2.0% inflation target. Inflation may look gone, but boosting M2 and cutting interest rates sharply could reignite the embers of inflation which are still buried under the ashes from the COVID monetary fire…
Modest UST rally; commodity currencies outperform amid trade optimism; JGBs bear-steepen; ECB's Kazimir says ECB is at or near the end of its easing cycle; Korea rates outperform on smaller budget estimates; CBO releases updated "x-date" estimate; DXY at 99.00 (-0.2%); US 10y at 4.474% (-3.2bp)
USTs modestly gain across the curve (5y: -4bp), reversing some of Friday's sharp sell-off; rally is further supported by a drop in the NY Fed Inflation Expectations across all three time horizons…
… and ahead of this weeks all important UST supply …
… Tomorrow kicks off this week’s full slate of US Treasury supply with the $58bn 3-year note auction. Auctions this week (3y, 10y, 30y) will be closely watched as a test of demand, especially in the long-end. But we continue to note that auction statistics have remained solid post-April Liberation Day, and last month’s 10y and 30y auctions saw in uptick in foreign and international participation amidst ongoing concerns that US assets were being shunned on the international stage (chart below). So, we expect that this week’s auctions will be more skewed by post-CPI / PPI setup and by last week’s curve flattening than by a shift in investor demand.
Calling all Global Wall INTERNS … this next writeup an annual tradition written and offered up by former Bear Stearns stratEgerist and targeted for Global Walls latest class of pre-schoolers …
June 4, 2025 Trahan Research: The 2025 Macro Guide For Interns Important Macro Concepts For Incoming Interns (And Everyone Else!)
Most people enter the industry thinking macro is about predicting upcoming moves in markets with precise economic forecasts. But they quickly learn it’s not so simple. Markets often move first — they’re leading indicators, not lagging. To truly understand macro, it helps to know how top-down research has evolved and gained in popularity since the 2000s, challenging nearly a century of bottom-up orthodoxy. That shift didn’t happen by accident — and the story behind it reveals why macro matters more than ever today …
… Chapter 6 – Monetary Policy Reigns Supreme In The World Of Macro The federal funds rate (FFR) is one proxy of monetary policy that can be used to create AEIs. Knowing that all interest rates have some degree of correlation across the yield curve, we can use these series almost interchangeably. Below is the change in the U.S. 10-Year yield, which is inverted and advanced by 24 months, against U.S. GDP growth. This transformation in the bond yield represents the AEI in this case, and we can see it takes approximately two years for the feedback loop to seep into CEIs like GDP.
Obviously, this often leads to a debate regarding the use of short vs. long rates as proxies of monetary policy settings. There are a couple things to consider here. First, we don’t use any of the AEI series in isolation — we use all of them in tandem. Second, bond yields are not the only proxy of policy, they just tend to have the best correlations. Third, the Fed’s control of short-term rates via policy can have a massive influence on long bond yields, particularly during tightening cycles.
Chapter 7 – Yield Curve: Controversial Tool That Is Undeniably Effective The Yield Curve, or the spread between short and long rates, is sometimes a controversial indicator in the eyes of investors. Let’s be honest, an inversion in the curve has been an excellent gauge of recession risk across history, as shown below. When we say it can be controversial, it’s because investors misunderstand it to a certain extent, which makes it easier to dismiss. That said, it’s hard to ignore something that has worked so well for so long. Ignore it at your own risk!
The slope of the yield curve is a reliable indicator of recession risk because of its tight coincident relationship with two primary drivers of bond yields: inflation (positive) and unemployment (negative). These two variables are also decent proxies of the Fed’s mandate. As the curve begins inverting, inflation is usually at or near its cyclical peak and unemployment at its cyclical trough. These are classic signals of a business cycle at its peak, with a Fed looking to begin tightening and recessionary risks ahead.
SHORT VERSION for those interns who are visual learners …
Narratives. They are what make Global Wall go ‘round …
US President Trump has declared trade talks with China “not easy”. There may be a difference between the administration’s perception of its bargaining position and reality. With the 90-day deadline to do deals approaching, no deals have yet been made—and the UK trade agreement has not come into effect. There are suggestions that Trump will retreat from export restrictions on chips in exchange for some so-called “rare” earths…
…Trump is to send 700 Marines to Los Angeles, in defiance of local authorities. Protests have been limited in scope, but international media coverage will focus on the sensational, opening a gap between international and domestic investors’ perceptions of US stability.
… finally, a few words on ‘flation from Dr. Bond Vigilante …
Jun 9, 2025 Yardeni: Inflationary Expectations Decline In US As China Deflates
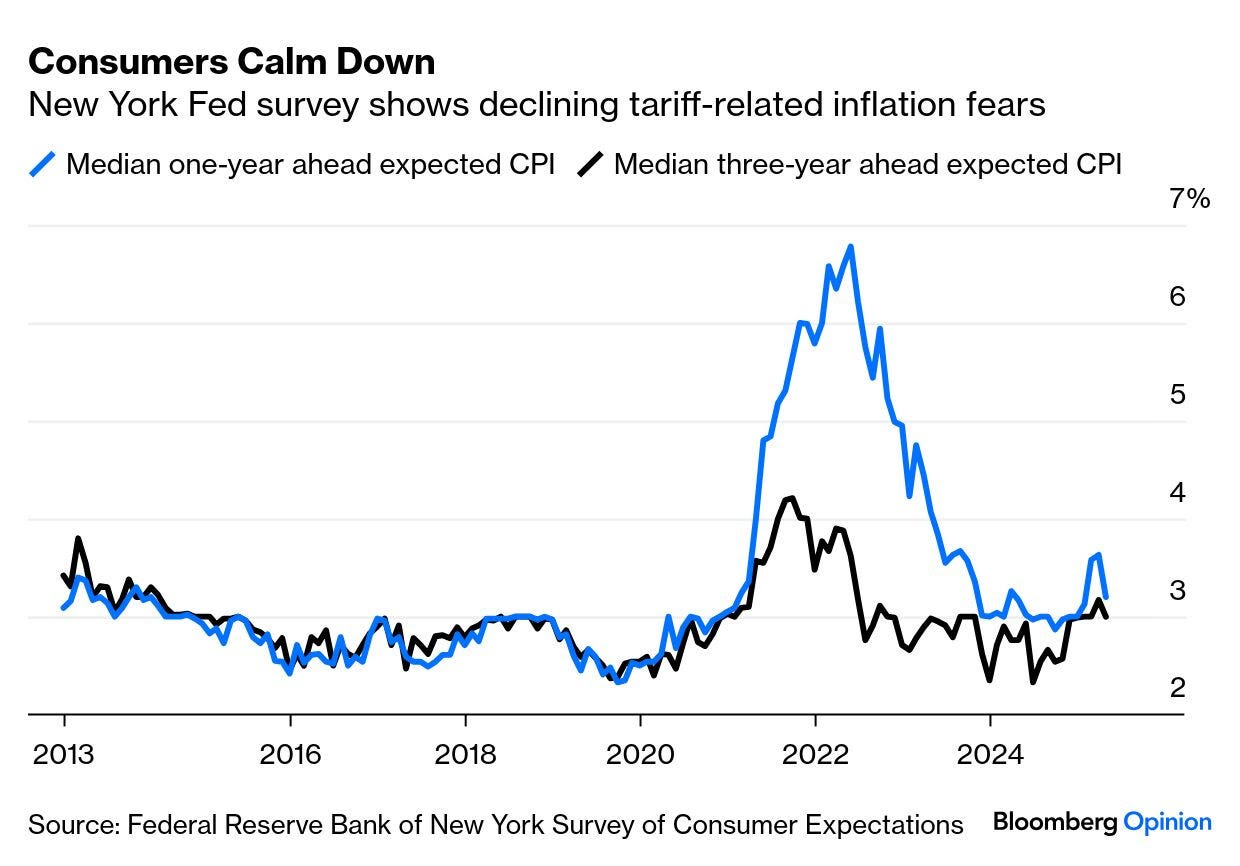
In the hilarious comedy movie "What About Bob," Bill Murray, who plays Bob, tells his shrink "that there are two types of people in this world. Those who like Neil Diamond and those who don't." There also seem to be two types of respondents to surveys of inflationary expectations: like those included in the Consumer Sentiment Index (CSI) survey and those included in the New York Fed's Survey of Consumer Expectations. In recent years, they've generally agreed on the outlook for inflation over the year ahead (chart). But since the start of this year, they've diverged significantly. In May the CSI folks anticipated a one-year inflation rate of 6.6%, while the NY Fed's survey respondents predicted a 3.2% increase, which was a decline from April's 3.6%. We fit with the latter group.
The NY Fed's survey also found that the three-years ahead and five-years ahead expected inflation rates fell to 3.0% and 2.6% in May (chart). That makes sense since consumers must have expected less inflation resulting from President Donald Trump's tariffs after he postponed most of them on April 2 and lowered the ones on China on May 12.
Trump's trade war is exacerbating China's deflation. The country's CPI fell 0.1% y/y during May (chart). The PPI dropped by 3.3% that month. Deflating prices in China may offset the impacts of Trump's tariffs on US importers and consumers a bit. More importantly, deflation is putting pressure on the Chinese government to negotiate a trade deal with Trump that benefits both countries. Such discussions resumed today in London with trade representatives from China and the US. Stock prices meandered today in the US as investors awaited news on whether the two sides are making progress in resolving their various trade issues…
… And from the Global Wall Street inbox TO the intertubes, a few curated links …
BANKS — who finance the US (and in some cases, the GLOBAL) economy …
June 10, 2025 Apollo: Outlook for US Banks
Our outlook for the US banking sector is available here.
Banking sector balance sheets are generally in good shape, and credit growth is positive, driven by lending by large banks.
Delinquency rates are peaking on credit cards and auto loans, but restarting student loan payments is a headwind to credit quality and credit growth.
The trade war and Moody’s downgrade have not yet had any impact on the banking sector or credit growth.
Permanently higher interest rates are putting downward pressure on CRE prices for office, multifamily apartments, and healthcare facilities. This remains a problem for banking sector balance sheets.
The ‘64k dollar question’ …
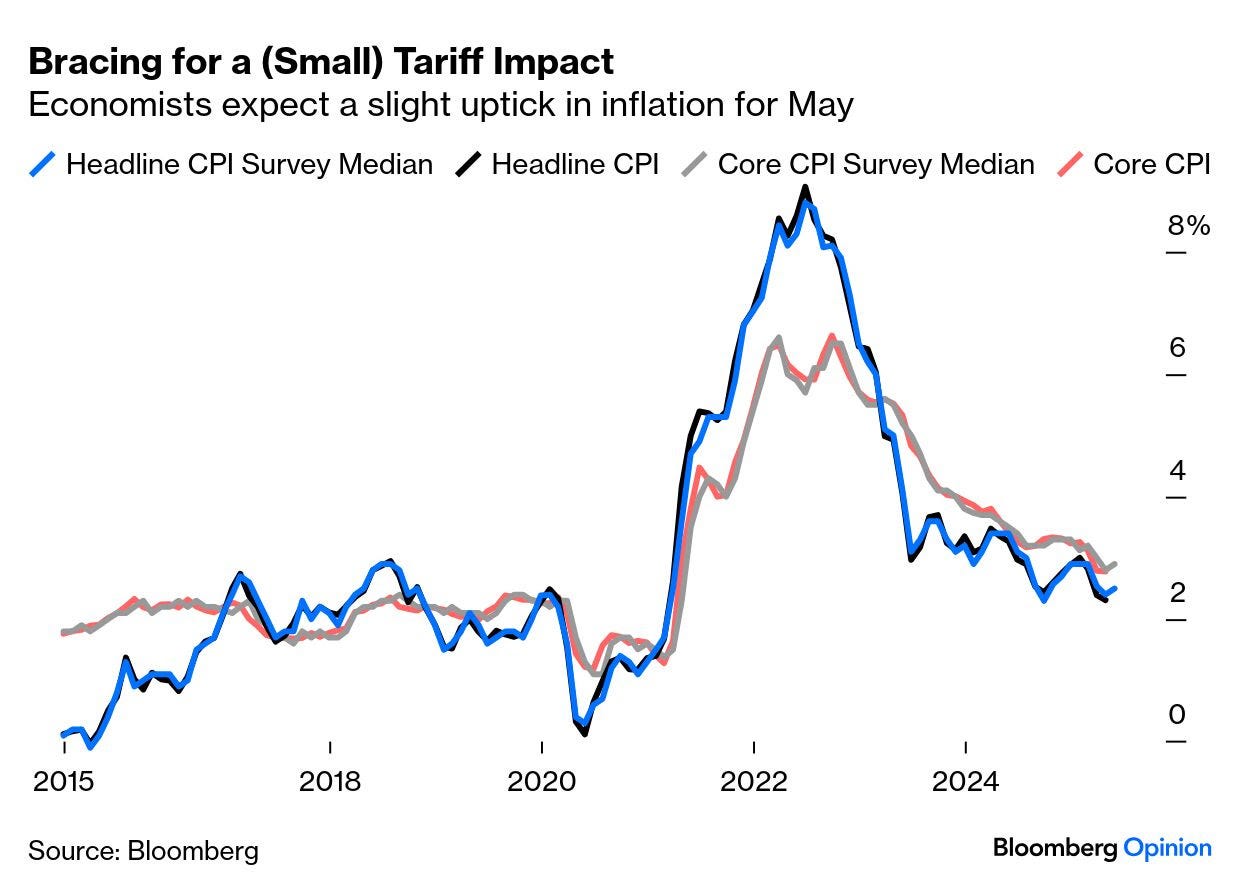
June 10, 2025 at 4:00 AM UTC Bloomberg: This Burning Tariff Question Has No Answer... Yet There’s a risk of upward pressure on inflation expectations in this new regime.
… There remains a close-to-universal expectation that tariffs will appear to some extent in May’s CPI. This is headline and core (excluding food and fuel) inflation over the last decade, along with the median expectations of Bloomberg’s surveyof economists. Both are expected to tick up:
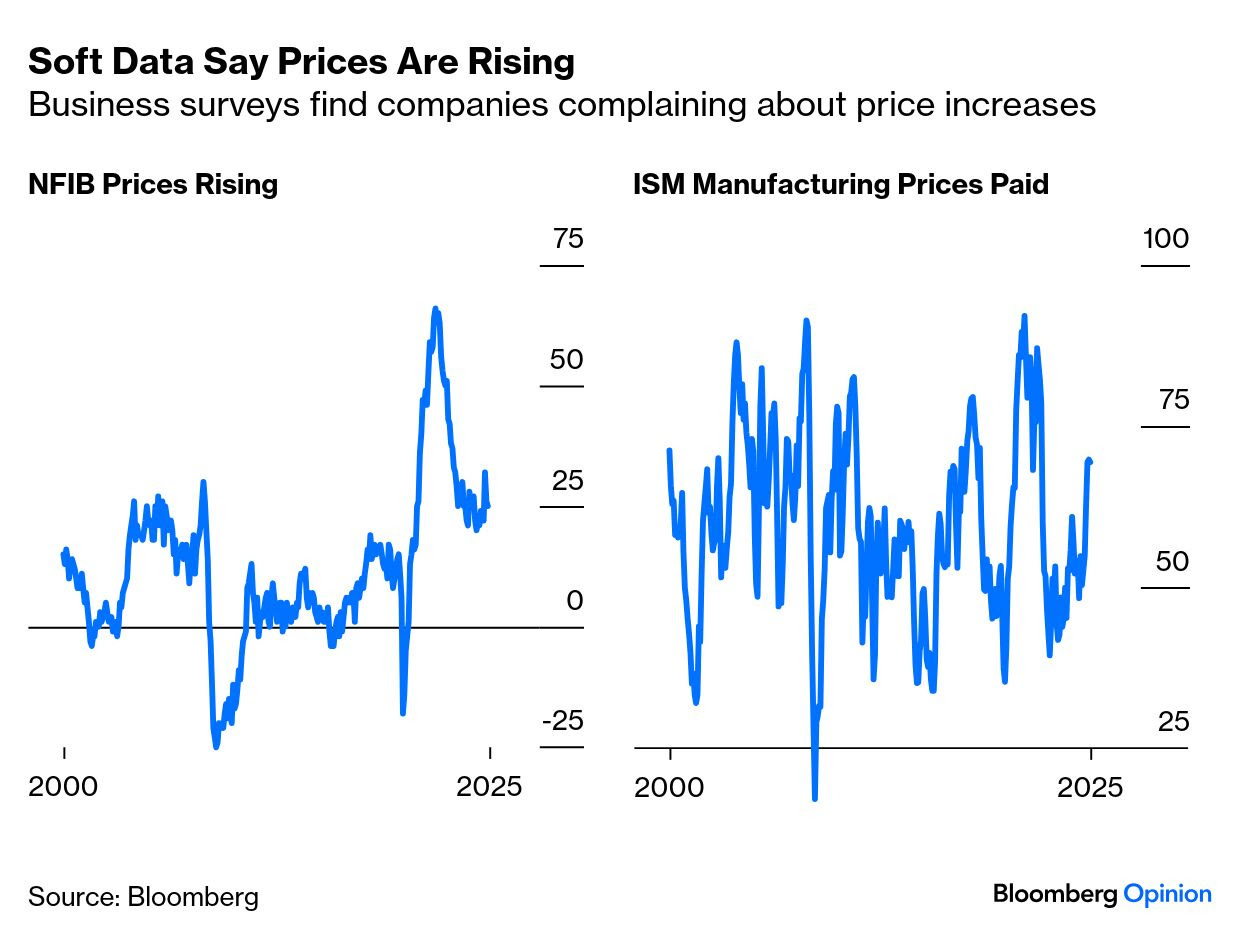
Michael Gapen, chief economist at Morgan Stanley, points out that companies like Ford Motor Co. and the French luxury-goods maker Hermes International SCA publicly announced that they were raising prices due to tariffs during May. “Soft” indicators also suggest rising pricing pressure. Both the Institute of Supply Management, covering larger companies, and the National Federation of Independent Business’ survey of smaller firms show growing complaints about prices:
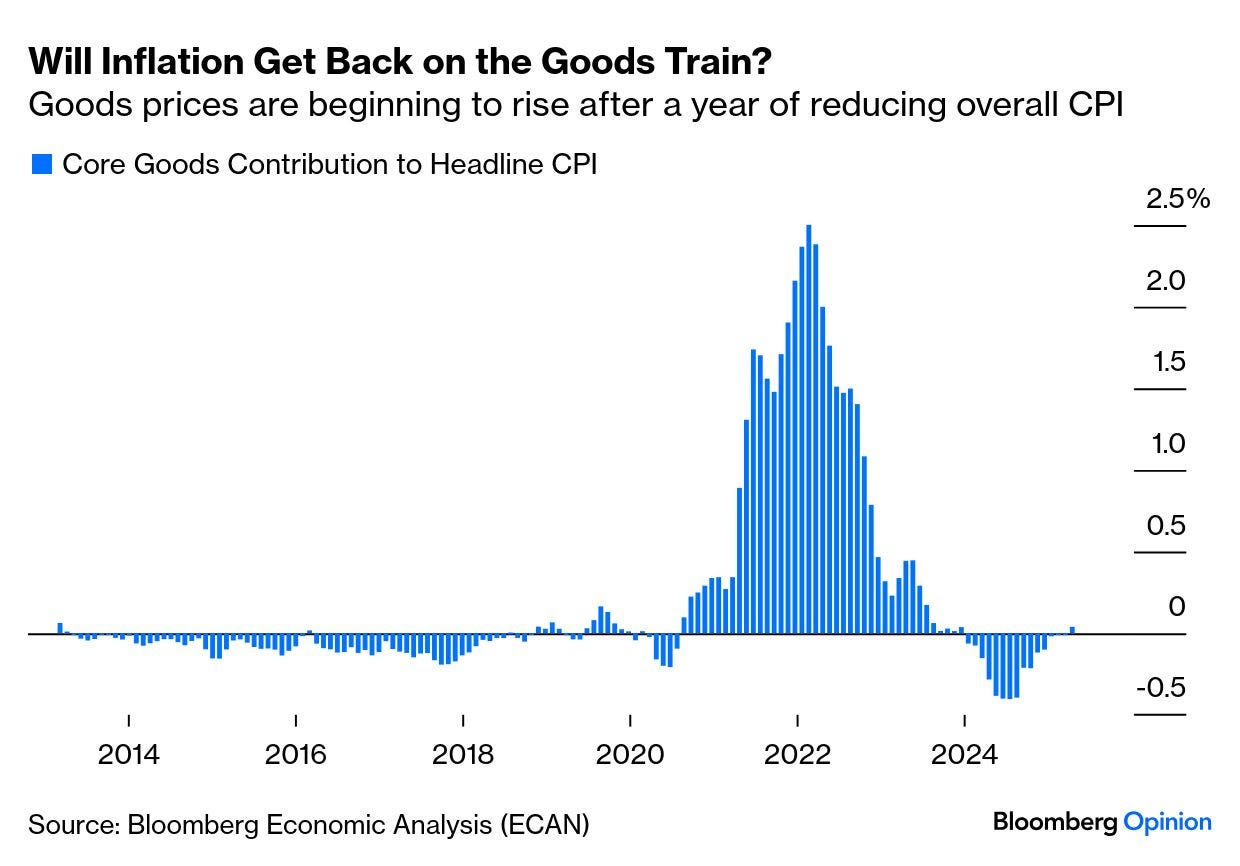
The tariffs are on goods, where inflation is virtually over, rather than on services, which currently account for most of overall inflation. Before the post-pandemic shock, goods inflation was negative — an effect of the offshoring the tariffs are combatting:
Unless companies swallow all the tariffs through reduced profits — in which case their shareholders might be rather peeved — goods prices will almost certainly adjust upward over the next few months. What’s controversial is whether this will contaminate broader inflation expectations. Many predict a path similar to that sketched out by Pooja Sriramof Barclays PLC, with goods price rises peaking later this year and then declining:
The truces of the last two months seem to have diminished consumers’ anxiety, as shown in the regular New York Fed survey:
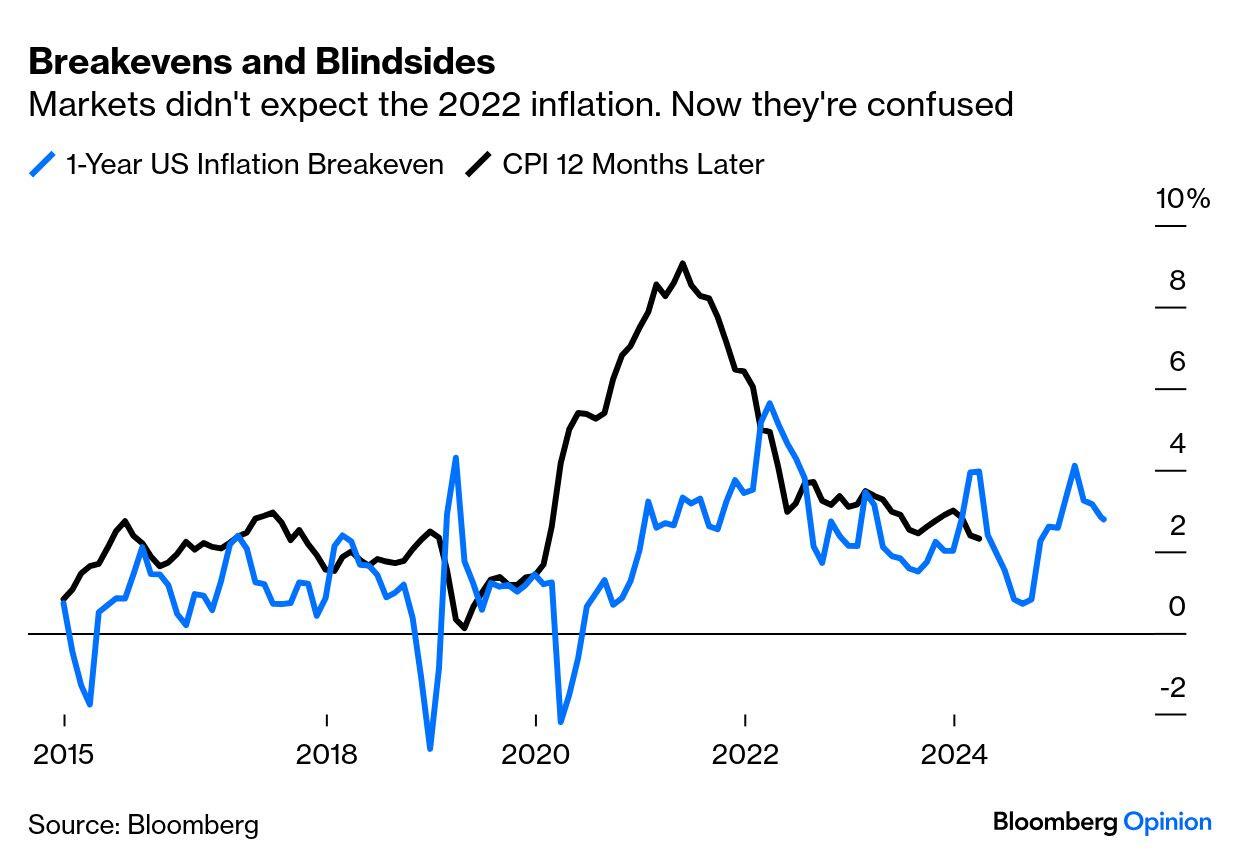
The bond market’s expectations, measured by the breakeven rates between fixed income and inflation-linked securities, indicate dealers have been on a rougher ride than consumers. One-year breakevens have varied between 1% and 4% so far this year. With the exception of the 2022 surge, which blindsided them, bond forecasts aren’t bad:
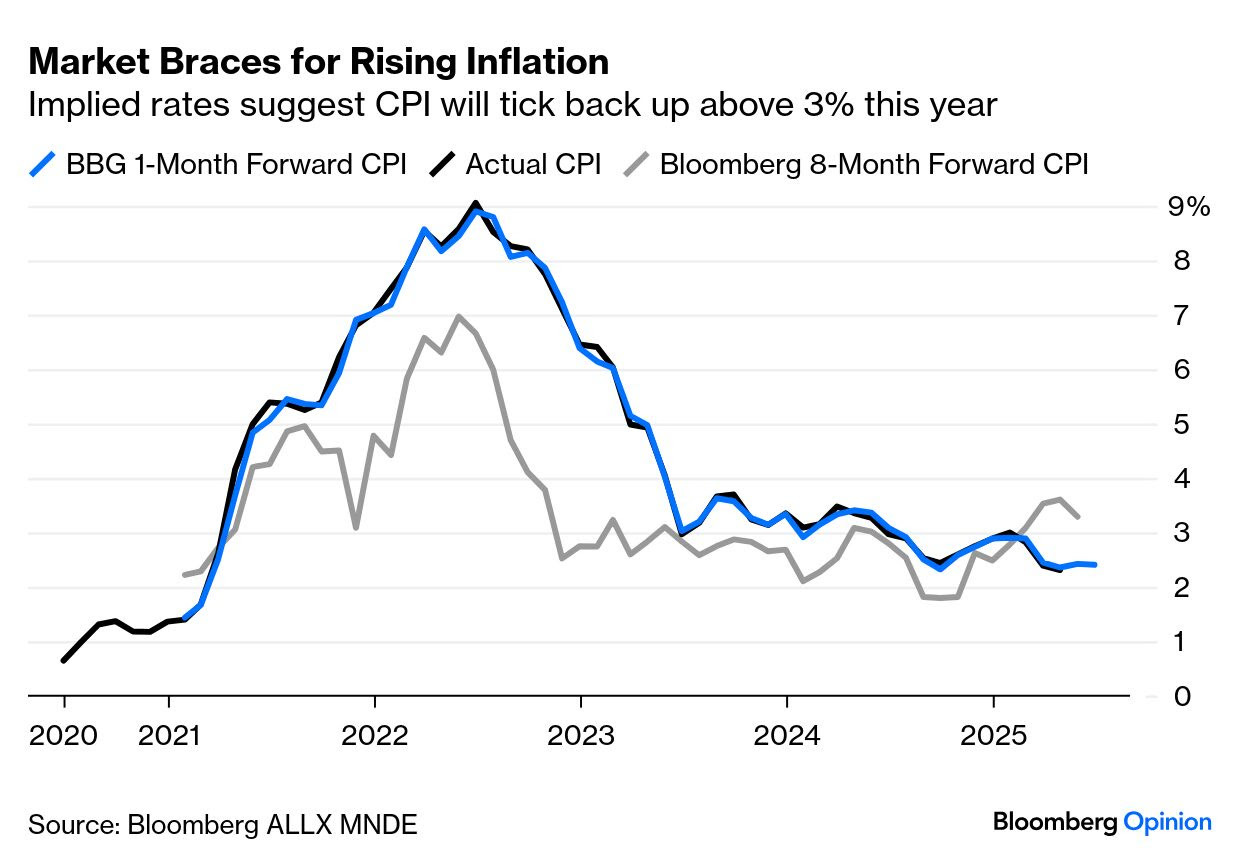
Nearer term, the new terminal function ALLX MNDE <GO> shows that the swaps market tends to be seriously accurate one month ahead of time and expects a slight rise. It also has inflation ending the year above 3% — but that’s dropped since the tariff truces:
Jonas Goltermann of Capital Economics argues that inflation swaps indicate “pretty strongly that some US tariffs are expected to remain in place.” Two-year swaps point to inflation averaging almost 3% over that period, despite falling oil prices:
With other potential sources of inflation, in particular wage growth, looking relatively benign too, expected tariff-driven inflation is the obvious culprit. According to our estimates, the inflation swap curve is roughly consistent with the 10% universal tariff and a higher effective rate, perhaps 40% or so, on imports from China.
If that projection is right, then May was the first month of a new regime to which we’ll have to become accustomed. If inflation doesn’t rise as expected because of it, that will be very positive. And if tariff rates rise again when the truce ends next month, inflation expectations are also going to rebound higher. Hold on to your hats.