Good morning … Equity futures are steadily BID overnight and with that, rates are offered.
It’s too early to consider the move in bonds a concession for this weeks supply (and certainly not when you think of how we’re cheaper / steeper this morning), SO here’s an early look in on 10yy ahead of this weeks onslaught of front-end supply (2s, 5s and 7s beginning tomorrow) …
… they say the trend is yer friend, until it bends … at this point, I would note momentum appears to be (remaining)overSOLD and in search of a catalyst. Cover. HOPE (not a strategy) that 5% (front end) will be some sort of PEAK — see Bloomberg story below for somewhat more on that.
For now … here is a snapshot OF USTs as of 706a:
… HEREis what this shop says be behind the price action overnight…
… WHILE YOU SLEPT Treasuries are modestly lower with the curve(s) steeper heading into this week's record Treasury supply and the PCE data on Friday. DXY is little changed while front WTI futures are slightly lower (-0.1%) and off earlier lows today. Asian stocks were mostly higher, EU and UK share markets are mixed while ES futures are showing +0.5% here at 6:50am. Our overnight US rates flows saw unwinds of weekend hedges that took 2's to the 5.0% level and 30yrs to 4.75%. Intermediates led the move lower on solid volume. During London's AM hours the desk saw a small retracement to lower yields on the back of relatively light buying. Overnight Treasury volume was still only about 75% of average despite the high turnover in intermediates seen during Asian hours...
… and for some MORE of the news you might be able to use…
NEWSQUAWK: US Market Open: Equities firmer and Antipodeans benefit from the positive risk appetite, Crude softer but off worst levels; ECB's Lagarde due … Bonds are pressured and contained within a tight range … USTs have been contained within a 107.25-17+ range, given the lack of geopolitical escalations over the weekend. From a yield perspective, 4.696% remains the recent peak for the US 10-year with a current level of circa 4.65%.
Finviz (for everything else I might have overlooked …)
Moving from some of the news to some of THE VIEWS you might be able to use… here’s SOME of what Global Wall St is sayin’ (in addition TO what was noted HERE over this past weekend)…
BNP: A toolkit to hedge your equity ‘short-squeeze’ risk
We present a new quantitative investment strategy designed to help equity portfolio managers better protect against violent rallies in single-name shorts.
While short-selling can generate valuable alpha, it is a risky business and has suffered in the past from sharp and severe drawdowns. In crowded or illiquid conditions, any catalyst can trigger a cascade of short covering orders with adverse feedback loops wreaking havoc on long/short portfolios.
A call delta-replication strategy, which uses a basket of highly-shorted single-name equities as underlying can offer a compelling hedging solution. These strategies can be customised to minimise basis risk and optimise cost/convexity to investors’ needs.
We also propose a new set of market indicators to help investors better assess crowding risk among highly-shorted equities. We use information from correlation, volatility and momentum exposure to quantify risk. After pointing towards greater risk of a short squeeze in late 2023, our indicators have since normalised, suggesting lower risk of a short squeeze in the weeks ahead.
… Proposing a new short-squeeze risk indicator We train a random forest regression model on the three indicators discussed above to see if the model can help identify short-squeeze episodes over the next 20 days. We use randomised search cross-validation to fine-tune hyper parameters and to reduce overfitting risk. The model achieves an in-sample R-squared of 0.29 and outof-sample R-squared of 0.26.
Figure 9 shows the resulting model output, pointing to the expected performance of highly-shorted equities over the next 20 days. After identifying a greater risk of a short squeeze in late 2023-early 2024, the model suggests lower risk at the moment…
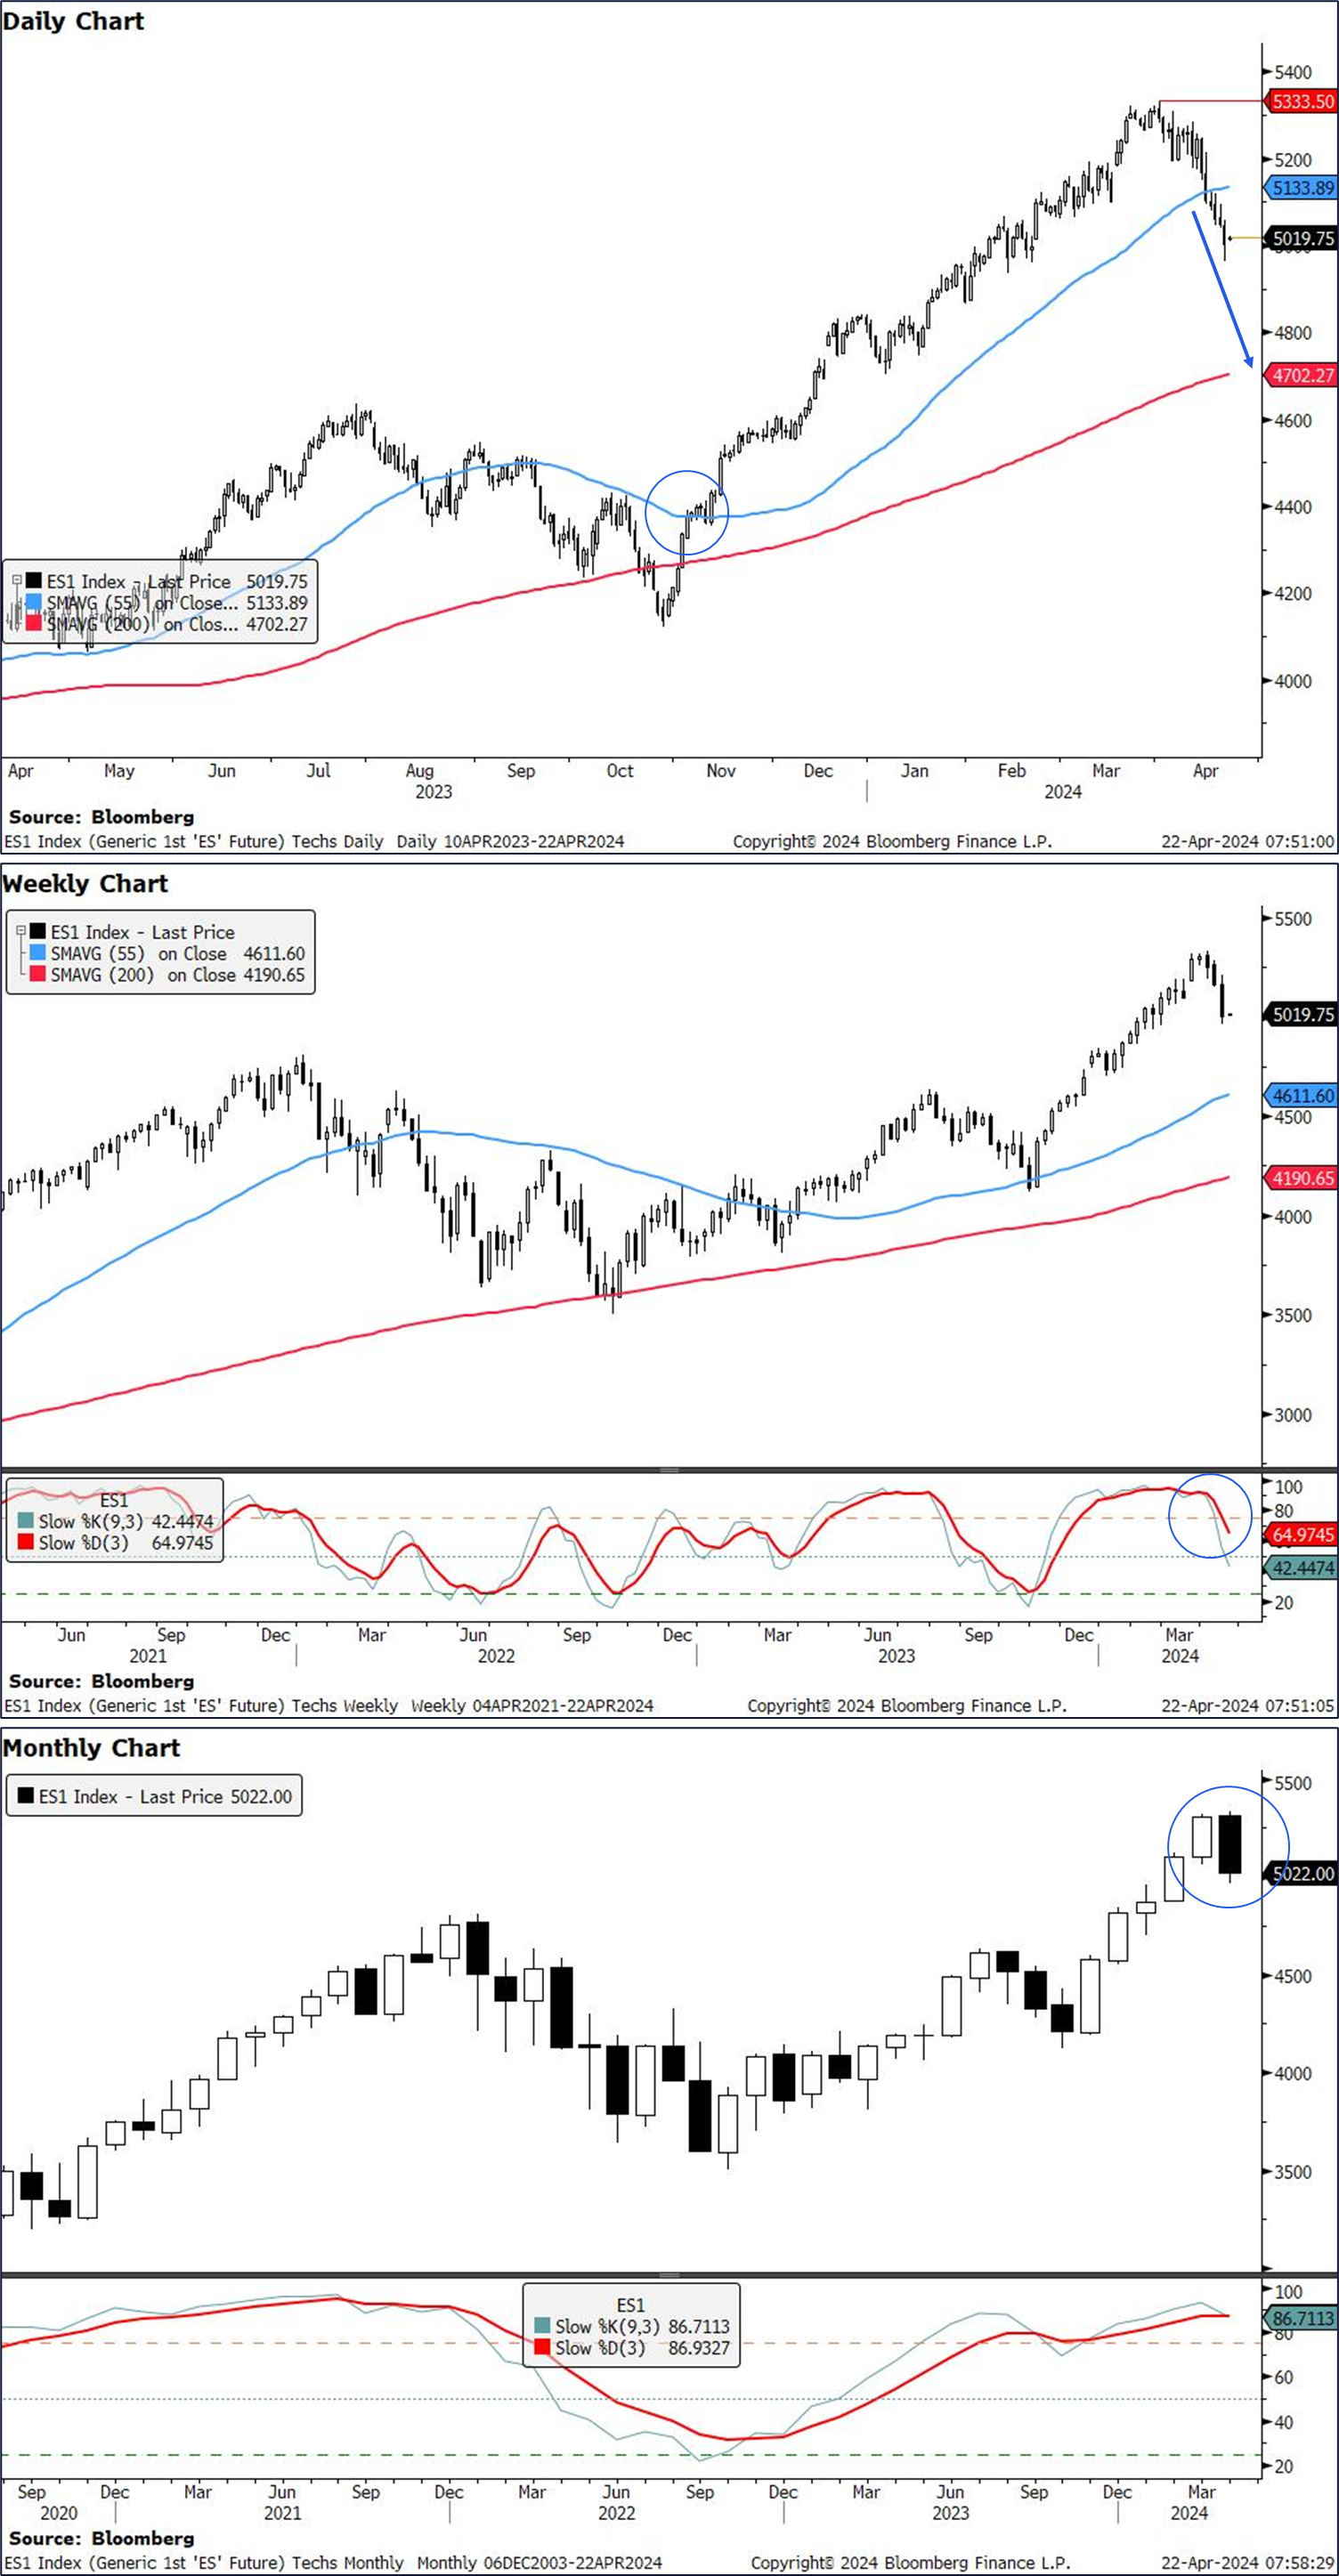
Last week, we warned that stocks were trading close to major support levels, which we have now closed below on a weekly basis. We turn bearish as a result, with techs formations suggesting another >5% loss in S&P e-minis and Nasdaq 100 futures - though we do flag that upcoming Magnificent 7 earnings pose a key risk to this view.
S&P e-minis Price has closed weekly below the 55d MA, which has initiated a 55-200d MA setup. On top of that, weekly slow stochastics has crossed lower from overbought territory.
The 55-200d MA setup suggests we could see another ~6% loss towards the 200d MA (currently at 4702). We remind we saw a seimilar setup in Aug 2023.
Weekly crossover from overbought territory in slow stochastics suggests momentum has turned around.
We are on-track to posting a bearish outside month at the top of the trend, which indicates further imminent losses.
The S&P 500 has now experienced a run of 6 consecutive daily declines. Several factors have caused this, and two of the most important are growing geopolitical tensions, along with the prospect of rates staying higher for longer.
But 6 consecutive declines are a fairly rare occurrence. In fact, it’s only the 9th time this has happened in the last decade, so on average it takes place less than once a year.
Given how rare this is, we take a look at what happened when the index has previously experienced a run of 6 consecutive declines.
… After recent runs of 6 declines, the index has generally seen a positive performance in the period afterwards. Of course, there are some exceptions, but whether looked at over a 1-month, 3-month or 6-month horizon, the index is mostly posting a solid advance over the subsequent period. Indeed, the subsequent month (next 30 calendar days) sees a median performance of +3.5%.
Looking in more detail, there are 17 previous occasions since 2000 when the S&P 500 has been on a run of 6 consecutive declines. This current occurrence is the 18th time.
…Conclusion Whenever the S&P 500 goes on a run of 6 consecutive declines, it's often due to some sort of adverse circumstance. But, depending on the context, that doesn't necessarily mean that further declines are ahead. In fact, so far in the 21st century, the median performance after 6 consecutive declines has been further gains over the next month, 3 months and 6 months.
MS Weekly Warm-up: Focus on Fiscal for Next Move in Rates and Multiples
As higher rates pressure equity valuations, heavy fiscal appears to be making the inflation fight more challenging. Energy and quality remain high conviction longs. Having spent the last several weeks on the road, we offer responses to key questions and feedback from clients.
… We believe equity markets have been trading poorly in April primarily due to the repricing of Fed cuts and the subsequent rise in back-end rates. Recent multiple compression has coincided with a decisive break above the 4.35-4.40% 10-year yield range we have been focused on since last month ( Exhibit 1 ). As discussed in recent notes, with most of the rally in stocks since October due to higher valuations as a function of lower rates, it seems reasonable that multiples should now fall if yields stay elevated/rise further. Our analysis from last week (updated today for the latest moves in rates/multiples and additional rate paths) shows that if yields stay at current levels over the next 3 months, multiples could face additional, modest (~5%) downside within that period all else equal.
The drivers of inflation led our US team to delay the first Fed cut forecast to July and downshift cuts to 75bps in 2024. We consider what this means globally.
Last week we shifted our rate call for the Fed from June to July and reduced the total amount of rate cuts we see from the Fed through the end of 2025. The revised Fed path sees 3 cuts forecast for 2024 and 4 for 2025. One of the questions we have been asked is why only July? Why not September or even November? The truth is that it was a tough decision, but when we reviewed the data – July continued to make sense.
Barring a discernible inflation acceleration trend in the detailed inflation data, it is hard to move the call too forcefully – like the Fed, we remain data dependent. The three recent CPI upside surprises had different sources of surprise and shifting sub-components in each month, PPI downside surprise offset much of the CPI upside surprise, and housing inflation, the largest sub-component, continued to follow a declining trend.
Ultimately, when you take a step back, one must consider that core PCE is currently tracking 2.8% versus a Fed expectation of 2.6% in Q4; the Fed has 3 cuts modeled if inflation falls to 2.6%. 20 bps of disinflation in 9 months is a smaller gap than market pricing might suggest, particularly when one considers that measured housing inflation is still tracking far above market rents…
Structural change is a challenge. Data becomes less reliable, and traditional economic relationships break. Last week, the UK reported London house prices underperformed the rest of the country, reflecting shifts triggered in part by flexible working. That trend changes real estate demand, consumption patterns, travel patterns, productivity, and leisure time—and tends to mean that economic activity is under-reported. This is why details in data are increasingly important…
… Safe-haven bids seem to be fading—oil prices fell last week. The US House passed funding for Ukraine, but this is less of a investor focus (the market impact is likely to be via European, and to a lesser extent US fiscal deficits). In funding Ukraine, the House proposes to defund GenZ, by threatening the revenue stream of US TikTok content creators (another example of under-reported economic activity).
Wells Fargo: April Flashlight for the FOMC Blackout Period
Summary
We share the market's overwhelming expectation that the Federal Open Market Committee (FOMC) will leave the fed funds target rate unchanged at 5.25%-5.50% at the conclusion of its April 30-May 1 meeting.
Stubborn inflation and resilient economic activity through the first few months of the year have left the FOMC little reason to ease policy in the near term. A chorus of Fed officials, which tellingly include a number of “doves,” has indicated that there is no hurry to cut rates at this time.
An update to the Committee's economic projections will not be released at the end of next week's meeting, but the post-meeting statement and press conference will likely offer some clues on how the FOMC expects the policy path to evolve over the coming meetings.
Since the FOMC's March 20 meeting, we (along with markets) have pushed back our expectations for when the FOMC will start to ease policy. We currently expect the FOMC to first cut the fed funds target rate by 25 bps at its September 18 meeting, followed by another 25 bps point cut at its December 18 meeting.
We anticipate the FOMC to announce a change to its ongoing balance sheet runoff program at its upcoming meeting even as it leaves the fed funds rate unchanged. We expect the Committee to announce that, beginning in June, runoff of Treasury securities will be capped at $30 billion/month compared to the current runoff cap of $60 billion/month. The $35 billion monthly runoff cap for MBS, however, is likely to remain in place. The pace of MBS runoff, at $15-$20 billion per month, is already running well below the current cap.
If we are off in our timing and the FOMC does not announce a slower pace of runoff on May 1, we would expect an announcement at the subsequent meeting on June 12. We anticipate this slower pace of QT running until year-end 2024. At its trough, we look for the central bank's balance sheet to be roughly $6.9 trillion.
We do not believe slowing the pace of QT will have a material impact on the level of interest rates. The outlook for the federal funds rate will be far more critical to determining the level and shape of the yield curve in the months ahead, in our view.
Inflation I: The Good Obviously, the outlook for inflation matters greatly to determining Fed policymaking and the course of the economy. Let’s have a closer look at the latest inflation data to identify the good, the bad, and the ugly:
(1) CPI excluding shelter. Debbie and I are encouraged to see that the headline and core CPI inflation rates excluding shelter were only 2.3% y/y (versus 3.5% with shelter) and 2.4% (versus 3.8%) in March (Fig. 4 below and Fig. 5). Shelter inflation remains on a slow but steady moderating trend. It was down to 5.7% y/y in March from 8.3% a year ago (Fig. 6).
(2) CPI goods & import prices. Inflation remained subdued in both the CPI durable goods (-2.1%) and nondurable goods (1.7%) (Fig. 7 below). The former has been deflating on a y/y basis since December 2022.
… (7) CPI vs PCED. The CPI inflation rate tends to run hotter than the PCED inflation rate. Over the past 12 months through February, the spread between the two has been 0.7% for the headline (3.2% versus 2.5%) and 1.0% for the core (3.8% versus 2.8%) inflation rates. The average spread since 1960 has been 0.7% for the headline and 0.5% for the core (Fig. 15).
This divergence occurs for several reasons. Rent of shelter has weights of 36% in the CPI and 15% in the PCED. Rent inflation tends to exceed both the CPI and PCED excluding-rent inflation rates (Fig. 16 below).
…Inflation II: The Bad We have often observed that the overall inflation rate matters more than individual components for the purpose of monetary policymaking. For the Fed, the devil shouldn’t be in the details but in the overall headline and core inflation rates. We are clearly breaking our own rule here by getting even deeper into the weeds. There isn’t much the Fed can do about the current stand-out batch of inflationary items like rent, health care insurance, and auto-related costs. Currently, those are the peskiest problems for inflation …
… And from Global Wall Street inbox TO the WWW,
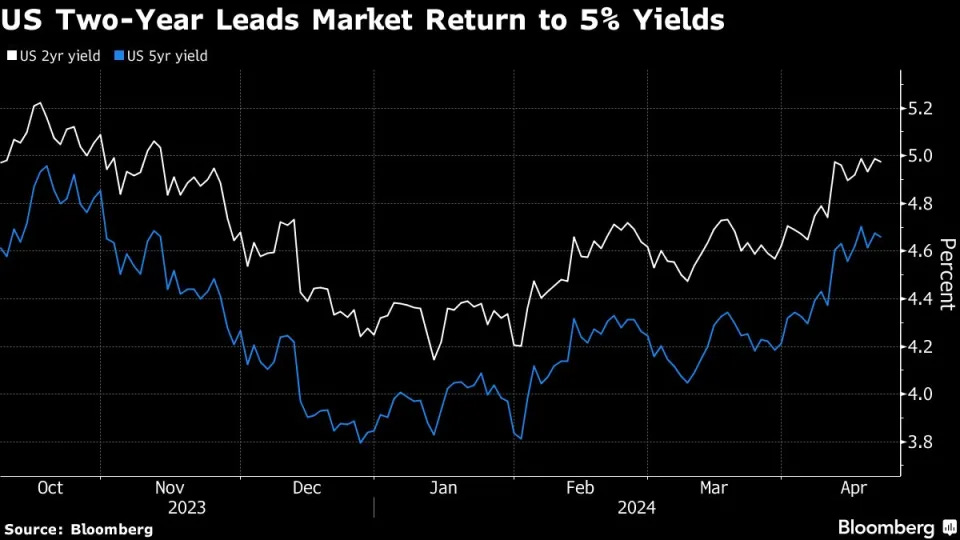
Bloomberg: Bond Traders Look to Record Auction for Sign 5% Yield Is Peak (strikes me that too many are looking at 5% to magically hold AGAIN and so am reminded of the old Bob Farrell rules of trading — see #9 specifically …)
Two-year drawing buyers at 5% level before $69 billion sale
Expectations for Fed also face test with key inflation data
… There’s already a strong indication that investors want to buy after yields surged this month on signs of a resilient economy, which led traders to push out bets on Fed interest-rate cuts to late 2024. The latest leg of the Treasuries selloff briefly pushed the two-year rate above 5% after Fed Chair Jerome Powell signaled last week that the central bank is in no hurry to ease policy.
Now that 5% level looks like the magic number for bond managers seeking to put to money to work in short maturities. For Jack McIntyre at Brandywine Global Investment Management, the message from Powell reinforces the sense that a bottom may be in for Treasury prices…
… Investors also have in mind that the return of a 5% two-year coupon last year presented a buying opportunity. The yield subsequently dipped below 4.15% in January as the market bet on rate cuts as early as March.
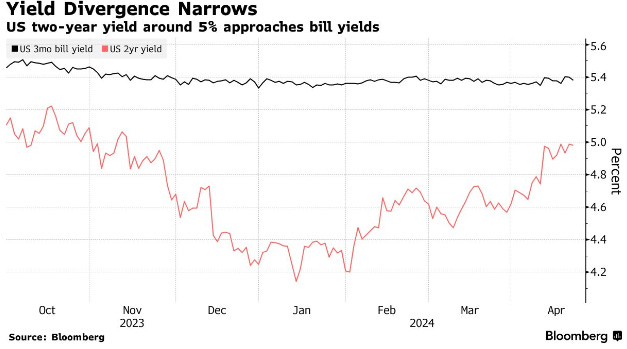
… Bond investors see another potential source of demand for two-year notes at 5%: money market funds. The pile of cash in these funds tumbled in the last weekly data, dropping below $6 trillion, a move that was likely related to tax payments.
But as the two-year rate approaches bill yields that are currently closer to the Fed’s 5.25% to 5.5% range, retail investors may start to see the appeal of locking in these levels until 2026.
Bloomberg: The Fed’s Forecasting Method Looks Increasingly Outdated as Bernanke Pitches an Alternative
Focus on medians increasingly limiting amid repeated surprises
Former Fed chair’s Bank of England report offers alternative
… The issue is not the forecasts themselves, though they’ve frequently been wrong. Rather, it’s that the focus on a central projection — such as three interest-rate cuts in 2024 — in an economy still undergoing post-pandemic tremors fails to communicate much about the plausible range of outcomes. The outlook for rates presented just last month now appears outdated amid a fresh wave of inflation.
An alternative method starting to gain steam is called scenario analysis, which involves emphasizing a range of credible risks to the baseline and how a central bank might respond. It’s a tactic that becomes especially useful in times of high economic uncertainty.
“The Fed urgently needs to incorporate scenario analysis into its public communications,” said Dartmouth College professor Andrew Levin, who was a top adviser to former Fed Chair Ben Bernanke. Levin describes it as “stress tests for monetary policy.” …
… Higher-than-expected inflation data quickly rendered that call obsolete, at least in financial markets: Investors have dialed back the number of cuts expected this year, while options markets say the probability of one cut or less is about a coin toss.
Bloomberg: Four financial questions for Passover (Authers’ OpED)
Looking at assumptions on war in the Middle East, the US economy’s resistance to rates, risk to Magnificent Seven outperformance, and gold’s rising price.
… Why Are Markets so Calm About War in the Middle East, When Such Situations at Other Times Have Prompted Alarm?
Why Is the US Economy So Strong, When Rising Rates at Other Times Have Forced It to Slow Down?
Why Have Investors Turned Against the Magnificent Seven, When They've Been Treated as Infallible?
Why Is Gold at an All-Time Record, When at Other Times High Real Yields Forced Its Price Down?
Sam Ro from TKer: You don't have to look outside U.S. stocks for international exposure
… High and rising interest rates don't spell doom for stocks Generally speaking, rising interest rates are not welcome news for the economy and the stock market. They represent higher financing costs for businesses and consumers. All other things being equal, rising rates represent a hindrance to growth. However, the world is complicated, and this narrative comes with a lot of nuance. One big counterintuitive piece to this narrative is that historically, stocks have actually performed well during periods of rising interest rates.