while WE slept: USTs modestly lower on above avg volumes; a record sized short-covering (FedFunds); "Premature Extrapolation: Inflation Bears Are Popping The Champagne Too Soon"
NOT going to TOUCH bank earnings dribbling out and market / TRADERS doing what they do best … jumping TO conclusions and reflexing TO initial view before calmer heads have a chance to prevail.
In fact, lets talk about that just little bit. Yesterday seemed like one of those days where, if you gave me the data ahead of time, I might not have made money trading it.
Not going to ‘blame’, say, the release and interest in 11 BITCOIN etfs. NOT able to pinpoint late day idea of AIRSTRIKES by joint forces on HOUTHI REBLES (everyone now going TO the google…)
… Even with the upside surprise on the CPI, investors grew in confidence that the Fed are likely to cut rates soon, and yesterday saw the likelihood of a cut by March rise to 78% by the close (from 68% the day before). Similarly, the amount of cuts priced in by the December meeting actually went up by +14.0bps to 155bps, so that’s still a reasonably rapid pace of cuts for the year as a whole, and one that tends to be more consistent with what happens in a recession rather than continued growth. Indeed, we pointed out in Tuesday’s chart of the day (link here) that there’s historically been a high hurdle to cutting that much without a recession. The shift in pricing occurred despite Cleveland Fed President Mester saying that “I think March is probably too early in my estimate for a rate decline because I think we need to see some more evidence”. Later on though, others left the decision more open, with Richmond Fed President Barkin saying that he didn’t wish to “prejudge” a decision about March, whilst Chicago Fed President Goolsbee said that “I don’t like tying our hands”.
With investors still expecting near-term rate cuts, Treasuries rallied across the curve on the day, despite selling off initially after the CPI print. The 2yr yield fell -11.3bps on the day to 4.25%, having traded as high as 4.39% post-CPI. That was driven by lower real yields, however, as the 2yr inflation breakeven was actually up +2.7bps on the day to 2.15%, suggesting that the CPI print did have some impact on market expectations of inflation. Otherwise, the 10yr yield fell -6.2bps to 3.97%, with the 10yr inflation breakeven (+1.8bps) up to 2.24%. Over in Europe, yields on 10yr bunds (-0.8bps), OATs (-1.2bps) and BTPs (-3.8bps) all ended the day lower as well…
… Go figure. Maybe, just maybe it was all related TO a, “…Big Short Cover”
… Big Short Cover A single block trade in the fed funds futures market, struck as the dust settled following Thursday’s December inflation reading, was the biggest size ever seen of its kind. It was for 72,000 contracts in the February 2024 tenor, which expires Feb. 29. The expiration date means that it only captures the Jan. 20 Federal Reserve policy meeting, where expectations for a rate cut are close to zero. This would mean the trade is more likely linked to covering an existing short position in the contract or against another instrument.
… For MORE, here’s the BBG story and chart …
Bloomberg: Record Size Fed Funds Trade in Futures Points to Big Short Cover
Block trade was seen in February 2024 contract after CPI data
Price consistent with a buy, possibly linked to short position
A single block trade in the fed funds futures market, struck as the dust settled following Thursday’s December inflation reading, was the biggest size ever seen of its kind.
The trade took place at 10:46am New York time, as price action had calmed following a hot CPI print. It was for 72,000 contracts in the February 2024 tenor, which expires Feb. 29. Sources in the market familiar with the flow say this is the largest single trade, while CME Group could confirm it was the largest sized fed funds block since at least 2016.
The price action was consistent with a buyer and was worth a cash risk-weighting of $3 million per basis point. That’s similar to roughly $1.5 billion’s worth of the current 2-year cash note. Large block trades in fed funds markets are common, and not an indication a hedge fund or bank is preparing for, or facing, immediate trouble.
Still, the motivation behind the trade for now remains a mistery.
The expiration date of the contract means that it only captures the Jan. 20 Federal Reserve policy meeting where expectations for a rate cut are close to zero. This would mean the trade is more likely linked to covering an existing short position in the contract, or against another instrument such as futures linked to the Secured Overnight Funding Rate. SOFR versus fed funds trades have grown in popularity since the start of the year following renewed debate on the central bank’s asset runoff.
Open interest, or the amount of new risk, has climbed in the February 2024 contract to almost 500,000 futures, a notional value of $2.5 trillion as of Wednesday’s close. Thursday’s volumes of around 285,000 were a record daily amount for the contract.
Friday’s open interest data, released at the start of the Asia session, should spread more light on the motivation behind the trade and if it was a speculative punt on a January rate cut, or simply covering a short position.
Either way, it was huge trade.
About those rate cuts … a few semi-curated links recapping data …
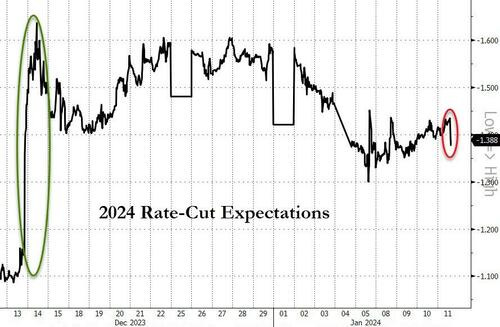
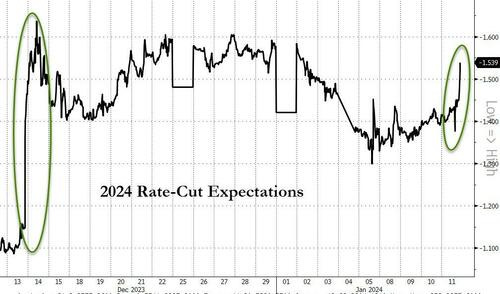
ZH: Headline CPI Hotter Than Expected In December, Food Costs Hit Record High ZH: "Progress Is Still Slow": Wall Street Reacts To Today's Hotter Than Expected Inflation Print (here it’s important to check out RATE CUT EXPECTATIONS DROPPING … )
… Here consensus was that if one strips away the outlier elements, the closely watched - by Powell and his peers - supercore services print rose 3.9% on a year-on-year basis, same as in November, and was also little changed from the 0.4% monthly increase in November. The fact that this category appears to have bottomed isn’t helping the Fed right now: as Bloomberg notes, "there were soft readings from April to July, but it’s picked up again unfortunately for policymakers." Still the overall trajectory remains lower, which is why market expectations for 2024 rate cuts did not really move all that much.
CalculatedRISK: BLS: CPI Increased 0.3% in December; Core CPI increased 0.3% CalculatedRISK: YoY Measures of Inflation: Services, Goods and Shelter CalculatedRISK: Weekly Initial Unemployment Claims at 202,000 BondDad: The good news on jobless claims continues BigPicture: CPI Increase is Based on Bad Shelter Data (isnt good / bad subjective and in eye of the beholder — of good / bad TRADES?) WolfST: Beneath the Skin of CPI Inflation, December: Not in the Mood to Just Go Away
… Did any / all of this to combine and matter as far as the long bond auction came / went …
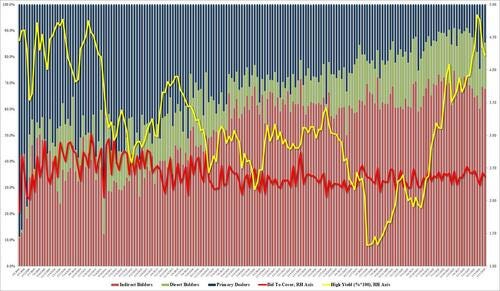
ZH: Impressive 30Y Auction Sees Solid Foreign Demand, No Tail
After yesterday's mediocre 10Y auction, which in turn followed a stellar 3Y, moments ago we also got the first sale of long duration when the Treasury auctioned off $21BN in a 29-Y, 10-Month reopening. The 30Y auction was solid and went off without a glitch: it stopped at a high yield of 4.229%, down from 4.344% in December and the lowest since August. It also stopped through the 4.230% by a paltry 0.1 basis point, the smallest possible margin; this was the second consecutive tail for the tenor and followed 5 prior tails.
The bid to cover was 2.37, down from 2.43 but right on top of the six-auction average 2.39%.
The internals were even stronger with Indirects awarded 67.8% on behalf of foreign buyers; and with Directs awarded 17.7%, Dealers were left holding on to 14.5% of the auction, the smallest since August 2023.
Overall, this was a solid auction, perhaps thanks to the modest post-CPI concession which moved the entire yield curve wider, and the market reaction was subdued with 10Y yields trading around 4.03% both before and after the auction results were announced. The question is when does the market realize that there is a near record $2 trillion in duration coming just around the corner, and when do bond buyers stage another strike.
… and by days end …
ZH: Hot-flation Hammers Hope: Crypto Rips As Yield-Curve Bull-Steepens
… FedSpeak today pushed back a little on the dovish bias we have heard recently - but not aggressively
1150ET *FED'S MESTER SAYS MARCH IS PROBABLY TOO EARLY FOR A RATE CUT
1300ET *FED'S BARKIN: NEED TO BE CONVINCED INFLATION IS STABILIZING
but, despite that and hotter CPI, rate-cut expectations soared (perhaps as traders look-ahead at higher frequency indicators of shelter, used-car costs slowing)...
… for more of the VICTORY LAPPING by Global Wall Street, continue scrolling …
… here is a snapshot OF USTs as of 705a:
… HEREis what this shop says be behind the price action overnight…
… WHILE YOU SLEPT Treasuries are modestly lower after a coalition bombing of Yemeni rebels sparked a bounce in energy prices. DXY is higher (+0.2%) while front WTI futures are 4% higher. Asian stocks were mixed, EU and UK share markets are higher (SX5E +0.6%) while ES futures are lower (-0.25%) as bank earnings start rolling in. Our overnight US rates flows saw better real$ buying in intermediates during Asian hours despite some bear flattening curves then. During London's AM hours we saw long-end selling from systematic accounts while the desk fielded lots of questions about yesterday's post-CPI bull steepening here (see below). Overnight Treasury volume was ~110% of average overall with 5's and 7's seeing relatively elevated (~135% of ave) turnover overnight.
… and for some MORE of the news you can use » The Morning Hark - 12 Jan 2024 and IGMs Press Picks (who CONTINUES to be sportin’ that new, fresh look) in effort to to help weed thru the noise (some of which can be found over here at Finviz).
Moving from some of the news to some of THE VIEWS you might be able to use… here’s SOME of what Global Wall St is sayin’ …
Core CPI continued to round to 0.3% in December, and was up 3.9% from a year ago, amid an upside surprise from used car prices, and continued strength in core services categories, including the important OER. Headline CPI accelerated to 0.3% m/m, led in part by a rebound in energy prices.
BARCAP: US CPI Inflation Monitor (December CPI): Spotty disinflation
The December CPI report suggests very limited progress on disinflation, with core services inflation remaining firm across the stack, and only modest deflation in ex used cars core goods categories. All told, we leave our core CPI forecasts unchanged, at 2.9% y/y in December 2024 and 2.6% y/y in December 2025.
… January CPI could be more of the same, again … Putting these views together, we forecast that core CPI will round to 0.3% m/m (3.8% y/y) in January, continuing the trend from November. That said, closer to the CPI release, our models should paint a more refined picture of where things stand.
At the headline level, we look for CPI to increase 0.2% m/m SA, from 0.3% m/m in December, amid an expected drag from energy prices and modest disinflation in food CPI. This would imply an annual inflation rate of 2.9% y/y, substantially lower than the 3.4% print for December, due in part to favorable base effects, as energy inflation was higher a year ago. That said, we should have better visibility closer to the January CPI release.
BARCAP: Atlanta Fed wage tracker corroborates evidence of wage re-acceleration
The unsmoothed October Atlanta Fed wage tracker accelerated from 5.1% y/y in November to 5.4% y/y in December, supporting evidence from average hourly earnings that wage growth is picking up again. Our state-space model, which draws signals about underlying wage growth from various indicators, concurs.
BARCAP: China: December trade: devil is in the detail
December exports were stronger than expected, with autos and ships standing out. That said, the print was distorted by a low base, as m/m sa and on a 2y average, export growth weakened. We expect exports to fall by 2% in 2024. The rise in iron ore imports reflected indirect steel exports and year-end fiscal support.
BARCAP: China: Persistent deflation to trigger imminent monetary easing
A third consecutive negative monthly CPI print in December marks the longest period of deflation since 2009, highlighting weak domestic demand (consumption and housing drag). We think the visibly entrenched debt-deflation spiral, and across-the-board pessimistic sentiment suggest imminent monetary easing.
• December: -0.3% y/y for CPI, and -2.7% y/y for PPI • Bloomberg consensus forecast (Barclays): -0.4% (-0.3%) y/y for CPI, and -2.6% (-2.6%) y/ y for PPI • November: -0.5% y/y for CPI, and -3% y/y for PPI
Resilient services prices and a pause in goods price deflation kept core CPI firm at 0.3% m/m (3.9% y/y) in December.
We continue to expect the November-December pace of core CPI to prevail over the next few months, before it dips into a 0.2% m/m average range.
Fed officials have emphasized that they will factor the “totality” of data into their policy decisions. While their preferred PCE index has run close to target, today’s CPI report should keep officials wary of declaring victory over inflation too soon. We continue to see the first rate cut of the cycle coming in May.
Preliminary January forecast: 0.2% m/m headline and 0.3% core.
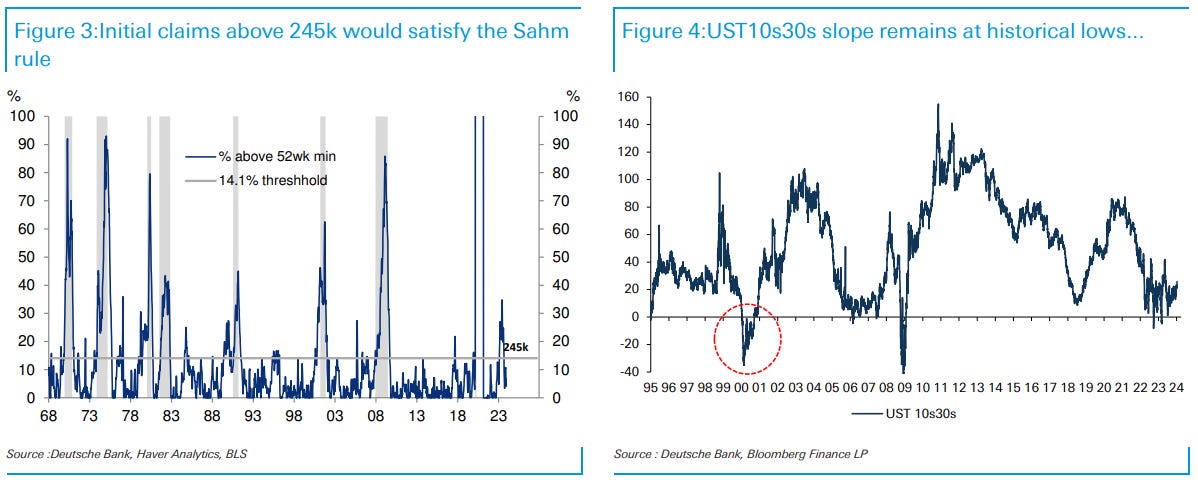
The market is pricing a Fed terminal rate close to plausible estimates of neutral. Thus, rallying substantially from current levels is likely to require evidence of further weakening in the labor market that would justify the Fed easing materially below neutral.
As any significant rally in the front-end should support a recovery in term premia, the 10y rate is likely to be relatively anchored. As a result, absent major new information, UST10y is likely to trade in a range and volatility is likely to decline. As the convexity benefits of longer-dated bonds is reduced, long-end steepeners provide an alternative way of expressing a bearish volatility view. Given our broader view that term premia are too low, we add a UST10s30s steepener (target 45bp, stop 0bp) to our macro portfolio.
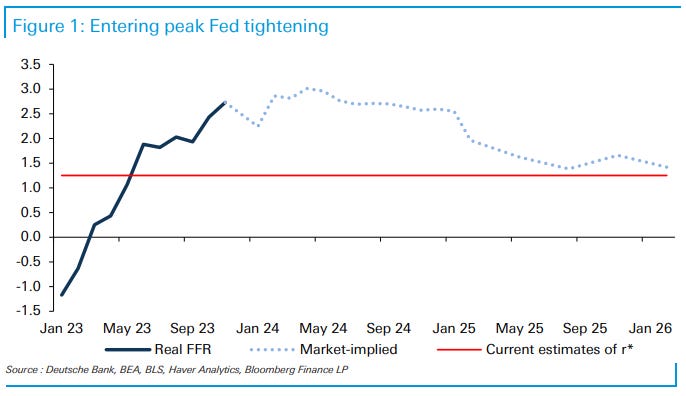
DB: Peak tightening (something not DIRECTLY CPI related but…)
The repricing in the Fed rate cycle towards the end of last year has brought the peak in real policy rates priced by the market forward. As today's CoTD shows, we are now entering peak Fed tightening.
As a reminder, we calculate the real policy rate by subtracting headline PCE from the Federal Funds Rate. The market-implied real policy rate path is obtained via Fed pricing and CPI fixings market, where we use our economists' forecast of the CPI/PCE wedge to derive the market-implied monthly PCE profile.
As we wrote in our macro portfolio update in December, the market is currently pricing a terminal rate close to plausible (but uncertain) estimates of neutral (~1.25%). Therefore, rallying substantially from current levels is likely to require evidence of further weakening in the labor market that would justify the Fed easing materially below neutral.
Goldilocks: Core CPI Slightly Above Expectations on Autos and Medical; Jobless Claims Remain Low
BOTTOM LINE: December core CPI rose 0.31%, 1bp above consensus expectations and compared to +0.28% in November. The year-on-year rate fell one tenth to 3.9%. The composition was mixed, as shelter measures slowed, but the medical and car insurance categories accelerated as prices catch up to the post-pandemic cost environment. New and used car prices were surprisingly strong, clouding the short-term outlook for disinflation in that sector but consistent with eventual large declines later in 2024. We tentatively expect core PCE prices rose 0.20% in December (mom sa). We will update our estimate after tomorrow’s PPI data. Both initial and continuing jobless claims declined against expectations for increases.
ING: Sticky US inflation reduces chances of an early Fed rate cut
In the wake of the Federal Reserve's dovish shift in December, financial markets had moved to price an interest rate cut as soon as March. However, the tight jobs market and today's firmer-than-expected inflation numbers suggest this is unlikely, barring an economic or financial system shock. We continue to think the Fed will prefer to wait until May …
JEFF: Dec CPI +0.3%, Core +0.3%... Surprising Headline Strength, but Looks Unlikely to Persist
■ The December CPI rose +0.3% (+0.303% unrounded) with core up 0.3% m/m (+0.309% unrounded). The headline came in a tick above consensus while the core was as-expected. ■ The upside surprise in the core is rooted mainly in gasoline prices. Although posted prices at the pump are coming down, now below $3/gal in many places, there is a strong seasonal boost to offset expected declines. Gasoline prices in the CPI rose 0.2%, but we expect declines in the months ahead. ■ Shelter, used car, and apparel prices also came in moderately higher than expected, counter to trends that we see in the rental market, wholesale auction prices for used cars, and in deep discounts for apparel advertised for the holidays. ■ Looking through the surface-level measures to the so-called "super core" of core services ex-housing, inflation was steady at +0.4% m/m. ■ The sources of strength that generated the upside surprise relative to consensus are frankly quite suspicious. We do not expect a repeat in January, rather we see more downside risks from payback. ■ We will have a better idea of expectations for PCE inflation after tomorrow's PPI data, but preliminarily, we are looking for +0.2% on both the headline and the core.
Business conditions moved back into expansion territory. The prospect of rate cuts later this year is expected to lift corporate sentiment. Majority of respondents expect corporate margin profiles to remain unchanged. Not much focus on the 2017 TCJA's expiring corporate tax provisions at the moment.
RBC: December U.S. inflation showed marginal upside surprise
… Bottom line: U.S. inflation readings surprised to the upside in December upon a larger than expected increase in some services components. Still, underlying details should do little to alter the narrative of easing inflation pressures in the U.S. - goods inflation ground to a halt by end of 2023, and the scope of price pressure was also left largely unchanged in December from already-narrow level a month ago. The Fed in December made the first important step to signal that potential interest rate cuts are on the horizon. Still, the central bank is expected to stay on a cautious path, especially against a still solid consumer backdrop and persisting resilience in the labour market. We expect the first cut to the fed funds target range in Q2.
…Slower core CPI likely in January — residual seasonality a risk We currently project headline CPI prices will increase 8bp in January seasonally adjusted (34bp not seasonally adjusted) and core CPI will increase 17bp amid declining gasoline prices and a considerable decline in used car prices. (The swing in used car prices alone is projected to contribute 13bp less to the core CPI in January.) These changes would see 12-month inflation slip to 2.9% for the headline CPI and to 3.7% for the core CPI. Looking further ahead, we expect 12-month core CPI inflation to trend down through the year amid increasing goods supply (particularly for motor vehicles), the pass-through of slower new lease rents into CPI rents, and a general easing in the economy. That said, core prices often see their largest increases early in the year — even after seasonal adjustment (see Federal Reserve Notes on residual seasonality), so some near-term strength in the monthly inflation readings would not be a surprise. As always, we will update our inflation forecast as we go through the details of today’s release and additional data becomes available.
… China’s consumer and producer prices remain in deflation. China’s consumer price inflation was positive for only a single month in the second half of 2024. The last time produce price inflation was positive was September 2022. It does imply ongoing pressure to stimulate the local economy (which may have global implications).
US producer price inflation is expected to be benign. It comes after yesterday’s CPI confirmed disinflation forces. Durable goods prices were in deflation for the thirteenth months. Television prices (which rose for nine months in 2021 before collapsing) are a visual representation of transitory inflation. Ignoring the fictitious owners’ equivalent rent, most parts of the US have sub-3% inflation…
Wells Fargo: December CPI: Neither a Gift nor Coal
Summary The final CPI report of 2023 offered few surprises. Headline CPI rose 0.3% in December, a touch more than consensus expectations and driven by slightly stronger energy price growth in the month. Core CPI also increased 0.3%, in this case matching the consensus forecast. Core goods prices were unchanged in December, and on a year-over-year basis inflation in this category is little different than its pre-COVID trend. Core services inflation, however, has remained somewhat stickier, with shelter prices easing only slowly and travel-related prices rebounding somewhat in December.
While headline CPI rose to 3.4% year-over-year in December, the trend in inflation continues to ease. At 3.9%, core CPI on a year-over-year basis is below 4% for the first time in two and a half years, while the three-month annualized rate of 3.3% points to further slowing ahead.
We look for inflation to slow further over 2024 amid improved supply dynamics and more tepid demand from consumers. However, progress is likely to be slower-going this year and keep policymakers uneasy about how quickly inflation can return to 2% on a sustained basis.
… The key characteristics of these assets create a critical risk gauge for bond and equity markets, as risk-seeking behavior in the bond market also bodes well for risk assets.
Check out the High Yield versus US Treasury Bond ratio ($HYG/$IEI):
Bonds supported a stock market rally last quarter. And the HYG/IEI ratio was one of those charts screaming, “All systems go!”
It’s an easy way to monitor credit spreads and the overall health of the bond market.
Remember, if the bond market is happy, everyone is happy.
AllStarCharts: QQQ New All-time High vs Bonds (tell me I’m wrong, he says … is he taunting us? i do believe he is … )
US Treasury Bonds continue to be one of the best ways to underperform during bull markets.
Yesterday the Nasdaq100 closed at new ALL-TIME highs relative to US Treasuries.
In bull markets, the best stocks not only do well on an absolute basis, but they also outperform their alternatives.
Treasury Bonds are a good alternative to stocks, of course. Just not during raging bull markets:
You can see the strength vs Gold as well.
While still not at new all-time highs, we’re seeing new highs for this bull market. And this market is the only one that matters:
Investors love to fight trends. We see that quite often.
In bear markets they’re always looking to pick a bottom.
In bull markets they’re always trying to pick a top.
The conspiracy theories about the fed “breaking something”, whatever that means, were wrong.
The lies about an upcoming recession were just that: lies.
The yield curve, the M2, the government shutdowns, the inflation and all the others ways they tried to keep you from making money this bull market, were all proven wrong.
We still have record cash levels in money market funds just sitting there, underperforming, collecting dust, and just waiting to be put back into equities.
You want to talk about a tailwind?
Investors were positioned very wrong a year ago.
They’re still wrong.
And that’s part of the reason why we think this 18-month old bull market still has legs.
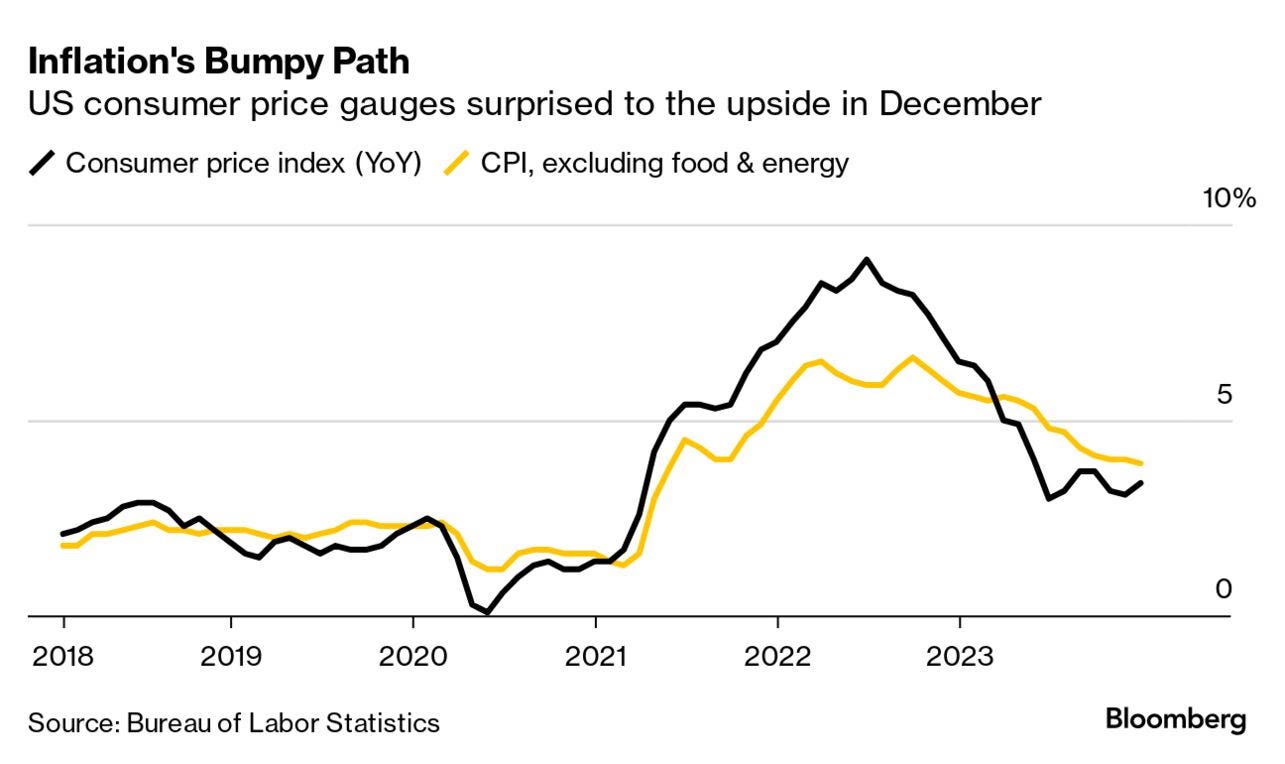
Ignoring Inflation Somewhat counterintuitively, a re-acceleration in US inflation last month only added to the bond market’s conviction that the Federal Reserve will cut rates sooner rather than later.
The consumer price index advanced 3.4% in the year through December, higher than economists’ forecasts and an uptick from November’s 3.1% print. Monthly inflation figures also surprised to the upside.
The market reaction made sense, and then it didn’t. Yields on two-year Treasuries jumped in the minutes after the CPI release, before reversing course to finish the day lower. While Fed swaps initially priced in lower odds of March and May rate cuts, the move was quickly unwound.
For Cleveland Fed president Loretta Mester, the December figures reinforce the idea that a March cut would be premature.
“I think March is probably too early in my estimate for a rate decline because I think we need to see some more evidence,” Mester, who votes on interest-rate decisions this year, said Thursday in an interview with Michael McKee on Bloomberg TV. “I think the December CPI report just shows there’s more work to do, and that work is going to take restrictive monetary policy.”
With that view in hand, Thursday’s bond rally looks counterintuitive. But Lafayette College chief investment officer Krishna Memani offered one explanation, saying it was all about the big picture and it’s important to not “overthink” things at this juncture.
“Fed is cutting rates in not too distant a future,” Memani posted on X. “Today’s CPI or tomorrow’s employment number or anything else is not going to change that outlook.”..
Bloomberg (via ZH): Premature Extrapolation: Inflation Bears Are Popping The Champagne Too Soon (posting in entirety as I’d like to have it to refer to…)
What is typically forgotten is that it is a very lagging indicator, with most arguments based on the recent disinflation trend continuing. But forward-looking analysis tells a different story, with price pressures proliferating on several different fronts.
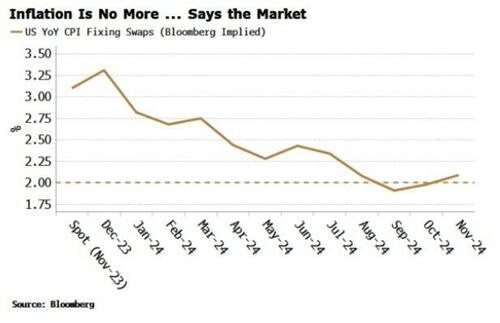
Stocks, bonds, credit and the inflation market offer next to no insurance against a resurgence in price growth.
Inflation may be down, but it’s very much not out.
A Victory Lap’s two main points are that Team Transitory was right, and that tight monetary policy – and the concomitant risk of a large rise in unemployment – was unnecessary.
On the first point, as Chinese premier Zhou Enlai quipped when asked what was the impact of the French Revolution: “it’s too early to tell.”
And on the second, the reason why unemployment didn’t rise more is ultimately down to precisely why inflation is highly likely to remain persistent: the considerable fiscal deficit.
But first, forward-looking data show that inflation pressures are beginning to build on multiple fronts.
I’ll focus on three of the most important here:
money,
supply chains, and
China.
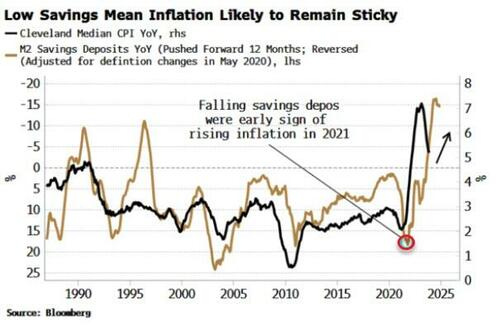
Too often how money is related to inflation is misunderstood.
A standard analysis looks at the aggregates: M2 is contracting on an annual basis, ergo that’s bad for inflation. But M2 is counter-cyclical. It consists mainly of saving deposits. When economic conditions are weak, people tend to move money out of current accounts into savings accounts, and M2 rises, and vice-versa when the economy is strong.
What leads inflation is not aggregate M2, but the inverse of the savings-deposits component. It was the fall in savings in late 2020 that gave one of the earliest signs of the coming rise in inflation.
As the chart below shows, savings-deposit growth remains low today, which points to a re-rise in inflation later this year.
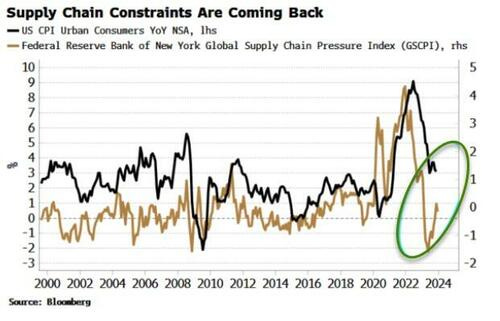
Supply chain constraints have eased considerably since the height of the pandemic, which helped drive inflation lower. But that’s in reverse now, with supply chains tightening again.
One topical example is the skirmish in the Red Sea.
But there’ll be more to come: heightened geopolitical tensions only mean supply chains will remain vulnerable to inflation-causing disruption.
It’s China, though, that doesn’t seem to be part of the reckoning in any inflation analyses.
It was the ghost at the global inflation feast, being the only country to experience outright consumer deflation since the pandemic.
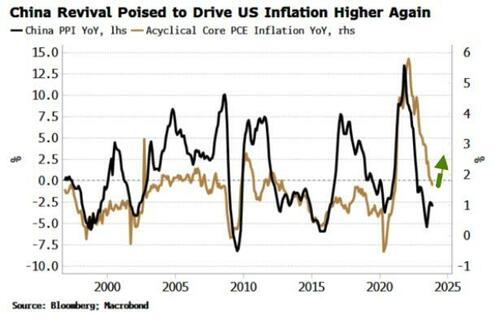
China’s influence on the last year-and-a-half’s disinflation can be seen by splitting US core PCE into cyclical and acyclical components. Cyclical consists of those components that are highly correlated to Fed policy, while acyclical is everything left over.
Cyclical inflation remains elevated, inferring the Fed has had little direct impact on the decline in US inflation.
Instead, most of the heavy lifting has been done by acyclical inflation.
And what is quite remarkable is that acyclical PCE is highly correlated to PPI in China, i.e. depressed inflation in China has likely been a key influence on US disinflation.
This means when China recovers, inflation in the US is likely to be bolstered by the type of price growth the Fed has little control over, even as the lagged effects of its tight monetary policy continue to bite.
Some are of the view that China is nearing its Minsky moment, but I don’t think we’re there yet. Instead the impact of targeted easing in property markets and continued monetary easing will cumulatively build, and eventually kickstart at least a transient recovery.
Floor space started on houses is now rising sharply, and the debt of real estate companies is climbing off its lows, while net injections of liquidity by the PBOC are near levels last seen when China was in the midst of its so-called flood-like stimulus.
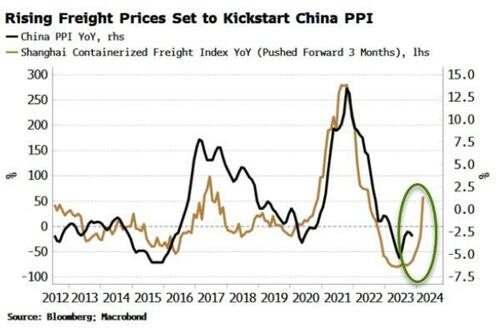
More pertinently, leading indicators of inflation in China are rising.
Shanghai freight container rates have been increasing (supply-chain pressures again), which points to higher PPI — with US inflation likely not long behind.
On a forward-looking basis it’s thus hard to agree with the market’s benign inflation expectations. Or put another way, if inflation was going where the market anticipates, then you wouldn’t want to see the data in the above charts.
Why has inflation fallen while unemployment has barely risen? In answering this we get to the central point of why price growth is likely to be persistent. Normally over 500 bps of Fed rate hikes would have done much more economic damage. That they haven’t is principally due to the government running the largest peacetime, non-recessionary deficit yet seen.
The reaction function of governments, not just in the US, has changed in recent years. With electorates’ rising expectations of what their governments should shield them from — job loss, ill health, high energy prices, even death — it is becoming increasingly difficult to see how sovereigns can rein deficits back in to pre-pandemic norms any time soon.
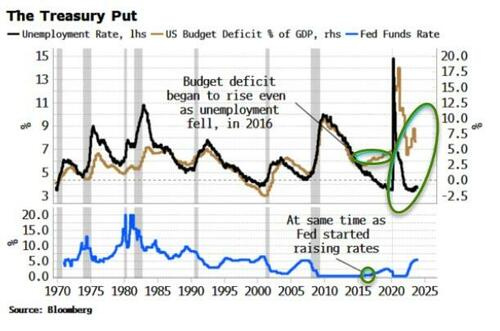
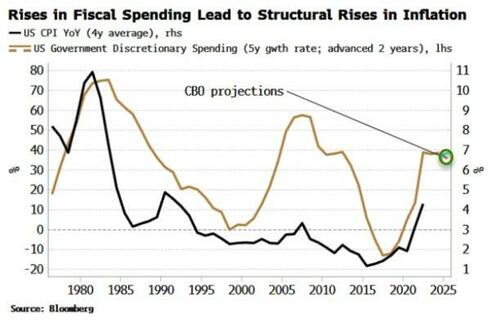
This Treasury put emerged in the mid 2010s. Before then, the US fiscal deficit used to move in line with the unemployment rate. But around 2015, when the Fed started raising rates for the first time since the GFC, the fiscal deficit rose even as unemployment continued to fall. Spending had become overtly pro-cyclical.
The Treasury put is inflationary, with rises in pro-cyclical (discretionary) fiscal spending leading to structural increases in inflation.
Peter Bernholz, in his classic text, Monetary Regimes and Inflation, shows that every high- and hyper-inflation episode of the 20th century was preceded by substantial government expenditures funded by large central-bank balance sheets.
The US is not currently facing hyperinflation, but it should come as no surprise if inflation remains persistently elevated in this environment.
That perhaps explains the principal reason for Mr Stiglitz’s confidence that Team Transitory is right, and Team Persistent - as he christens the other side - is dead wrong: namely that he does not believe excessive fiscal spending caused the recent inflation.
Either way, if you find little utility, as an investor, in more academic debates, you can instead stick to practicalities.
As it becomes clear inflation is on its way back, bond yields and breakevens will rise, stocks will fall, with the highest-duration sectors such as tech facing the most downside, credit will worsen, and gold and other precious metals, as well as commodities, should rise.
Joining Team Profitable will prove the most satisfying choice.
Bloomberg: Slower for longer — Inflation has stopped falling (on that Team Profitable concept, a visual from Authers OpED today which is in addition to his CPI recapathon … )
…To All Who Would Bet Against America... … So let’s go through the arguments made by Sharmin Mossavar-Rahmani of Goldman Sachs Investment Strategy Group, who issued their annual outlook Thursday, titled “America Powers On.” It’s been making a consistent “Pre-eminent America” call since 2011, which has worked well. What’s impressive is that Mossavar-Rahmani and her colleagues obviously listen for the arguments against their bullish view, because they produced a succession of charts that directly attempted to counter virtually all the bear points currently out there.
First, Goldman accepts accept that the US market is expensive — relative to bonds, its own history, and other countries — a finding that would be confirmed by more or less any sensible metric. This is Goldman’s own measure of the equity risk premium, or how expensive stocks are to bonds. It makes the S&P 500 look its most expensive in over 20 years:
However, buying US stocks 20 years ago wouldn’t have worked out too badly, so buying when the equity risk premium is low isn’t necessarily such a bad idea. For the very long-term investor, stocks tend to go up, so buy them.
Goldman’s critical next point is that valuation is no reason to sell at any given time, because it’s of no use in timing…
… Another bear point is that rate cuts are generally bad for stocks; it’s been made often in the last few weeks since the Fed signaled that cuts could come earlier than expected. If the Fed is cutting, it’s because it has reason to do so, and that reason is usually a recession. Goldman counters with this chart showing performance in the year after the first cut of a cutting cycle. They’re divided into times when a recession started within those 12 months (in red) and when the economy kept growing (in green):
This isn’t an argument to buy stocks even if you think a recession is coming. If you’re negative about the economy, that should definitely temper your expectations for the stock market. But it is an argument that easier money pumped into a healthy economy can be very bullish indeed.
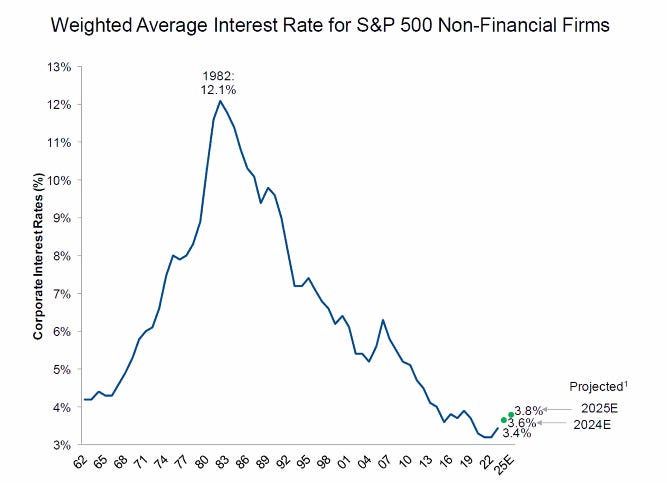
One final bear argument that Goldman tries to dismiss: Corporate interest expense and the risks that debt burdens will start to hit. That’s a worryingly plausible argument for smaller firms, but they point out that many S&P 500 companies have negotiated fixed rates, and less than 10% will need to be refinanced this year. Despite all the rate hikes of 2022 and 2023, the interest rates paid by the biggest US concerns are still barely off the bottom:
How to respond to this? The economic call remains critical. If it turns out that a recession has only been delayed, not averted, then this is not going to be a great time to hold American stocks. And some of the arguments make a strong case against market timing, or attempting to get in and out of the market, while still failing to address how difficult it will be for the US to keep steaming ahead over the next decade.
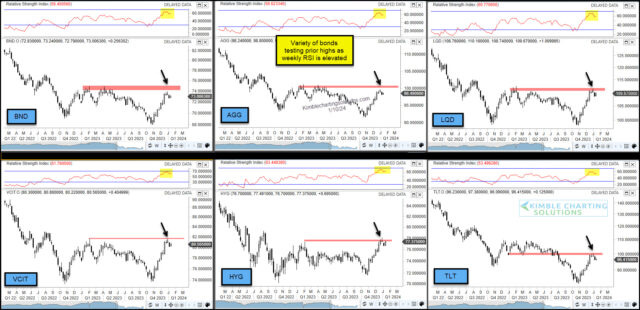
Kimble: Important Bond ETFs Trading At Critical Resistance!
When interest rates fall, bond prices rise. And while it has been some time since we’ve been able to say interest rates are dropping, the past few months have done just that.
The pullback in interest rates is coinciding with investors optimism that the Federal Reserve is done raising rates and inflation is subdued.
Taken together, this has had a very positive effect on bond prices over the past few months.
And we can see this in today’s chart 6-pack of important bond ETFs (that range from junk to corporate to treasury bonds).
That said, the rally from the October lows has each ETF nearing overhead resistance. And this is also occurring while the RSI indicator is near 2-year highs for each asset.
It will be important how these bond ETFs handle this resistance…
… The point of all of these prior examples is that front-running a regulatory change, expecting a lot of demand to materialize, does not always work out very well for the front runners. This does not mean it has to work that way for the approval of these 11 new Bitcoin ETFs, but it is worth keeping in mind. And those prior examples in gold and silver prices did not bring permanent tops when trading was approved, but they were noteworthy tops.
AND thats all for now, HOPE to have somewhat more over the holiday long weekend and with markets closed MONDAY, there will be NO daily spammation (unless conditions warrant) and so … THAT is all for now. Off to the day job…
That was awesome & exhaustive thanks! I do try not to revel in others financial misfortune but 9 out of 9 new BTC ETFs down on Day 1 does make me want to yell "WTF BAGHOLDERS"! I hope they know, like holders of Metals ETFs should know (Got NIKEL LME?), that these products are Synthetic representations of said tangible thing. WHEN SHTF, they will CASH you out, no Gold, Silver, or BTC FOR YOU, says the Soup Nazi!
PS-I entertain both arguments-is The Bitcoin Savior or Psyop? I do agree, there's BTC, then all the other 'cryptos'. At least I no longer hear the claims that "Dogecoin will change and revolutionize currency and exchange". At least Elon cashed out topside lol!
Very interesting letter !!!!!