while WE slept: USTs 'modestly higher' (on light volumes)following EGB post ECB and ahead of NFP; 60/40 'bout to face some "massive" liquidity and issuance 'music'
CNBC: Powell says the Fed is ‘not far’ from the point of cutting interest rates
I realize there were NO F-bombs in last nights speech (Goldilocks reviews and has link TO the speech just below in the case you are having any trouble sleeping at night).
Checking back in with MARKETS to see what’s happened SINCE I last hit send and best to check exactly where I left off …
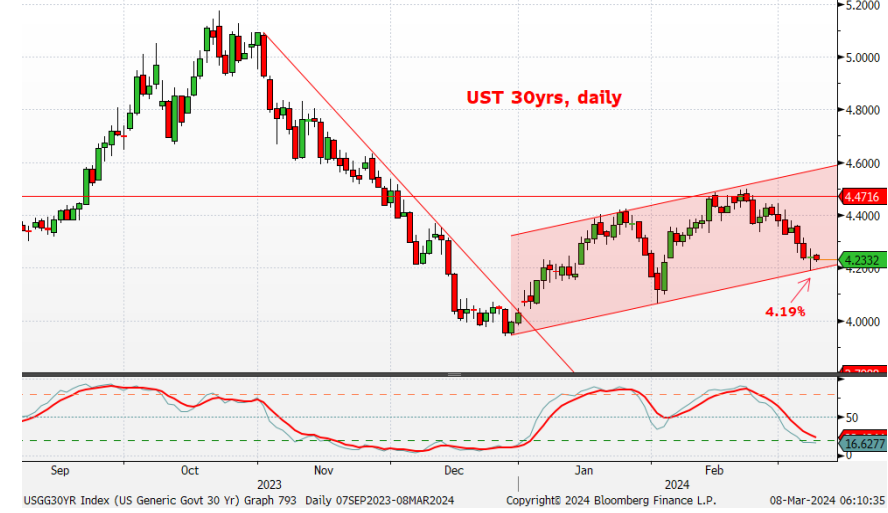
30yy DAILY: well, here we are just about 4.20% in TO NFP which will clearly shine a light on whatever is the path forward … momentum remains overBOUGHT but as we’ve seen (Nov thru early Jan), it can remain so for awhile … and this was then quite bullish … highlighted just below
… Back TO whatever it was I missed and frankly, I’m kinda glad I missed JPOW 2.0 in its entirety and sorry I happened to catch this live (not my recordings but…)
Bloomberg: Powell Says Fed Has to ‘Stay the Heck Out of Politics’
(rhetorical question, was watching both JPOW testimonies! and over the years have seen my fair share of crazy BUT dunno i ever seen anything like this … I guess the takeaway is FDIC shouldn’t particpate in Basel III ? c’mon, man :))
THEN, overnight …
NikkeASIA: Japanese household spending logs biggest drop in 35 months in January (time to tighten!!)
Ahead of this mornings all-important, all eyes on NFP report, I’ll be real brief (apologies if I’ve already wasted TOO much of yer time) and so … here is a snapshot OF USTs as of 706a:
… HEREis what this shop says be behind the price action overnight…
… WHILE YOU SLEPT Treasuries are modestly higher, dragged along by EGB's after some relatively dovish ECB comments this morning (link above). JGB's were weak again (JPY +0.7%) as sources (and the recent wage demands) guide toward a NIRP exit this month (links above). DXY is a hair lower (-0.07%) while front WTI futures are too (-0.6%). Asian stocks rallied, EU and UK share markets are mostly higher while ES futures are little changed here at 6:45am. Our overnight US rates flows saw a firm bid for Treasuries at the crossover to London with real$ demand for 5-7yr paper noted as a theme today- and all week. Overnight Treasury volume was 90% of average…
… Yesterday the Tsy 30yr rallied right to its bear trendline and that's where the up-move ended (4.19%). Today the channel bottom comes in at 4.195% and a close below there would be bullish. But absent that breakdown, one must treat the 4.20% area as a still-significant resistance zone for 30's.
… WHO wore it better? THEY did of course (via Bloomberg) but idea here being we’re all watchin’ the same levels and I’ll fresh up a look at longer-term (weekly) chart of the weekend … and for some MORE of the news you might be able to use…
NEWSQUAWK: US Market Open: Equities are mixed & Dollar flat ahead of US NFP; JPY bid on BoJ sources & EUR slips amid ECB speak … Bonds are bid, with EGBs lifted by dovish ECB speak and ahead of the US NFP …
Finviz (for everything else I might have overlooked …)
Moving from some of the news to some of THE VIEWS you might be able to use… here’s SOME of what Global Wall St is sayin’ and sellin’ just ahead of the NFP
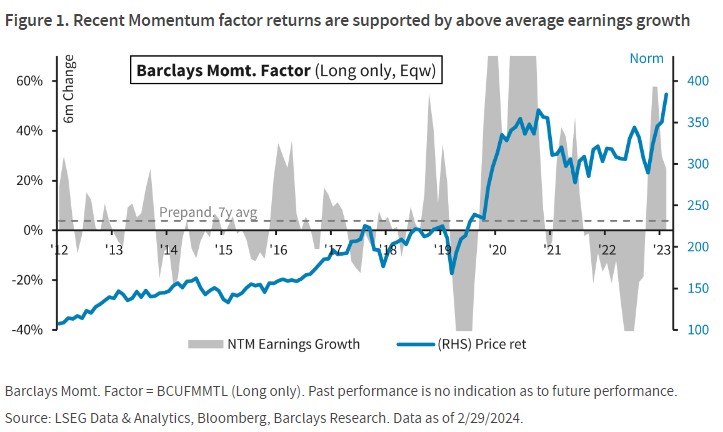
BARCAP: U.S. Equity Strategy: Food for Thought: Building Up Momentum
Momentum is experiencing an ongoing resurgence, supported by a style-specific earnings inflection. We see more room to run, as the factor benefits from its sector weighting, which is favorably biased toward EPS estimates that continue moving higher.
DB: Treasury auction performance and yield movements
With continued increases in Treasury issuance and notable streaks of weak auctions in 2023, we examine 3yr, 10yr, and 30yr auctions (the first set of auctions each month) from last year and investigate yield movements around these liquidity events.
We find that on days with strong auction performance, yields for the auctioned tenor tend to fall over the remainder of the trading day. However, the connection between days with poor auction performance and a subsequent increase in yields is weaker.
Overall, the strongest finding from our analysis suggests going long the auctioned maturity for the rest of the trading day following a strong auction. Additionally, although notable auction concessions were unreliable last year when used as a sole predictor of auction performance, they are still worth paying attention to for the overall forecasting process.
The "Misery index" (the sum of the unemployment rate and inflation) hails back to the inflation era of the 1970s, as one of the more imperfect measures of economic and inflation pain. Yet every four years, many still wield it out in an effort to show the world how well or poorly the current President has performed, on a metric that has often in the past put its finger on the electorates' zeitgeist.. So how does President Biden stack up? By this one measure Biden ranks remarkably well, and even on a more refined metric like the change in the misery index over his Presidency, Biden's numbers are only bettered by Obama’s 2nd term, Clinton’s 1st term and Reagan's 1st term, in the last four decades.
Nonetheless, Biden has a surprisingly tough sell to make the case that expressed negative views in polls on the economy is mistaken. The Misery index's inability to capture the mood and attitudes attached to either of the likely US Presidential election candidates, further underscores the extent to which traditional economic metrics, are not a reliable gauge of the November out-turn, and that extremely elevated FX vols for the November election date are understandable.
O/N FX vol for the US election date for key currency pairs, is indicated (and rounded) at 54 for USD/MXN, 25 for USD/CNH, 24 for USD/TWD, and 27 for EUR/USD respectively. Mexico was central to Trump's foreign policy campaign in 2016, but with the USMCA deal signed off by the former President, this is probably much less important in 2024. US - China relations will likely be deeply impacted by the election, but the differences in candidates' opinions are less stark here, and official China flows have considerable impact in dampening volatility, such that being long CNH vol for any one specific day, warrants caution.
Instead, long USD/TWD vol and long EUR/USD vol, make the most sense to us (versus short USD/MXN), as both Europe and Taiwan should be deeply impacted by the likely candidates' different vision of "the (old) world order" and how far Pax Americana stretches…
… Ahead of this, markets continued to advance yesterday, with investors growing more hopeful about the prospect of rate cuts this year, particularly after the ECB’s decision leant in a dovish direction. That helped equities climb on both sides of the Atlantic, with the S&P 500 (+1.03%) up to another record high and moving back into positive territory for the week. In fact, if the S&P can hold those gains today, then that would mean it’s recorded 17 out of 19 weekly gains for the first time since 1964. So we’re on the brink of a major milestone, with little seemingly able to knock markets from their gains at the moment…
… The amount of Fed rate cuts priced in by December rose by +4.5bps to 92.4bps yesterday, helped by some dovish-leaning remarks from Powell. Speaking to the Senate Banking Committee, the Fed chair suggested the FOMC was “not far from” the confidence it needed “to begin to dial back the level of restriction”. Later on, Cleveland Fed President Mester struck a measured tone affirming expectations of rate cuts later this year but saying that “the bigger mistake would be to move rates down too soon or too quickly”.
… Clearly we’ve got the US CPI release next week, and we’ve seen inflation narratives shift a lot over the last couple of years, but when it comes to markets, there’s a growing confidence that the soft landing and rate cuts are still firmly on the table.
That backdrop led to another round of all-time highs for equities, with the S&P 500 (+1.03%) reaching another record, and taking its YTD gain above 8%. The advance was a broad-based one, which saw the small-cap Russell 2000 (+0.81%) hit its highest level in almost two years, whilst the Magnificent 7 (+2.46%) had its best day since Nvidia’s earnings a couple of weeks ago. Meanwhile in Europe, the STOXX 600 (+0.99%) closed above the 500 mark for the first time, and there were fresh records for the DAX (+0.71%) and the CAC 40 (+0.77%) as well.
We estimate nonfarm payrolls rose by 215k in February—somewhat above consensus of +200k but well below the +353k pace in January. We believe fewer end-of-year layoffs produced last month’s temporary spike, and with the seasonal layoff period now behind us, we assume a return towards a more normal pace of job gains. That said, our forecast also reflects a 30-50k weather boost from workers returning after the mid-January storms. And while Big Data employment indicators indicate a pace of job growth similar to consensus, most of these measures do not generally capture weather effects.
We estimate that the unemployment rate was unchanged at 3.7%—in line with consensus—reflecting a moderate rise in household employment offset by a 0.1pp rebound in the labor force participation rate to 62.6%. We estimate unchanged average hourly earnings (mom sa) that lower the year-on-year rate by three tenths to +4.2%—below consensus of +0.2% / +4.3%—reflecting a 0.2pp drag on the monthly rate from the reversal of January’s weather-related distortions. We also believe upward wage pressures continue to ease.
Goldilocks: Unit Labor Costs Revised Down; Trade Deficit Widens; Initial Jobless Claims Unchanged; Lowering Q1 GDP Tracking to +2.1%
BOTTOM LINE: Nonfarm productivity was unrevised at +3.2% (qoq ar) in Q4 and the year-over-year rate was revised down 0.1pp to +2.6%. Unit labor costs were revised down by 0.1pp in Q4 to +0.4% (qoq ar). Our wage tracker now stands at +4.7% year-over-year in Q4. The trade deficit widened in January from a downwardly-revised level. Initial jobless claims were unchanged, roughly in line with consensus expectations. We lowered our Q1 GDP tracking estimate by 0.1pp to +2.1% (qoq ar). We left our Q1 domestic final sales forecast unchanged at +2.5% (qoq ar).
Goldilocks: State of the Union Speech Kicks off the General Election Campaign
BOTTOM LINE: President Biden’s State of the Union speech Thursday evening (Mar. 7) had a heavy domestic tilt (roughly 1/6 of the speech focused on foreign policy). While it included a few new tax and health policies, the greater emphasis was on the strength of the economy and issues that rank high among voter concerns like immigration, crime, democracy, and abortion. Additional details on proposed policies, as well as additional policies not outlined in his speech, will be released on March 11, when the White House sends its budget proposal to Congress. Following the speech, the implied probability that Biden would be the Democratic nominee ticked up slightly (3pp) in prediction markets.
ADP's estimate of private employment rose 140K, not far from consensus, and bucking the trend of past Februarys.
… We detailed our expectations for Friday's employment report in last Friday's US Economics Weekly on pages 17 to 23. We continue to expect a February increase in private employment of 170K, government employment of 30K, and nonfarm payroll employment of 200K. We expect the unemployment rate held steady at 3.7%, and project average hourly earnings rose a below-consensus 0.1% in February.
The US employment report looms—for all its flaws (which are many), it still evokes excitement. Investors have two questions. Is the economy slowing? Will wage pressures create a fourth inflation wave? Payrolls data hints at the former—if the economy is not slowing the Federal Reserve might feel justified in allowing real interest rates to rise. The answer to the wage question is “no,” and average hourly earnings do not measure wages. Every time you use a self-service checkout, you push up average hourly earnings; your voluntary unreported labor replaces a low-paid worker.
Elsewhere in the employment report look for the number of people holding multiple jobs—a possible sign of stress for lower income households. Participation rates and (appropriately for International Women’s Day) female participation rates also matter economically…
… And from Global Wall Street inbox TO the WWW, for some links to click which may / may NOT help with regards to this mornings NFP …
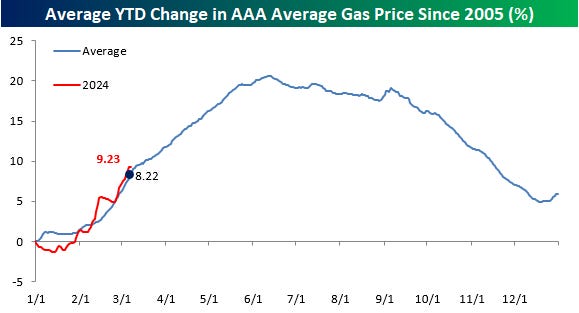
Bespoke: Gas Prices Tick Up; Gold Overbought (I’m sure this is nothing…)
In discussions about inflation this week, we’ve heard multiple references to rising prices at the pump as a sign that inflation is poised to take another leg higher. Based on AAA’s tracking of the national average price of a gallon of gas, prices have indeed taken a turn higher. In mid-January, the price was as low as $3.07 per gallon, but as of today, it’s up to just under $3.40 per gallon and at the highest level since early November.
While the rise in gas prices looks like a concern in isolation, proper context is in order. What if we told you that gas prices almost always rise in the early months of a new year? Going back to 2005, there have only been three years when prices were down on a year-to-date basis through 3/7, and the average YTD change is 8.3%. Given that history, this year’s 9.2% increase doesn’t seem so extreme or worrying.
Look at the chart below where we compare this year’s change in gas prices to a composite of the average YTD change for all years since 2005. They track each other perfectly. Gas prices have increased this year, but they nearly always do at this time of year. When prices start to decline after Memorial Day, as almost always occurs at that time of year, do you think the people crying today about higher gas prices being a canary for higher inflation will also be screaming about a ‘deflationary’ warning then? Something tells us, probably not.
CalculatedRISK: BLS: Job Openings Little Changed at 8.9 million in January
The combined effects of less T-bills, BTFP maturities and QT will hit US Bank Reserves hard with a frontloaded 600bn reduction next quarter. The effect will be felt across most markets we believe.
US equity markets have been setting new highs despite higher rates and an ongoing balance sheet reduction from the Fed. While much of that strength can be explained by strong consumer demand, corporate earnings and a rampant belief that AI will transform the megatech-companies to godlike entities, there is also another factor at play. Increasing excess liquidity in the US banking sector since early 2023 has made sure there is always an extra dollar waiting to be invested in the latest hype. Coming into April, this market safety cushion will be shrinking fast for the first time since 2022. A reduction in T-bill issuance is pushing money market funds back into the Reverse Repo Facility(RRP), leaving less room for bank reserves at the Fed’s balance sheet. The balance itself is also shrinking by 95bn per month under QT. The end of the Bank Term Funding program will add to the pain as 75bn of cheap loans to the banking sector expires by the end of April. In total, more than 600bn in excess reserves could evaporate before we enter summer, creating a serious headwind for financial markets.
Chart 1: Q2 will see Bank liquidity draining at a pace similar to 2022 with implications for markets
… Another impact of the Treasuries downshift in bills issuance, is that they will issue more coupons. The was much ado about their Q3-23 refinancing announcement which estimated a marked increase in coupon auction sizes in Q4. This was probably an important driver behind the selloff and steepening of the UST curve until October. However, looking at the current financing estimates, the net coupon issuance will continue to grow markedly in Q1 and Q2 of this year. In fact, including the implied net selling from the Fed, other investors will have to increase their holdings of UST coupons by 600bn, more than twice last year’s pace. With also less money floating around the banking system to buy and finance trades in the UST-market, we could easily see problems arise at government bond auctions and a repeat of the market moves from last fall.
Chart 5: Investors will have to absorb a lot more Treasury bonds and notes until summer
WolfSt: Fed Balance Sheet QT: -$1.43 Trillion from Peak, to $7.54 Trillion, Lowest since February 2021
ZH: ADP Employment Report Sees Wage-Growth Re-Accelerating In Feb ZH: Job Openings And Hires Slide As Workers Quitting Their Job Plunge To Pre-Covid Levels
… THAT is all for now — hope to return over weekend with a weekly look at long bonds along with traditional post NFP recaps and victory laps but for now ... Off to the day job…
True Story-I had No Freaking Idea that after half a dozen beers & shots at Squaw Valley Wednesday afternoon, the boys & gurls over at the FDIC talk & act FAR more depraved & perverted than us old geezers at the KT22 bar & lounge! A Most Strange turn of events!


I remember the Misery Index....it's a good one
Powell: way more Dovish, than I expected...
SOTU was a Campaign speech....
The State of the Union is LAWLESS......thanks to that Angry Corrupt Lying Illegitimate Demented Demagogue, currently in Power........
True Story-I had No Freaking Idea that after half a dozen beers & shots at Squaw Valley Wednesday afternoon, the boys & gurls over at the FDIC talk & act FAR more depraved & perverted than us old geezers at the KT22 bar & lounge! A Most Strange turn of events!