while WE slept: USTs 'modestly firmer'; "...Cash saw sharp outflows"; BUY 5s -MS; and "Long Rates Are Too High" -Apollo
Good morning … Chinese data overnight suggest they miraculously hit growth tgt (5%, continue scrolling for MORE before jumping on the bandwagon) and while that is certainly good news for them, the markets along with US data (along w/ CPI BID) combining at the moment, creating an interesting (to me) setup.
UST 5yy are being drawn TO a TLINE (resistance) like a moth to a flame …
5yy: at / near RESISTANCE 4.35 (give or take) …
… while momentum measure (stochastics, best I can reckon) shifted and is now overBOUGHT … what next HERE / NOW worth watching … perhaps a WEEKLY visual / review over the weekend …
… Meanwhile, US data initially offer some push-back to the TLINE … ReSale TALES …
CalculatedRISK: Retail Sales Increased 0.4% in December
WolfST: The Fed Needs to Watch Out: Amid Strong Demand from our Drunken Sailors, Retail Sales Surged in Late 2024 and Inflation Caught its Second Wind … More consumers, more workers, more jobs, more money. GDPNow jumps upon these retail sales.
ZH: US Retail Sales Disappoint In December, Despite Surge In Auto Sales & Gas Costs
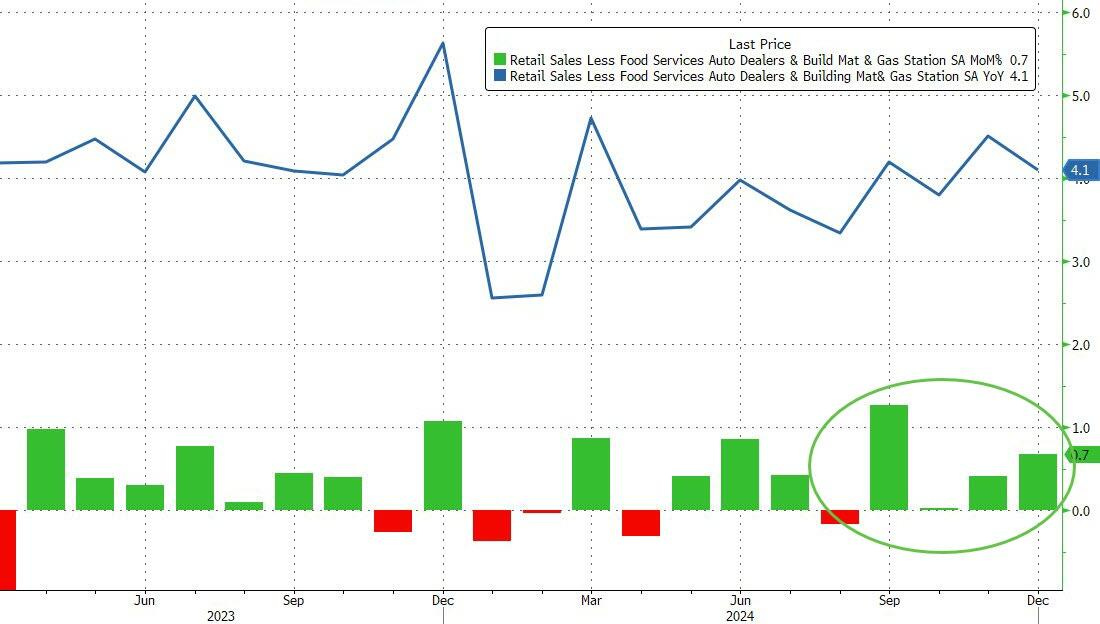
… On the other side of things, the Control Group - which feeds into the GDP calculation - saw a big beat, rising 0.7% MoM (vs +0.4% exp)...
Source: Bloomberg
As a reminder, retail sales data is nominal, so adjusting for inflation (admittedly very roughly) we see real retail sales rose just 1.0% YoY...
… but wait, there was more (or less, depending on yer view) …
ZH: Initial Jobless Claims Hit 3-Year High (Despite Post-Election Surge In 'Hiring Plans')
… More importantly, by days end, Waller commentary was all that mattered…
ZH: Bonds, Bitcoin, & Bullion Bid As FedSpeak Sparks Dovish Jump In Rate-Cut Hopes
… following the data, Fed Governor Waller was very dovish, saying that he wouldn't entirely rule out a cut in March:
"The inflation data we got yesterday was very good," Waller said in an appearance on CNBC (commenting on a 0.1% MoM beat in core CPI which we would not be surprised if it will be revised away next month).
"If we continue getting numbers like this, it’s reasonable to think rate cuts could happen in the first half of the year," he said.
But he did say this...
“It just hinges on the data... If the data doesn’t cooperate, then you’re going to be back to two, maybe even one if we just get a lot of sticky inflation.”
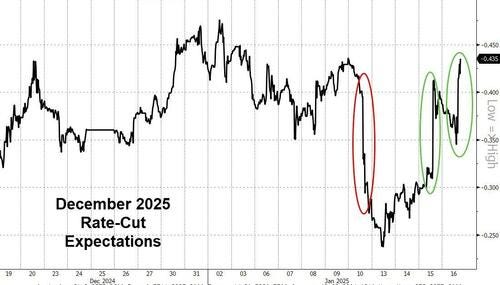
The result of all that, rate-cut expectations continued to rise (now almost 45bps priced in for 2025)
… here is a snapshot OF USTs as of 654a:
… for somewhat MORE of the news you might be able to use … a few more curated links for your dining and dancing pleasure …
IGMs Press Picks: January 17 2025
Yield Hunting Daily Note | January 16, 2025 | BANX Gold, KIO Merging With INSI, Devon Upgrade, Blue Owl
NEWSQUAWK US Market Open: Stocks edge higher, JGBs lag on further BoJ sources, UK Retail sales weigh on GBP … USTs are modestly firmer, but yet to deviate significantly from the unchanged mark. Derived a modest bid from action across the pond as Gilts lifted on the back of soft Retail Sales metrics for December. At a 108-22+ peak but with ranges narrow and the low at just 108-16+.
Opening Bell Daily: Wall Street confusion … Wall Street has no clue what the Fed will do this year … Top banks' rate cut predictions range from zero to five in the coming months.
Reuters Morning Bid: Waller and Bessent help peg back Treasury yields
Finviz (for everything else I might have overlooked …)
Moving from some of the news to some of THE VIEWS you might be able to use… here’s some of what Global Wall St is sayin’ …
First up, what a couple notes on ReSale TALES …
BARCAP US Economics: Strong December retail sales reiterate spending momentum
Retail sales rose a softer-than-expected 0.4% m/m in December, with a very strong 0.7% m/m increase in the control group partially offset by other components. Today's estimates imply upward revisions to PCE and GDP in Q4, with strong carryover effects posing upside risks for our Q1 forecasts.
UBS: A healthy holiday spending season
Retail sales headline slows, control robust
… Sales at the control group of stores — which feed into the BEA's estimate of goods spending in the national accounts — were up a healthy 0.7% over the month though, relative to the 0.4% gain both we and consensus had expected. Some of this could be residual seasonality — with a similar pattern seen in the retail sales data as we have noted across a number of US data points post-pandemic. In the current vintage of data growth in control group sales swung from -0.2% in November 2023 to +1.0% in December 2023. The acceleration today from 0.4% in November to 0.7% in December is a similar pattern. See the figure below. But, looking at the details, the gains were relatively broad based with strong monthly gains in sales at miscellaneous stores (+4.3%), sporting, hobbies, and books stores (+2.6%), and clothing and accessories stores (+1.5%). This provides a robust base as we head into the first quarter…WELLS FARGO: Retail Sales End 2024 in Good Shape
Summary
Retail sales ended 2024 on a solid note. Sales rose 0.4% in December amid broad based gains that suggest a solid pace of overall consumption in Q4. When combined with upward revisions to November sales, the data put 2024 holiday sales just below their long-run average and suggest it was a decent holiday sales season for retailers.
Now for the rest of the story … moving on to a few other items of interest …
Stocks. Fund FLOWS. Note, please, CASH SEEMS TO BE TRASH …
BARCAP Equity Market Review: Goldilocks goes to the inauguration
Investors entered 2025 in a wait & see mode amid rising rates and Trump uncertainty. Goldilocks data and strong earnings this week likely prompted some re-risking. However investors need clarity on Trump's agenda to deploy capital. Inauguration may give some clue, risk premium remains high in Europe
…Weekly Flows update
US assets lead inflows this week, as Cash saw sharp outflows…Fixed income funds ($11bn) are seeing healthy inflows. In US, treasuries are seeing four weeks of strong inflows, along with healthy inflows in IG and HY. In Europe, bonds and IG see inflows this week, while HY saw saw minor outflows. MM funds turned to outflows ($83bn) this week, after three weeks of inflows.
On the year, MM funds lead with $125bn, despite sharp outflows this week. Equities are seeing $64bn of inflows as Fixed income funds lag with $35bn of inflows.
Same shop with an update on China economic news overnight … and here, as always (or is usually the case), there’s nuance and ‘devils in the details’ …
BARCAP China: Target is achieved, devil is in the details
We think the official Q4 GDP data may overstate underlying momentum. While exports front-loading lifted IP growth, domestic demand indicators continued to paint a gloomy picture, with a deeper contraction in property investment and still-soft retail sales. Some data discrepancies are worth noting.
…We are cautious about such a sudden and outsized improvement in the headline GDP data. We highlight some discrepancies in the data that may not be fully capturing developments in the economy.
First, taking the NBS data at face value, we note demand indicators were still significantly weaker than official headline GDP growth and production measures. Unlike DMs, China's GDP statistics are still production-based and rely heavily on IP inputs. The very strong official IP growth in Q4 (5.7% y/y) underpinned better-than-expected Q4 GDP growth of 5.4% y/y. However, demand-side indicators underperformed supply-side indicators by a wide margin. We estimate growth in the weighted average of demand indicators (retail sales, FAI and exports) in real terms was only 3.8% y/y in Q4 24, versus official GDP growth of 5.4%.
Second, the sudden jump in the GDP deflator seems inconsistent with persistent deep PPI deflation and falling CPI inflation. Historically, the GDP deflator tended to track the simple average of CPI and PPI reasonably well. In contrast to 2% GDP deflator inflation, China's simple average CPI and PPI actually declined 1.2% y/y in Q4 24. Moreover, we think the subdued headline CPI print may not fully reflect the underlying weakness in price dynamics. In particular, we see a big gap between official and private data when it comes to housing (accounting for ~20% of the CPI basket). Applying CREIS (Chins Real Estate Index System) rental data, we estimate that gap alone would result in a 0.6pp difference in headline CPI (see China: Another year of low prices, 9 Jan 2025).
Third, private FAI growth surged by 3.7pp, rising to 2.4%, the highest print since March 2022. Such an inflection in private investment data was in sharp contrast to private credit growth data. Private credit demand showed no signs of improvement, with bank loan growth hitting a new record low in December, led by a sustained and visible decline in bank loans to corporates. We think this reflects the fact that corporates have become more cautious in terms of: 1) taking more loans and credit; and 2) increasing capex, in view of prolonged weakness in domestic demand, and rising uncertainty due to rising Sino-US tensions (see China: Headline TSF masks weak private credit demand, 14 Jan 2025)…
AND ‘bout Wall-E …
BMO Close: Betting on Bessent
Treasuries rallied further on Thursday, adding to the post-CPI price action as 10-year yields moved as low as 4.58%. The bid wasn’t a function of the economic data as the Control Group of Retail Sales outperformed expectations and Import Prices were above expectations. While jobless claims increased, it was from suppressed levels and still very tame in outright terms. The ultimate driver of the rally came down to comments from Waller and Bessent. Specifically, Waller noted that, “the inflation data we got yesterday was very good. If we continue getting numbers like this, it’s reasonable to think rate cuts could happen in the first half of the year.” He continued that, “I’m optimistic that this disinflationary trend will continue, and we’ll get back closer to 2% a little quicker than maybe others are thinking.” While we’re reminded of the folly in attempting to extract a trend from a single datapoint, we’re certainly open to the prospects for a 25 bp cut during the first half of 2025 – assuming that inflation continues trending as it did in December…
Then there’s this … something to read / think about over weekend before Monday (and then on into next FOMC meeting …)
DB: Tariffs and Inauguration: how much is priced?
Inauguration Day is less than a week away, and tariffs remain a key topic of discussion for the new administration. Today's CoTD aims to estimate market expectations of tariffs embedded within the US CPI inflation curve.
This is a challenging due to the numerous interacting market factors. Our approach involves examining CPI inflation fixings on a YoY basis (which in theory should remove seasonality effects) and comparing current pricing vs pre-election (05-Nov). We also account for January's gasoline price rally. The chart displays the spread between current and November 5th market pricing . Looking at YoY figures could potentially create distortions if the Oct/Nov/Dec CPI prints were significantly different than market expectations on Nov-05. The cumulative surprise has been ~5bps.
Overall, we find the market is currently pricing something worth ~35/40bps of tariff impact on CPI, which is consistent with a 5% universal / 20% tariff platform implemented swiftly, based on our estimates (see here). We acknowledge potential confounding factors. The rally in natural gas prices may have increased CPI pricing in Q1 25. However, the historical relationship between CPI gas and NatGas futures (see Figure 7 here) suggests the upside relative to pre-election levels is marginal (potentially ~5bps on CPI). Finally, worth noting that we are not considering FX and the impact of the appreciation of the dollar (up ~5% on a trade-weighted index basis), which should act as an offset to the aforementioned impacts.
In conclusion, we think the CPI market pricing is broadly consistent with a 5% universal / 20% tariff platform implemented rapidly, estimated to be worth ~35/40bps on CPI.
Figure 1: CPI market pricing is broadly consistent with a 5% universal / 20% tariff platform implemented rapidly, estimated to be worth ~35/40bps on CPI.
DB US Economic Chartbook - Tariffs primer
…The US has a long history with trade protectionism
…After increasing steadily since the mid-1900s, the trade share of US GDP has declined over the past 15 years
…Trade policy uncertainty spiked to record highs in response to the trade war; has spiked once again
This large German bank offered a few words on China economic announcement overnight …
DB Q4/December Activity: Strong Finish to 2024
China’s real GDP increased by 5.4% YoY in Q4 2024, which is stronger than both market expectations (5%) and our own forecast (5.2%). As a result, the government was able to achieve its 5% annual growth target for 2024…
…December activity was also stronger than expected…
…We reiterate our 2025 growth forecast at 4.8% YoY…
How ‘bout that saying they’ve been up for so long they look down …
ING Rates Spark: Rates having a peek to the downside
We’re still structurally bearish for 2025, but as noted post the CPI release, this market wants to have a bit of a dip lower in yield to see how the water feels there, and will keep dipping until it feels wrong
AND another call to action …
MS: Buy US Treasuries, Sell The USD | Global Macro Strategy & US Economics
Our economists expect the 12-month rate of core PCE inflation to fall when the January data print in February – supporting a March rate cut by the FOMC. Position for a March rate cut, buy 5-year Treasuries, sell 10-year TIPS breakevens, and sell the USD against EUR, GBP, and JPY.
Key takeaways
Our economists expect realized inflation to fall while most investors worry about inflation rising – concerns that market prices already reflect.
The anticipated post-election move higher in Treasury yields gave investors the dip we looked to buy. Move overweight duration: buy 5-year US Treasuries.
Demand for inflation protection also increased post-election, bringing a different opportunity. We suggest selling 10-year TIPS on a breakeven inflation basis.
With higher US Treasury yields came a stronger US dollar. The prospect for lower Treasury yields opens the door for a weaker US dollar much wider than before.
We suggest selling the US dollar against the euro, the British pound, and the Japanese yen. Stay short CNH/INR and long 6m USD/CNH 7.5/7.6 call spreads.
…Position for a rate cut at the March FOMC meeting...
…and position your portfolio long duration
We suggest investors go long duration in the US Treasury market by buying 5-year notes. The technical picture supports the position, in our view, with a major divergence between yield (having made a local high last week) and the moving average convergence/divergence (MACD) indicator (not having made a new high – see Exhibit 5).Exhibit 5: US Treasury 5-year note yield candlestick chart
Up until this point, the heightened risk of post-election better-than-expected economic data suggested a cautious, neutral stance toward government bond market duration. Strong performance of the macro hedge fund community suggested they would likely remain positioned for a continuation of the prevailing post-election trends: higher yields and steeper curves….
Same shop with a pre-inauguration read / game plan …
MS: US Public Policy & Global Macro Strategy: Day One: What to Watch for
President-elect Trump is set to be inaugurated as the 47th President of the United States on Monday, around midday. Expect a raft of policy-related headlines to follow. We discuss risks for which investors should watch and risks to our macro strategists' market views.
Expect a lot of Day 1 executive orders (reports suggest 100 or more), but it's unclear how much signal there will be amidst the noise on the four policy channels we're watching for markets: regulation, tariffs, immigration, and taxes.
Indications of tariff tactics are a particular focus for us. We're watching for actions that could signal greater real-time optionality for raising tariffs (with potential to augment uncertainty on how markets price tariff impacts) and/or a faster, more severe approach (with implications for how markets price growth expectations).
Some signal on legislative policy content and timing is possible as Republican Congressional leaders engage with the press.
Contrary to our base case of fast announcements and slow implementation of tariffs, we think most investors fear the prospect of fast announcements and fast implementation – concerns we think market prices already reflect from a probabilistic standpoint.
If coming executive orders surprise with faster-than-priced implementation of tariffs and/or larger-than-priced increases, then we would expect (1) US Treasury yields at the short end of the curve to increase, and by more than at the long end, in the initial reaction, and (2) the US dollar to appreciate – particularly against the CNY, CAD, and MXN.
Same shop with an update on heels of Chinese growth overnight …
MS PULSE: China Economics: Beat, then What?
Key takeaways
Growth beat in 4Q24 could be short-lived and soften from 2Q25 due to exports front-loading and undershooting stimulus.
Roughly 3/5 of the rebound in real GDP YoY was due to policy-induced recovery in consumption and mfg capex, while the remainder was due to export front-loading.
We estimate that GDP deflator softened to -0.7% in 4Q (vs. -0.5% in 3Q), but stronger real growth means nominal GDP likely improved to 4.6% (vs. 4.0% in 3Q).
We think better data has likely reduced Beijing's sense of urgency and policy may continue to undershoot on the housing and social welfare front.
Growth set to remain resilient in 1Q25 but will likely soften from 2Q25 onwards as stimulus impact fades and tariffs hit.
Here is a note from Switzerland commenting on Bessent as well as China economic news overnight …
UBS: Trade taxes and the US Treasury
US Treasury Secretary-nominee Bessent is a more orthodox cabinet nominee. Yesterday’s confirmation hearings saw generally articulate answers. The responses on trade taxes were troubling. Bessent’s idea that an appreciating currency offsets tariffs is not supported by recent evidence. The idea that US workers will not pay trade taxes is wrong. As he’s an intelligent individual, these views may reflect the beliefs of the incoming administration, not Bessent’s understanding.
China’s official government data reported a 2024 GDP growth rate of 5%, exactly in line with China’s official government growth target of 5%. Academic analysis, including that by FT, has suggested growth numbers may be overstated—even a 3% growth rate implies rising living standards, as China has a falling population. What matters globally is not just China’s growth, but how much China interacts with the rest of the world…
This next note offers a look at the (economic) month, in totality …
WELLS FARGO U.S. Economic Outlook: January 2025
U.S. Economy Has Strong Momentum, but Policy Uncertainty Clouds the Outlook…Monetary Policy & Interest Rates
We have reduced our expectations for rate cuts this year. We now look for the FOMC to cut rates by 25 bps in September and December, one fewer rate cut than our previous forecast.
We have also pushed back our expectations for the end of quantitative tightening (QT). We think balance sheet runoff will continue at its current pace through May (our previous assumption was March).
We expect less and later monetary policy easing this year. We look for the FOMC to hold the fed funds rate at its current level (4.25%-4.50%) until September, when we expect cuts to resume. We forecast a 25 bps cut at both the September and December meetings such that by year-end 2025 the target range for the federal funds rate would sit at 3.75%-4.00%—still a modestly restrictive stance by our estimates. We also have pushed back our expectations for the end of quantitative tightening (QT) by about six weeks. We think that the end of QT will be announced at the May FOMC meeting, rather than in March as we previously expected. We believe yields at the long-end of the curve will fall somewhat as the year progresses but remain elevated amid less policy easing and higher term premiums. Our year-end forecast for the 10-year Treasury yield is 4.25%, up from 4.00% in our previous forecast.
… And from the Global Wall Street inbox TO the WWW … a few curated links …
First, gas prices …
AAA: Rising Oil Costs Bring Gas Prices Along for The Ride
WASHINGTON, D.C. (January 16, 2025)—Oil costs hovering around $80 a barrel have helped push the national average for a gallon of gas four cents higher since last week to $3.10. Meanwhile, today’s national average per kilowatt hour of electricity at a public EV charging station remained at 34 cents…
NEXT … this one hit after I sent YESTERDAYS NOTE and is a great place to start, esp on heels of what was perceived to be a GREAT CPI (although, there’s the rounding issue) …
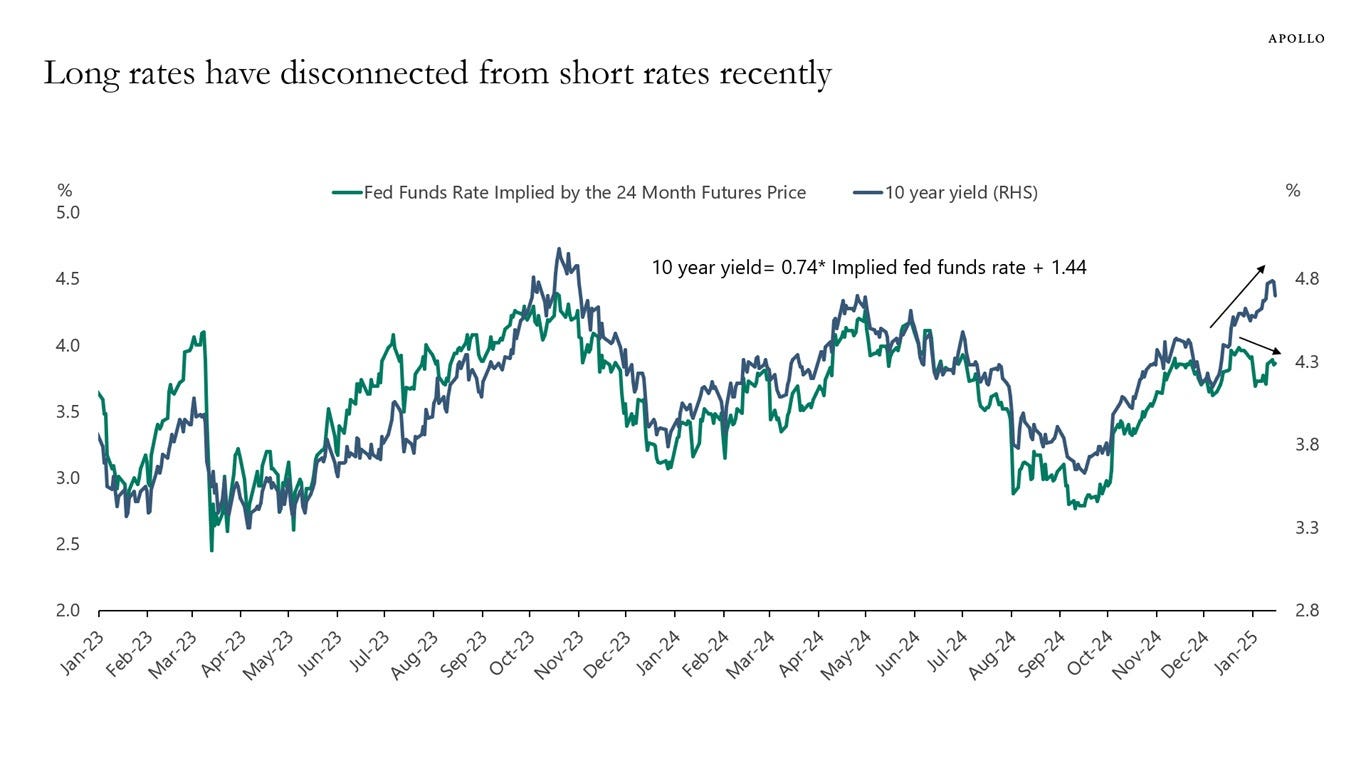
Apollo: Long Rates Are Too High
Long-term interest rates have disconnected from Fed expectations, and a simple model of the relationship shows that 10-year rates are now 40 basis points higher than what Fed expectations would have predicted, see chart below.
The rise in long rates above and beyond what has happened with Fed expectations is consistent with the observed increase in both the New York Fed’s measure of the term premium and the San Francisco Fed’s measure of the term premium.
The worry in markets is that the additional premium in long-term interest rates is driven by fears about fiscal sustainability.
Bloomberg with a view …
BLOOMBERG: The dollar's smile can change the world for Trump
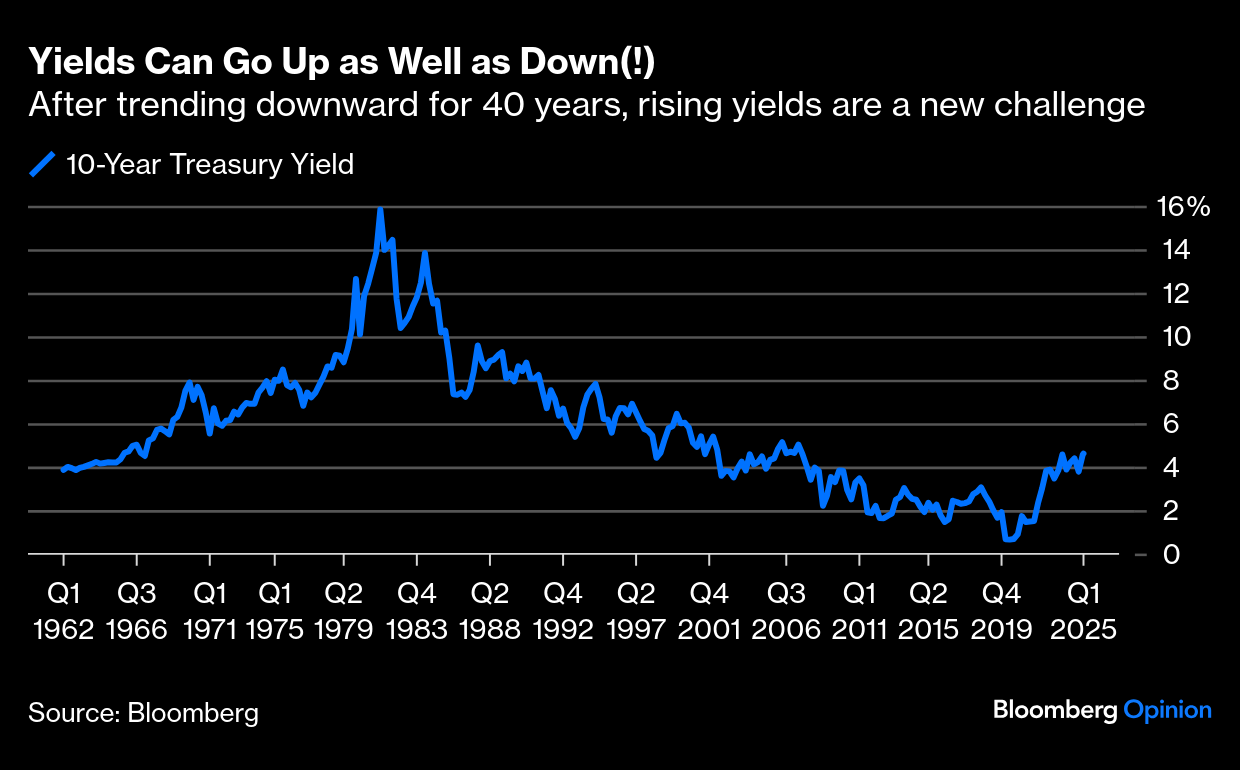
…When Trump took office eight years ago, the long-term bull market for Treasury bonds (meaning yields moved steadily downward) was in full swing. That is over. Comfortable assumptions that there is a lid on yields no longer apply. Traders working today, in bonds and forex, have no experience of a dollar this strong, or of rates that are steadily rising:
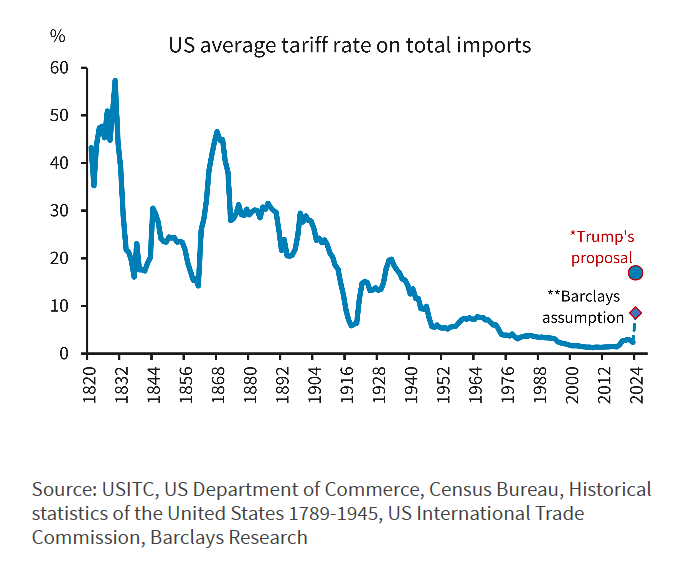
And that’s before Trump arrives and reveals exactly how he’s going to go about levying tariffs. This matters because the secular trend toward ever lower barriers to trade has endured much longer even than the downward drift in bond yields. Some of Trump’s pronouncements, if enacted, would reverse this in truly spectacular fashion. Even the more moderate and targeted tariffs that Wall Street currently expects would represent a historic shift. This chart from Barclays Plc, which we first published last year, indicates the scale of what now seems possible:
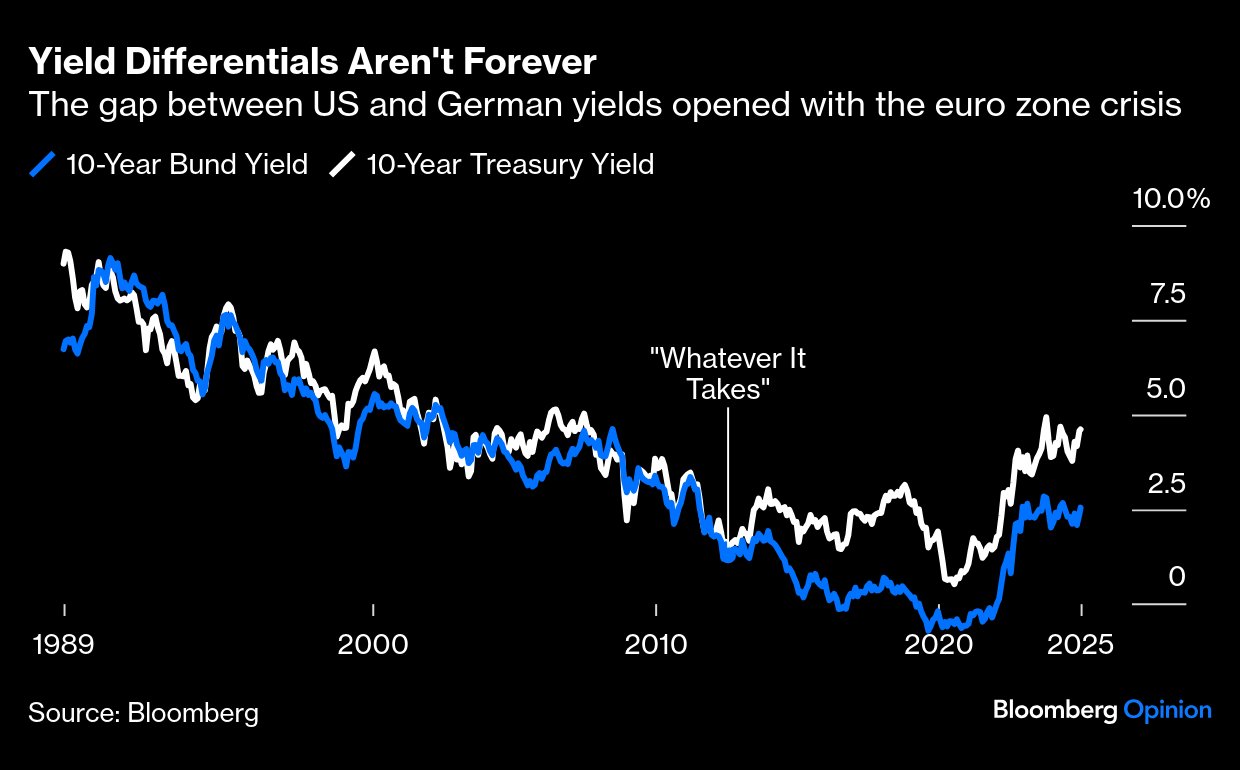
Another factor seemed new and temporary eight years ago but now is taking on some of the trappings of permanence. US and German yields traced each other very closely for years, but that changed with the euro zone crisis at the beginning of the last decade. Euro zone government yields dropped to zero and below as the European Central Bank promised to do “whatever it takes” to save the euro, and big differentials in favor of the US have steadily become the norm:
Finally, inflation is higher than it was eight years ago, and has brought higher rates in its wake.
All the sturm and angst about debt and deficits …
First Trust: Is Government Spending Inflationary?
The stimulus bills approved by Congress starting in 2020 led to the largest surge in government spending in history, coinciding with a sharp rise in inflation. This has led many to assume that government spending itself caused inflation. But is that assumption correct? In today’s “Three on Thursday,” we explore whether government spending inherently leads to inflation. Milton Friedman famously stated, “Inflation is always and everywhere a monetary phenomenon… produced only by a more rapid increase in the quantity of money than in output.” From this perspective, it’s not government spending alone that drives inflation, but how that spending is financed. If spending is funded through borrowing from the private sector, inflationary effects are limited because the overall money supply remains stable. However, when spending is financed by printing new money—expanding the money supply without a corresponding increase in economic output—inflation is inevitable. For a deeper understanding of this relationship, see the three graphics and explanations below….
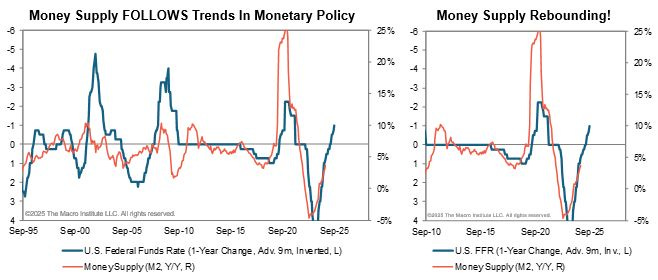
Money supply inspired ‘flation got your attention?
Money supply is growing again in the U.S. ... hmmm! I had not updated this one in a while, but since I am concerned about inflation getting a second act I thought it was a good time to revisit. Money supply is a leading indicator, and up until the late 1980s was actually part of the Conference Board's official LEI until it was replaced with the yield curve. It's not always consistent as a leading indicator, but it is associated with inflation and deservedly so. It's not exactly at 2021 levels, but the economy is running tighter than it was back then and it looks set to accelerate further from here. One to keep an eye on.
AND some more reading on CHINA …
NORDEA: China’s growth continues to rely on stimulus in 2025
According to the official data, China’s GDP growth hit the target at 5.0% in 2024. However, the economic outlook has continued to worry the country's leaders who have promised to increase stimulus policies. We expect growth at around 4.5% in 2025.
Finally, rest in peace up there where you must be in the front rowwwww …
Burning Platform: RIP BOB UECKER
… THAT is all for now. Off to the day job …





Uecker was GREAT thanks for the links