Good morning … time at a price, regardless of whatever the news flow has been / will be and what the FOMC members are saying …
2yy DAILY: momentum overBOUGHT and a consolidation (or selloff) needed to resolve … so, ‘time at a price’ which is what it is currently happening … market doing absolutely nothing wrong …
… checking in on WEEKLY visual, it looks like momentum continues to suggest LOWER YIELDS AHEAD and will update over weekend but worth noting …
… AND said far better than I could ever dream of, 2yy knows best. For more, kindly refer to McClellans Chart of the Day (linked below) and it is noted clearly, the bond market speaking (and Team Rate Cut has been, too).
Now in as far as some of the data behind the price action, well … ZH …
ZH: Continuing Jobless Claims Keep Rising, California Initial Claims Crash
ZH: US Housing Starts & Building Permits Plunge To COVID Lockdown Lows
ZH: Philly Fed 'Hope' Hammered As Inflation Expectations Soar (hmm)
ZH: After A Year In "Recovery", The Economy Is Once Again Contracting (putting it all together…tying in FRBAtlanta GDPNow update — not crashing but … )
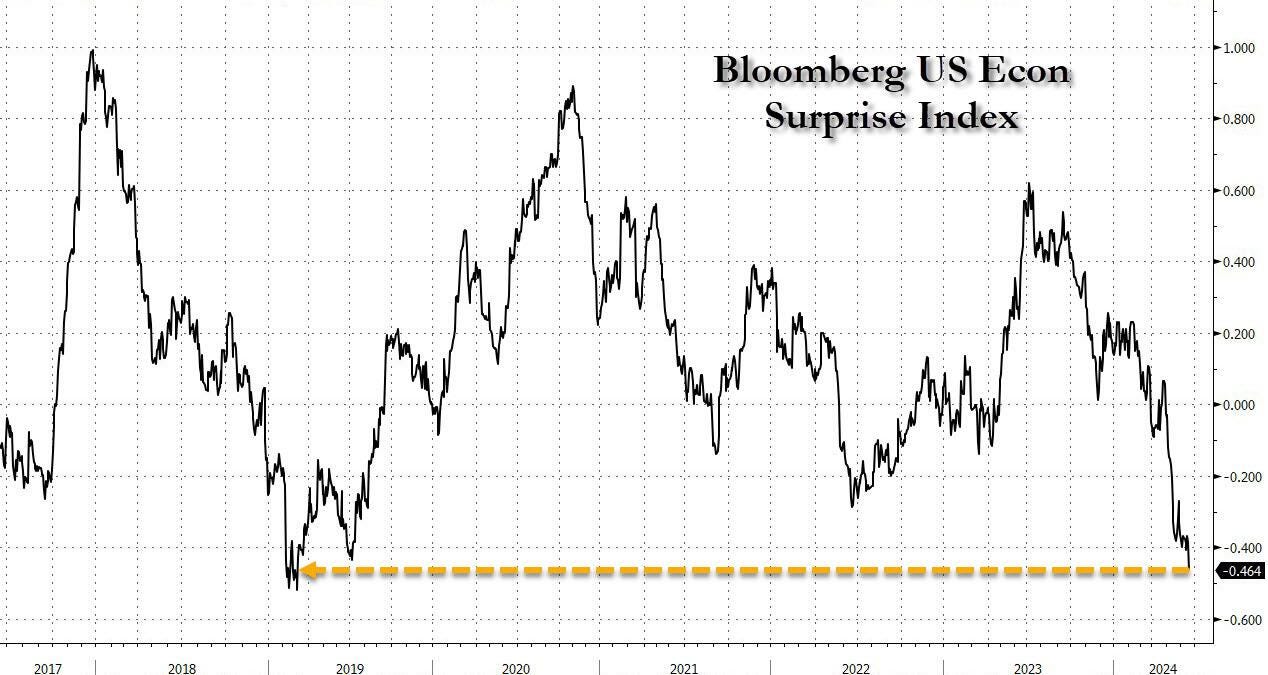
… Putting it all together, the US economy is clearly rolling over, and as the Bloomberg economic surprise index shows as it tumbles to a 5 year low, the magnitude of downside surprises across data are the largest since March 2019.
… and on THAT note, here is a snapshot OF USTs as of 630a:
… and for some MORE of the news you might be able to use…
NEWSQUAWK: US Market Open: Subdued risk tone following downbeat EZ PMIs with equities softer & bonds bid … USTs are modestly firmer and at the top-end of 110-12+ to 110-23 parameters into US PMI data and Fed's Barkin.
Bottom line: Global FMS sentiment most bullish since Nov'21, driven by low FMS cash levels (4.0% = 3-year low) and big equity allocation; but global risk sentiment not yet extreme…BofA Bull & Bear Indicator stays at 6.0.
Housing starts fell 5.5% m/m in May amid wetter than average weather across much of the country. Permit issuance posted a third straight monthly decline in May, falling 3.8% m/m to its lowest level since June 2020.
We have been favouring 5s10s USD breakeven steepener for some time now (see here and here). The view was predicated on the following arguments: front-end downside risks associated with rent inflation, rich outright spot BEI valuations vs macro model, 5s10s flatness relative to the level of front-end BEI and macro data, and 5y5y inflation forwards fundamentally low relative to measures of long-term inflation expectations and inflation uncertainty.
Following price action over recent weeks 10y CPI now trades in line with our macro model. Furthermore, macro indicators suggest the balance of risks on our fair-value model is to the upside, with rising shipping costs (see also here) potentially feeding into our model inputs. 5s10s still trades too flat relative to the level of front-end BEI and macro data. Meanwhile, 5y5y CPI remains fundamentally low relative to measures of long-term inflation expectations and inflation uncertainty, which would suggest a fair-value for 5y5y ZC BEI around 2.9-3.0%. Finally, the fiscal outlook remains supportive, with further upside risks from additional fiscal stimulus along with potential inflationary policies from the next administration (tariffs and immigration reductions - see DBecon analysis here and here).
Overall, as the main argument holding us back from buying 5y5y CPI is no longer valid (rich outright spot BEI valuations), we see 5y5y CPI as attractive from a risk-reward perspective and therefore recommend to switch 5s10s steepener into long 5y5y CPI (ZC BEI current level: 2.56%, indicative target: 2.76%, indicative stop 2.46%).
Going long 5y5y CPI
Wells Fargo: Residential Construction Pulls Back in May Broad Based Weakness Highlights the Headwinds from Elevated Interest Rates
Summary Nearly pulling back all of April's sequential gain, total housing starts fell 5.5% in May to 1.277 million units—the slowest annualized pace in four years. Weakness was broad based as both single and multifamily starts fell on the month. The forward-looking permit activity was also soft, suggesting builders have become less optimistic about prospective demand given persistent inflation and the higher-for-longer interest rate environment.
We anticipate interest rates to remain elevated in the near term, though project two Fed rate cuts in the second half of the year—September and December—that, if realized, would likely lead to a gradual lowering of mortgage rates and support new construction. The scarcity of existing homes on the market should benefit new construction, though affordability remains a substantial challenge for many homebuyers, particularly those purchasing for the first time. Housing demand is expected to remain reasonably firm reflecting the still-healthy labor market and supportive demographic trends. Sustained higher mortgage rates, alongside elevated construction financing costs and a dearth of buildable lots and chronic labor shortages, continue to weigh on home builders' view about the outlook as evidenced by the second straight drop in the NAHB Housing Market Index in June.
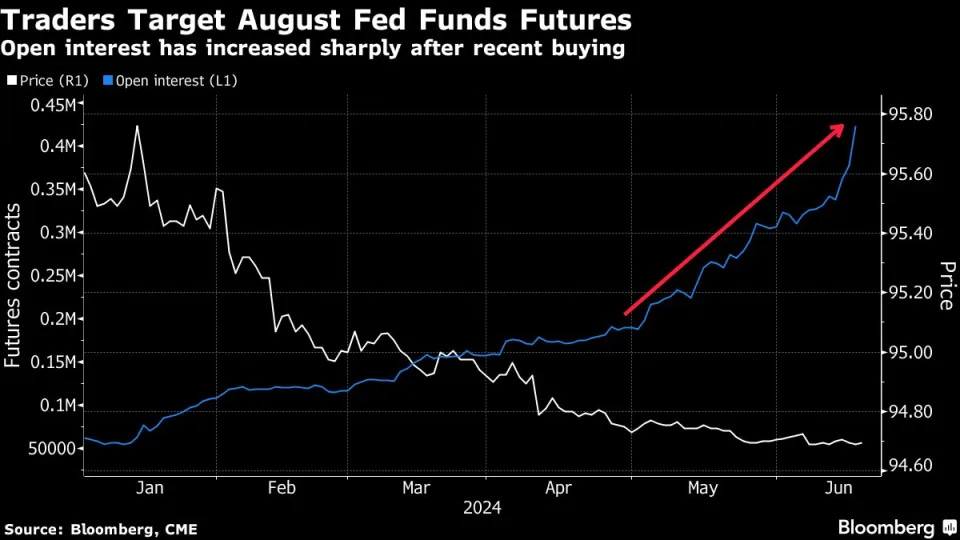
Pair of fed funds wagers to benefit if July rate-cut odds rise
Only one basis point of easing is priced by July Fed meeting
A pair of large bets in the fed funds futures market are attracting attention on Wall Street by setting aside the market-implied consensus for the Federal Reserve’s first interest-rate cut.
The wagers stand to benefit from a ramp-up in expectations that US policymakers will reduce rates as soon as July. While it’s still a far-fetched outcome — given only one basis point worth of easing is priced in by the July 31 decision — the bets underscore momentum in the market for a cut.
One such catalyst for a shift in the market’s rate expectations could come when Fed Chair Jerome Powell gives his scheduled testimony to a Senate panel on July 9. That will take place in the week after June’s jobs report and two days ahead of the next consumer price index print.
The positions have so far been amassed in the August fed funds futures contracts, which expire Aug. 30 and therefore capture the July 31 policy announcement. These contracts are unaffected by policy pricing for the September meeting.
One trade on Tuesday — as investors were leaving their desks before the Juneteenth holiday in the US — showed up as new risk on Thursday. The wager was a 55,000 purchase, with a risk equivalent of $2.3 million per basis point move. This means the leveraged position would profit by about $28 million if the market forecast for a July policy pricing decision becomes a 50-50 proposition.
A similar large buyer appeared last week, for a risk weighting of roughly $1.25 million per basis point. Total open interest in the August tenor now sits at the highest amount at any point in time, pushing well above 400,000 after the recent increase in wagers.
… Inflation as measured by the Federal Reserve’s preferred method, core PCE, has been dropping for nearly two years and yet the central bank remains on hold. That signals the Fed may end up being forced to ease rapidly once it starts. Bonds look like the only winner once the interest-rate cut cycle kicks off, and even that isn’t certain.
The consumer is screaming for a rate cut. A daily employment indicator that policy institutions relied on for gauging the real-time temperature of the labor market during the pandemic has slowed substantially since 2023. ISM manufacturing remains in contractionary territory. JOLTS jobs openings appear to be overstated. In addition, May’s CPI data showed inflation slowing, while producer prices dropped. University of Michigan sentiment index is cratering. All this, with slower consumer spending as measured by May’s retail sales report.
While the Fed is waiting, the US economy may be crumbling. In the meantime, investors are obsessed with the first 25-basis point rate cut that will be too little, and likely too late. A one-and-done may lift investor animal spirits to drive a short-term lift for equities and bonds, but will do little or nothing to stimulate growth. To reinvigorate the economy — in particular the housing market — the Fed will need to be more aggressive, cutting rates by 50 basis points and more than once but unfortunately, that is not going to happen.
So it looks like the central bank will be too late to act. As the US economy hits the wall, equities will suffer. Yes, even AI. The only likely winner is bonds, but only if sticky inflation gets unstuck.
… While the data in the US turned out as we discussed here yesterday, the trading did not. Perhaps the overhang of corporate bond deals won the day, as yields drifted up a couple of basis points, helping send both the Nasdaq 100 and the S&P 500 down on the day. I would have thought the reverse in price action was more likely.
But this wasn't anything fundamental. The drip drip of news out the US has been mostly negative. Going back to the year 2000, we've seen levels below this in terms of negative surprises only a handful of times, generally associated with recession.
We did pull back from the brink after 2011 with the help of quantitative easing and again after 2015 as the shale oil bust in the US caused the Fed to stop rate hikes. But much further below levels today promises a more severe slowdown in economic activity than markets are ready for.
And given how outlandish valuations are in the AI space, it's important that we go no further. Nvidia, for example, is simultaneously the largest company in the world by market value and, at 80 times earnings, is trading for more than three times the S&P 500 overall. Luckily, that's just one stock. But it speaks to a risk-on sentiment that may be getting a bit stretched. In fact, I would call it a mania as far as AI goes.
When tech CEOs start autographing women's chests at tech expos as happened recently, you know you've got some euphoria going on. And sure, it can go on for longer. But for Nvidia, at least, I think it's going to be hard to justify the valuation. Click here for a deeper dive into why I think we've entered mania territory.
Bloomberg The Weekly Fix: Swiss central bank keeps the market guessing (visual of std dev of 10yy on CPI days caught my attn)
… On a Hair Trigger Even with Fed policymakers’ eagerness to share, it’s the economic data that matters more than anything else when it comes to Treasury market volatility.
The gap between one-year standard deviation of 10-year Treasury yield moves on CPI release days versus all days is at the widest since 2009 or so, illustrating just how focused bond traders have become on top-tier inflation releases.
Of course, Jerome Powell has all but trained them to be. The Fed chief has reiterated time and time again that the central bank is following the data rather than its own forecasts — and the US economy has surprised everyone from economists to traders to Fed members over the past four years or so.
“Markets right now are reacting, sort of overreacting, to a single set of discrete data points,” Jerome Schneider, head of short-term portfolio management and funding at Pacific Investment Management Co., told Bloomberg News.
What’s interesting is that even amid the bond market’s well-documented turbulence, options traders have been slow to adequately price in the risk. As covered by Bloomberg’s Carly Wanna, the iShares 20+ Year Treasury Bond exchange-traded fund (ticker TLT) has been been much more volatile than what derivatives tied to the fund imply.
Take last Monday’s weekly TLT straddle, which spanned both the latest inflation reading and the Fed’s June decision. While that priced in a 1.6% move in TLT, the fund ended up rallying more than 4% over the course of the week. That presented buyers of the position with a solid payout, said Christopher Jacobson, co-head of derivative strategy at Susquehanna International Group.
FRBAtlanta: Do Firms Expect Growth in Prices to Persist—and Does Automation Make a Difference?
…Conclusion The second quarter CFO Survey indicates that most firms expect price growth to remain "above normal" this year (relative to before COVID-19). However, we identify a notable divergence among respondents: Firms that implemented automation over the last 12 months expect slower price growth than nonautomating firms. Time will tell whether the bifurcation of price growth expectations by automation status is borne out and whether automating firms return to "normal" price growth more quickly than their nonautomating peers.
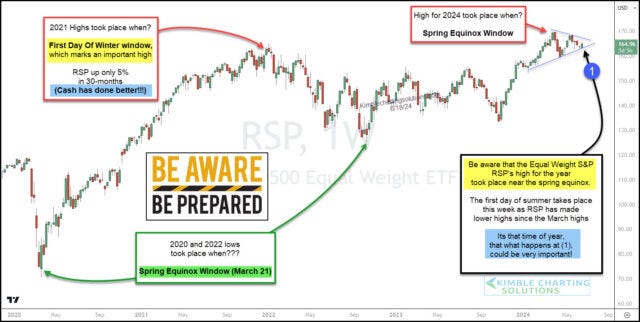
Kimble: Is S&P 500 Equal Weight Index About To Topple Market?
McClellan Financial: Yield Curve’s 15-Month Lag - Chart In Focus (2s know best)
… This week's chart shows the spread between the 10-year and 3-month Treasury yields. It is shifted forward by 15 months to help illustrate how GDP responds with that lag time. This yield spread first inverted on a monthly basis back in November 2022. Counting forward by 15 months takes us to February 2024, which was in the first quarter (Q1). We did not get a negative real GDP growth rate in Q1, but it did fall to a very low positive number. The full effect of the current inversion of the 10y and 3m rates has not yet been felt.
Furthermore, that economic effect should continue to be felt for a period of 15 more months after the 10y-3m spread finally disinverts. In other words, the FOMC members might believe that they are fighting current inflation right now by making current economic conditions tougher via their high interest rates. But in reality, the effect is delayed, and so the continuing inversion of the yield curve means poor GDP conditions for 15 more months after the moment when the yield curve disinverts. And we do not see any sign yet of any disinversion happening anytime soon.
If I could impose one change on our economic system, I would have the Fed outsource setting short term interest rates to the bond market. Let the 2-year T-Note yield determine the Fed Funds target rate.
This chart shows that the 2-year yield knows ahead of the Fed what the Fed is going to do. We all get into problems when the FOMC members with their expensive economics degrees think that they know better than the bond market. When they keep rates too low, meaning lower than what the 2-year yield says, then they help to fuel bubbles in both the stock market and the economy. And when they keep the Fed Funds target rate too high, like they are doing now, they overdo the braking force, leading to big problems.
But as far as I know, none of the FOMC members reads this Chart In Focus series, and they probably would not accept that suggestion from me anyway. People generally do not like to be told that someone (or something) else could do a better job they they do. So we will just have to live with having a Fed which is almost always behind the power curve, and which is going to keep stepping on the gas or the brakes at the wrong time.
…Current Situation Currently, as shown in chart 2, the stock market is in an “All News is Good News” scenario. The good news beta is higher than 72% of the time and the bad news beta is higher than 81% of the time since 2000. Much of this year, the stock market has acted favorably to any news. As displayed in chart 4, while not the worst environment for future stock returns, the optimism which comes with the “all news is good news” scenario has historically produced suboptimal future stock market returns.
So, it would not be surprising if investors face some weaker results near-term since current optimism may need to be tempered. Looking forward, although the news betas will need monitoring, I suspect the financial markets are nearing a period of “good news is good news”. Why? Already in recent weeks as the economic surprise index keeps weakening, more and more parts of the stock market are appearing to react as though bad news is bad news and good news is good news. Note how much recent weaker economic reports have caused “good economic news stock sectors” like small caps, cyclical sectors, and the S&P 500 high beta indexes to underperform. Increasingly, rather than fearing good news will keep the Fed on hold (i.e., good news is bad news), the Russell 2000, the S&P industrials, materials, and financials sectors, and high beta stocks are increasingly suffering from ongoing disappointing economic reports (e.g., recent weakness in the household jobs numbers, a rise in the unemployment rate to 4%, and drop in the labor force participation rate, higher weekly unemployment claims numbers, and softer retail sales). That is, the recent performance in many parts of the stock market is beginning to resemble “good news is good news”.
If economic reports continue showing unexpected weakness, the Fed could soon become much more sympathetic about embracing rate cuts and this could be the catalyst which moves the broad stock market toward a “Good News is Good News” scenario.
Analyst opinions of Dow Jones Industrial Average are mixed, with both bullish and bearish forecasts
While some analysts expect the Dow to hit 40,000 this year, some say it can fall to 34,000
Basic tools like trend lines and support-and-resistance, paired with Fibonacci Retracements, can help you better analyze the technical picture regardless of the outcome
… The near-term downward pressure is more pronounced if you look at a daily chart (see below).
… The Takeaway The Dow Jones Industrial Average (DJIA) may not be the all-encompassing measure of the US economy it once was, but it's still relevant for those investing in blue-chip stocks. Analysts are divided: optimists see the Dow reaching 40,000 by the end of 2024, driven by hopes for a Fed rate cut and Tech sector strength, while pessimists warn of a drop to 34,000 due to global economic slowdowns and geopolitical issues. Nobody knows how economic factors and Fed messaging (plenty of Fed speeches this week) will cause investor sentiment to respond. It's a wait-and-see moment. But, at the very least, you now have a few key levels to watch, whichever side (bull or bear) you find yourself in.
See whatever it is you wanna see. Stay COOL in the heatMAgeddon. Have a great start to the end of the week and good luck out there as you plan your trades and trade your plans…HOPE to have something out over weekend, ‘weather permitting’.


I guess the Bond and Note auctions went well, this week.....
"triple witchin watchin".....that's funny......excellent letter !!!!!
$2.3M per bps bets Melts My Mind