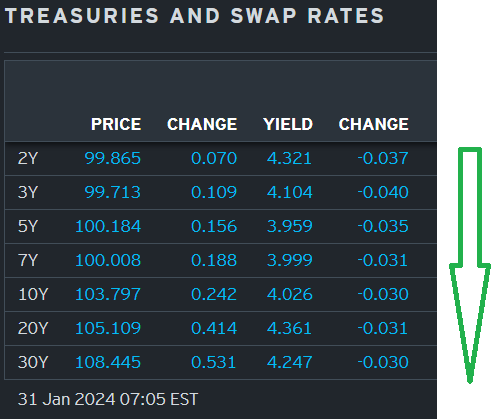
… JOLTS job openings unexpectedly increased in December to 9026k vs. 8750k forecasted and 8790k prior was revised up to 8925k. Within the details of the release, separations and the quits rate were both unchanged at 3.4% and 2.2%, respectively…Treasuries were rallying ahead of the data with 10-year yields edging toward the overnight low of 4.033%. Since the releases, we've seen a shift to a bear flattening theme.
… For somewhat MORE / snark …
ZH: Job Opening Unexpectedly Rebound Over 9 Million Even As Number Of Workers Quitting Their Job Plummets
ZH: Yields JOLTed Higher, Stocks Lower Ahead Of Fed/Treasury
… and for somewhat more ‘cerebral’ take (Global Wall), continue to scroll … But first, a look at bullish price action out the curve as we head IN to ADP, reFUNding and this afternoons FOMC announcement …
… um … I’m NO PhD or CMT or anything fancy dancy like that BUT I spy with my little eyes …
… Moving right along as there is lots of event risk today and while ADP, reFUNding details and the FOMC are to be awesome, for sure, lets NOT forget today IS the last day of the month and so all the stock & bond jockeys will be having EXTRA fun in and around that 4pm timeframe.
Which reminds ME of what I used to do and what was said / sent on January 26, 2021 …
AND for a closer look …
… LINK thru to 2pg summary PDF HERE … LINK to MY VIEWS HERE (with a look at 5yy, HSBC thoughts and…) … LINK thru to RBC note / thoughts HERE
Enough walking thru memory lane … here is a snapshot OF USTs as of 705a:
… HEREis what this shop says be behind the price action overnight…
… WHILE YOU SLEPT Treasuries are mixed ahead of a big day of events here in the US (calendar below). DXY is modestly higher (+0.1%) while front WTI futures are lower (-1.15%). Asian stocks saw more weakness in Chinese shares but strength elsewhere, EU and UK share markets are mixed while ES futures are showing -0.5% here at 7am. Our overnight US rates flows saw block buys during Asian hours after Aussie CPI came light of expectations. Despite that, the desk saw better sellers of 10's and 30's into the uptick. During London's AM hours, flows were muted ahead of today's events. We saw better overall buying concentrated in 2s-10s. Overnight Treasury volume was a hair below the recent average according to colleagues.
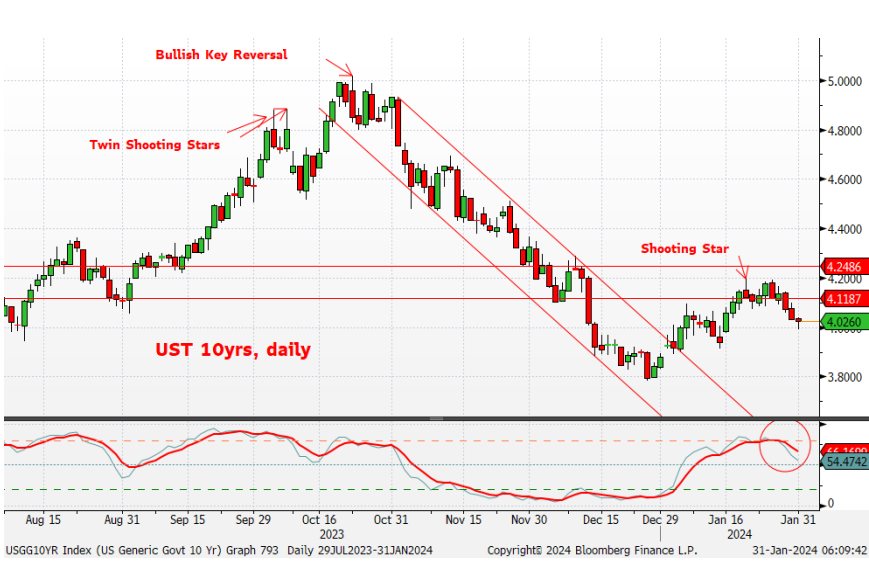
… we can now get into the 'meat' of the week and perhaps find new cause to pry Treasury 10yr yields away from the 4.10% to 4.12% zone they've been so entranced with this year. Today's first attachment checks in with Treasury 10's via a daily chart. As we had noted some days ago, the relatively limited back-up to higher rates so far this year might be taken as a sign of strength-- or at least a reflection of the still bullish longer-term charts we wore the grooves off late last year. Simply, with the 'prevailing winds' still blowing bullishly (as implied by the monthly charts we've shown), perhaps corrections of 'overbought' conditions like that at the start of this year will be short-lived and somewhat modest affairs. Additionally, the multi-month price pattern does appear to be what technicians refer to as a continuation pattern- in this case a possible Bull Flag. The idea being that January's sell-off is/was a pause-that-refreshed after the heavy scamper to lower rates in November and December. Once positioning becomes/became more balanced, the books would say that the impulse move (Nov/Dec rally) can reassert itself once again. By Friday we could know if this interpretation is a correct one
‘til Friday, then it is … and for some MORE of the news you can use » The Morning Hark - 31 Jan 2024 and IGMs Press Picks (who CONTINUES to be sportin’ that new, fresh look) in effort to to help weed thru the noise (some of which can be found over here at Finviz).
Moving from some of the news to some of THE VIEWS you might be able to use… here’s SOME of what Global Wall St is sayin’ …
Job openings increased to 9.03mn, suggesting firmed labor demand, as the hiring rate ticked up while the separation rate held steady. The ratio of vacancies to unemployed ticked up to 1.44. All told, the December data, viewed in conjunction with the recent tenor of hard data, corroborate solid aggregate demand conditions.
We think the NBS PMIs suggest fundamentals remain gloomy at the start of year. Risks to our growth forecast are tilted to the downside. The big drops in input and output prices added more signs that China could face a prolonged deflationary environment, with weakened domestic demand exacerbated by overcapacity issues.
… We recently revised down our quarterly growth forecasts for H1 24 by 0.2pp, to 4.4% q/q saar for Q1 and 4.9% for Q2 (see China: Lower expectations for recovery, 17 January 2024). However, we think risks to our below-consensus forecasts remain tilted to the downside as domestic demand (led by property and consumption) failed to recover. High-frequency data (eg, property sales and auto sales) in January continue to paint a picture of weak domestic demand, with no signs of a quick and sharp rebound in the growth momentum. We think the protracted housing slump and lackluster consumption remain the two biggest pain points for the Chinese economy.
DB: Trading the FOMC as Fed gently leans against March rate cut
The market reaction to the FOMC meeting and its spillover onto most asset markets is likely to be largely captured by the impact on the probability of a rate cut at the following March FOMC meeting.
One of the worst policy mistakes the Fed can make is to cut rates and then regret their actions or need to reverse it, which is itself a big reason why in any close call on a rate cut, they are likely to err on the hawkish side. In addition, it is likely that a majority at the FOMC, think that March is too soon for a rate cut, and are feeling no urgency to cut when the economy is running at full employment and growth is close to, or above trend, even before the latest easing in financial conditions adds momentum.
The Fed's impact on money market pricing is more likely to be in the direction of a reduced probability of a March hike. In the past we have also noted the direct knock on to the likes of EUR/USD as per the relationship in Figure 1. The latest read suggests that a 50-50 probability of a 25bp cut is consistent with a 1.0870 EUR/USD. A 100% probability of a rate cut would point to EUR/USD at 1.1080, while a rate cut that is fully ruled out for March would point the way to EUR/USD at 1.0660.
Were the Fed to deliver on our expectation, with some push-back to a March cut, this would favor a small broad-based USD long against most G10 and EM currencies. In G10, short JPY and SEK are most preferable. Thereafter the run in this USD positive trade will likely be limited by three factors: i) many players came into 2024 with a USD negative view, and are proving reluctant to change strategic thinking quickly; ii) vol and related positioning has been low,.and, not least iii) the proximity to the payrolls data. Remember the NFP data has shown a habit of erring on the strong side in the post-COVID upswing.
In contrast, if Chair Powell surprises us and the market on the more dovish side, then the preference is to express USD shorts via long MXN and BRL, while in G10, favored higher beta longs include GBP and NOK as per the Blueprint. Lastly, Figure 1 should be used as a way of calibrating the appropriate EUR/USD reaction to the shift in Fed expectations.
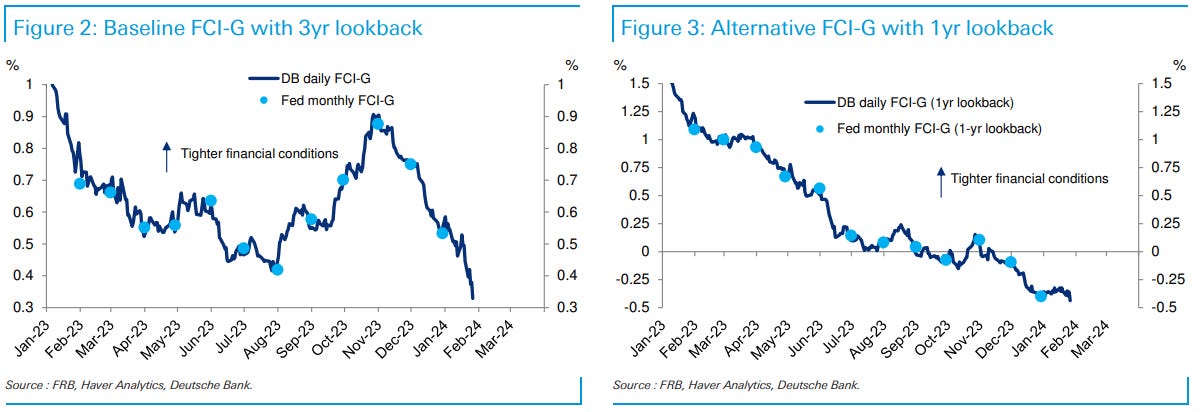
In the lead up to the November FOMC meeting, Fed officials highlighted how the significant tightening of financial conditions could substitute for needing to raise rates further and thus supported a careful approach to setting policy. Since that meeting, financial conditions have eased significantly, as the market has priced a decent chance of a March cut in the wake of the Fed's dovish pivot at the December 2023 FOMC.
In this piece, we update our daily version of the Fed staff's FCI. While the level of the baseline index has financial conditions still weighing on growth, recent easing has conditions at their easiest since September 2022. The alternative one-year index suggests that financial conditions are now a tailwind for growth, with the largest boost since January 2022.
In theory, with inflation still above target and the unemployment rate below their estimate of neutral, this easing should produce a more hawkish Fed, all else equal. Indeed, the minutes to the December FOMC meeting indicated that some officials were concerned easy financial conditions could risk reversing progress on inflation. Correspondingly, several Fed officials have given some moderate pushback on market pricing of March cuts since the December meeting.
That being said, the context of financial conditions easing matters a lot for the Fed. If progress is being made on inflation, they are more willing to accept easier financial conditions. Indeed, with the recent soft readings in the core PCE data, the six-month annualized inflation rate is actually below the Fed's 2% target. As such, Chair Powell can afford to be more sanguine and speak generically about financial conditions increasing the odds of achieving a soft landing (see "January FOMC preview: And now for something completely different"). However, should future hard data show less progress on inflation, Fed officials may look to retighten financial conditions.
DB Mapping Markets: Why higher interest rates are likely to stay in the long term (oh, okay…)
Over the last couple of years, we’ve experienced one of the sharpest rises in interest rates since the early 1980s. This has been a big adjustment after more than a decade of very low rates after the global financial crisis in 2008.
Looking forward, a common question is where interest rates are likely to settle in the long term. This isn’t about the next year or two and the current cycle, but over the next 5-10 years and beyond.
Our view is that the low-rate world of the 2010s was driven by unique factors that are unlikely to repeat themselves. After all, today’s level of interest rates is much more in keeping with the historic norm that prevailed over previous decades and centuries. Moreover, there are still several upward pressures on interest rates over the years ahead…
… 4. The post-2008 period of low interest rates was driven by unique factors that are unlikely to repeat…
… the 2008 financial crisis and the Covid-19 pandemic were incredibly large shocks by historic standards. In terms of the output decline, they were the most severe recessions in decades in the US (Figure 2). And even if recessions do become more frequent over the years ahead, it would be historically unlucky to get a repeat of two shocks that large in the space of just over a decade.
Goldilocks: Job Openings Above Expectations; Consumer Confidence Rises in Line With Consensus
BOTTOM LINE: Job openings increased by 101k to 9,026k in December from an upwardly revised 8,925k in November, against consensus expectations for a moderate decline. After incorporating today’s JOLTS data, our jobs-workers gap based on the JOLTS, Indeed, and LinkUp measures of job openings stands at 2.4mn. The consumer confidence index increased exactly in line with consensus expectations in January, led by a rise in the present situation component, while the December level was revised down. The labor differential jumped.
Goldilocks: Flow effects around Treasury auctions (a trade idea with 72% hit rate? how about more mundane 68% ! where do we sign up … :) )
We document that the strategy of entering a short position in on-the-run USTs ahead of their next auction and holding through auction day typically produces positive returns, especially versus OIS. Swap spread tighteners initiated one week ahead of the 30y refunding auctions have worked 72% of time over the past 18 years, with a median narrowing of 1.2bp and an information ratio of 53%.
A similar pattern is visible in yield curve behavior, particularly steepeners with a 30y short leg: 7s30s and 10s30s steepeners initiated two weeks ahead of refunding auctions auction day yield positive outcomes 68% of the time, with information ratios of around 45%. A similar but weaker pattern can be observed for other curves.
Periods of increased duration supply are more likely to feature steepening ahead of 30y refunding auctions, suggesting that elevated demand for intermediation of duration risk is partly responsible for the observed concessions. Given currently increased levels of duration supply, we expect curves will steepen into the 30y refunding auction in February.
…Looking ahead, our issuance forecasts imply a $22bn increase in monthly duration supply, placing the current period in the top bucket in the exhibit. History thus suggests fairly high odds of the beta-weighted curve steepening into next month’s refunding auction (with median steepening of 6-8bp). However, given potential surprises at the upcoming refunding meeting tomorrow, we hold off on initiating 7s30s steepeners at this time.
The Federal Reserve is not expected to change policy. Fed Chair Powell (not an economist) is unlikely to apologize for past policy errors. The Fed chair might try to take undeserved credit for the rapid US inflation slowdown.
Fed rate hikes have not visibly slowed consumer credit growth, or increased unemployment (fortunately). Fed rate hikes might, very marginally, have aided with the erosion of profit-led inflation. US inflation slowed from 8.1% y/y to 3.4% y/y because it was naturally going to slow. US inflation will slow further in 2024 because the fiction of owners’ equivalent rent is naturally going to slow. Some Fed rate hikes were needed, but later hikes likely had little effect on inflation (though they did impact inequality).
What next? The Fed does not want rising real interest rates, which would compound past policy errors. Expect the Fed to bring policy rates lower as inflation falls (probably with a lag, implying a May cut)…
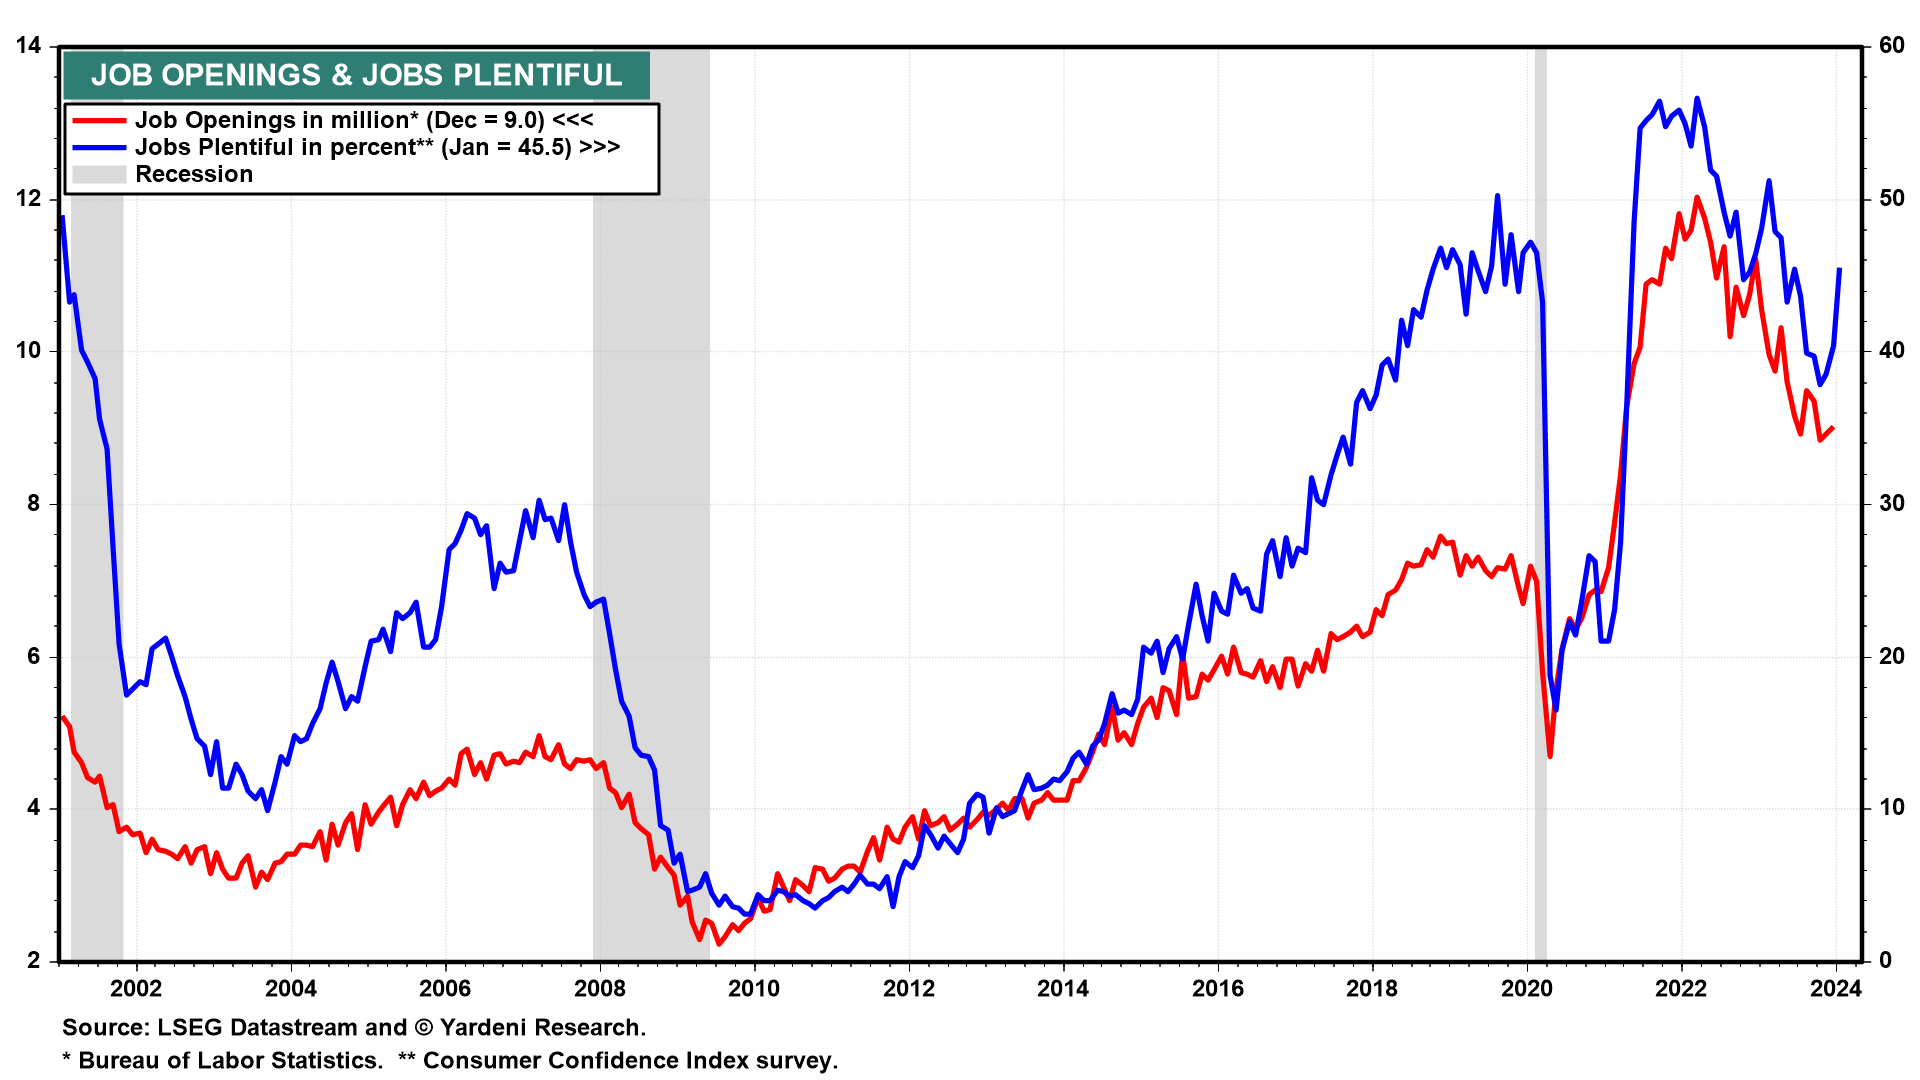
Job openings rise to 9.03 million in December Job openings ground another 101K higher in December to 9.03 million, from an upwardly revised November level that leaves openings looking a little flatter than they did a month ago. The job openings rate was unchanged at 5.6% in December, now hanging on to where it was in July. We wrote in Friday's US Economics Weekly that while we thought we were due for a bounce in openings in December, we expect the general trend downward to continue. Today's data did have a little bounce, but the revisions make the downtrend a little less apparent (chart below). Openings are currently down about 25% from the peak in March 2022, and we do expect the general trend is down, but the data fact is that openings have basically been bouncing sideways since July.
When we look at the JOLTS data, we consider the color on the labor market interesting, but we also look at openings as a backward-looking indicator, one that has missed past turning points. In contrast to the widely-watched openings, the hiring rate looks relatively low compared to history, at 3.6% for employees and 2.9% for private. Both have settled several tenths below pre-covid levels and are down a percentage point from 2021 peaks, another signal that hiring has cooled from the frenzied catch-up of a few years ago. Indeed, the private hiring rate at 3.9% is below the December 2008 and April 2001 levels. The total quit rate was little changed at 2.2%, and in the private sector declined a tenth to 2.5%. Both are back to or below levels that prevailed in the several years prior to the pandemic, as workers' willingness to leave jobs voluntarily abates…
Wells Fargo: December JOLTS: No Surprises to Finish 2023
Summary The December JOLTS data were broadly consistent with a U.S. labor market that is in a healthy place. Openings ticked higher in December but continue to gradually decline on trend. The layoff rate remained low, while the quit rate has returned to its pre-pandemic level in a sign that labor market turnover is no longer as robust as it was a couple of years ago. Less labor market churn is helping to slow labor cost growth, while the low layoff rate is helping to keep employment growth positive. We do not think today's JOLTS data will have a material impact on tomorrow's FOMC meeting. We remain of the view that the FOMC will start cutting the federal funds rate at its May 1 meeting.
Wells Fargo: Consumer Confidence: Time to Hesitate Is Through
Summary Today's two-year high for consumer confidence and new post-pandemic high for expectations corroborates an improved consumer mindset captured in other measures such as this month's consumer sentiment survey. Expectations for rates and inflation are down, while job prospects are up.
… The JOLTS series on job openings through December came out today too; it ticked up to 9.0 million, which is a high reading and might have gone higher this month according to January's consumer confidence survey.
On the other hand, we now have all the regional business surveys conducted by five of the 12 Fed district banks in January. The average of their general business indexes plunged during January suggesting that the national M-PMI might have done the same (chart). That should cheer the hard-landers. However, it doesn't make much sense to us no-landers. Too many other indicators show that the economy is chugging along just fine.
By the way, the consumer confidence survey cited above also has a series showing the percentage of respondents who believe that stock prices will be lower in 12 months (chart). It fell sharply in January to only 24.9%. The bull market may be running out of bears!
… And from Global Wall Street inbox TO the WWW,
Apollo:
Bloomberg(via ZH): The Fed's Independence Was Nice While It Lasted
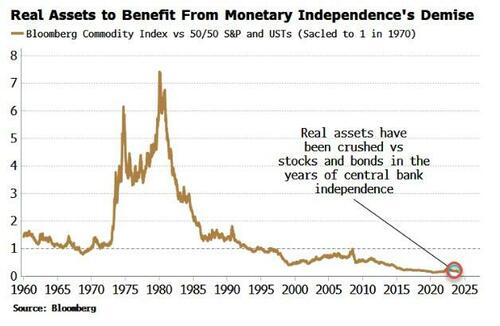
… The market implications are far-reaching. Secularly higher inflation, the end of the nominal Fed put, a structurally weaker dollar, and the reversal of the relentless underperformance of real assets versus stocks and bonds are all themes poised to play out in the coming months and years.
Central banks’ independence is being challenged for two, linked, main reasons: high inflation and large fiscal deficits. Governments, since their dalliance with Modern Monetary Theory (MMT) in the late 2010s, have massively expanded their spending. The pandemic justified a war-like response in sovereign outlays, but large deficits have continued long after the emergency ended.
A “fiscal put” is effectively in place as Covid altered expectations for what governments should underwrite: not just unemployment in the event of a recession, but business solvency, consumption, even life itself.
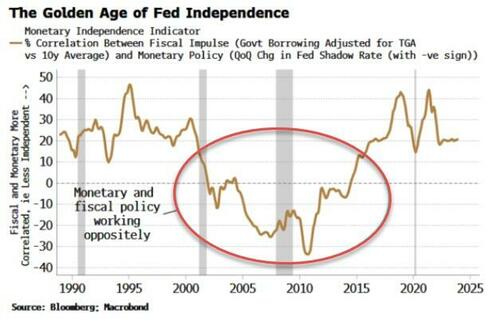
… First, we need to quantify central-bank independence. Governments are inherently inflationary as large, voter-pleasing fiscal deficits typically lead to a structural rise in inflation. Thus the policy of an inflation-targeting independent central bank should be counter to fiscal policy overall through the cycle.
The Monetary Independence Indicator (MII) for the US, shown below, is the correlation between the change in government borrowing and the change in the Fed’s Shadow Rate (so as to include the effects of QE). As we can see, the golden age of Fed independence was from the late 1990s to the mid 2010s, when monetary policy acted contrary to its fiscal counterpart.
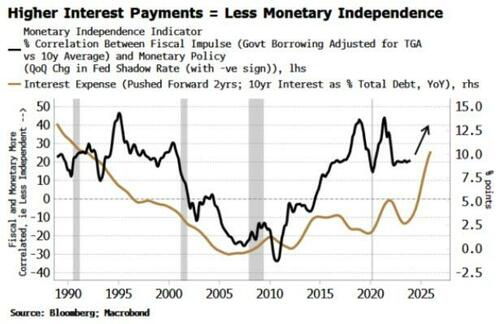
Since then, monetary independence has been slowly eroded and will be further compromised by the government’s bulging interest bill. Interest must be paid for either with more borrowing or higher taxes. Both of these are bad for liquidity by draining reserves out of the system or by reducing their velocity. The central bank ultimately must accommodate this by easing policy.
Overlaying US interest expense on to the MII shows that when the interest bill is high it leads to a rise in the latter, signifying the Fed is acting less independently, and vice-versa. Today’s rise in interest costs shows the Fed’s independence will be increasingly constrained.
The Treasury’s account at the Fed (the TGA) further inflames the outlook. Since the GFC and a monetary system of superabundant reserves (created by trillions of dollars of QE), the Treasury has used its Fed account more. But it was not until the pandemic its size grew to over $1.7 trillion.
At ~$830 billion it’s lower now, and the Treasury aims to keep it around $750 billion. But that’s still a huge lake of liquidity, and the Treasury either significantly adding to it – i.e. taking reserves out of the system and reducing liquidity – or drawing it down, boosting liquidity, has a consequential market impact.
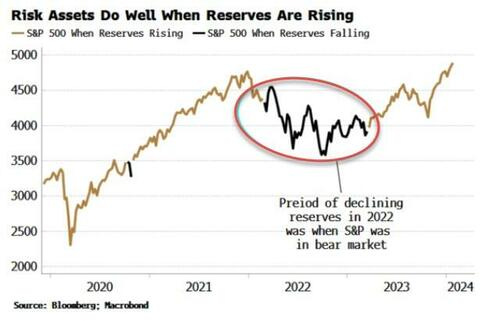
The effect is not merely theoretical. The period of poor S&P returns in the 2022 bear market were accompanied by a worsening trend in reserves, driven by, among other things, a high and generally rising TGA.
The Fed cannot indefinitely overlook this assault on liquidity, as when assets fall as there is a greater risk of a recession-inducing feedback loop between markets and the economy. The TGA is a direct impediment to the Fed’s operational freedom…


Outstanding article!!!........Mr. Managing Director.....
Congratulations !!!!
I knew you had some Big Time job....with all the Brain Power displayed in these letters....
The Best Daily Fixed Income Summary, in the business, bar none....
Like the piece on Federal Reserve's Independence...
Farrel's Rule #7 rivets my attention currently....