while WE slept: USTs lower on light vol; 'Past 20yrs suggests disinflation, but the past 100 warrants caution'; Cash is KING; Bostic speaks, another 10bps cuts OUT; 4.55% 10s by March?
Good morning … So, yesterday we learned of UK / Japan economic troubles which were then chased down by a heaping tablespoon of our very own issues … ReSale TALES …
CalculatedRisk: Retail Sales Decreased 0.8% in January ZH: US Retail Sales Plunged In January, Worst YoY Growth Since COVID Lockdown ZH: Goldman Is Stumped By the Plunge In Retail Sales: Here's What Happened
… perhaps some holidays and BNPL indigestion? Weather maybe?
But wait, there’s … not more but … less …
CalculatedRisk: Industrial Production Decreased 0.1% in January ZH: US Manufacturing Output Plunged In January (Despite Surge In PMI)
Whatever the case may be, this week we’ve seen just about everything and spotted on the intertubes, this one just about sums up price action (of stonks) …
… AND we’ve all moved on from that SO it’s likely time to start … hedging4hikes?
… Narratives change pretty quickly when traders have their eyes trained on every incremental data point. Case in point: rate hikes are back in the conversation.
Citigroup Inc. said this week that markets would be wise to start hedging for the possibility that the Federal Reserve reverts back to raising rates after a brief easing cycle.
“The market should price in some risk of future hikes – look to 1998,” Jason Williams, global market strategist at Citigroup, wrote in a note. This cycle “could be more akin to the 1998 easing cycle, which was short-lived and led to more rate hikes. If inflation does not return to a consistent 2% the upside tails around future Fed hikes should increase from this very depressed level.”
… NOT typo, read Bloomberg below and lets just skip ahead TO a few more things ahead of the holiday long weekend ahead and to begin … here is a snapshot OF USTs as of 705a:
… HEREis what this shop says be behind the price action overnight…
… WHILE YOU SLEPT Treasuries are lower while the curve is mixed after a big beat in UK retail sales while sources (link above) suggest that the BOJ is still on track to exit NIRP despite Japan being in a technical recession. DXY is little changed while front WTI futures are lower (-0.75%). Asian stocks were higher, EU and UK share markets are higher (SX5E +0.6%) while ES futures are showing +0.2% here at 7am. Our overnight US rates flows saw Treasuries trade lower from Asia's opening with modest buying in intermediates seen on our Tokyo desk amid light volumes. A similar story during London's AM hours with the desk flagging a light volume drift lower in Tsy prices with none of the real$ dip buyers evident ahead of PPI and a long weekend here. Overnight Treasury volume was ~80% of average overall but decent in 2yrs (133%).
… Our first attachment was going to show the well-defined, 50bp range (3.80% to 4.30%) in Treasury 5's but instead we begin with an updated look at the medium-term, weekly chart of the 1y1y rate. We dithered over whether to post this or the weekly picture of the 2y1y rate, but the messages gleaned were the same: there is no evidence yet that the bear phase in bonds that began ~ December 28th has run its full course yet. Moving on to ranges and regimes...
… and for some MORE of the news you might be able to use…
NEWSQUAWK: US Market Open: Equities firmer & NQ leads after strong AMAT earnings, Yen underperforms and Bonds lower; US PPI due … Bonds are subdued, largely led by the higher-than-expected UK Retail Sales print, as attention turns to US PPI/Fed speak
Finviz (for everything else I might have overlooked …)
Moving from some of the news to some of THE VIEWS you might be able to use… here’s SOME of what Global Wall St is sayin’ …
BAMLs RIC Report: Diamonds in the rough (notes on the ‘flation and on the TLT losin money …)
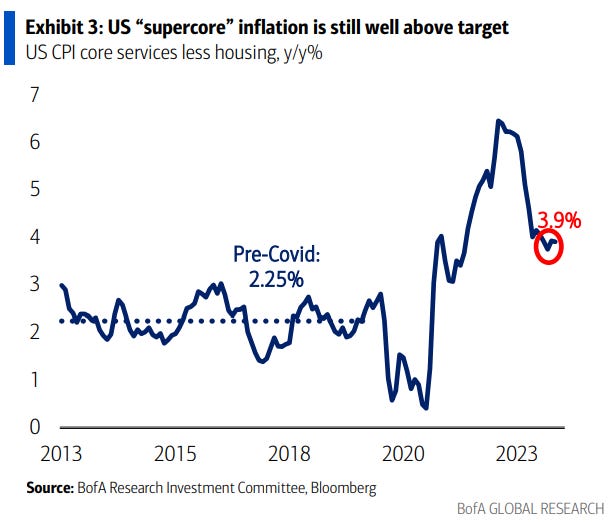
… Claudio Irigoyen warns that inflation could reaccelerate if nominal spending and labor markets remain robust. Markets are underpricing inflation risks and could be anticipating too many Fed cuts this year. US core CPI excluding housing (“supercore”) is still running close to 4%/year, nearly double its pre-COVID pace (Exhibit 3)
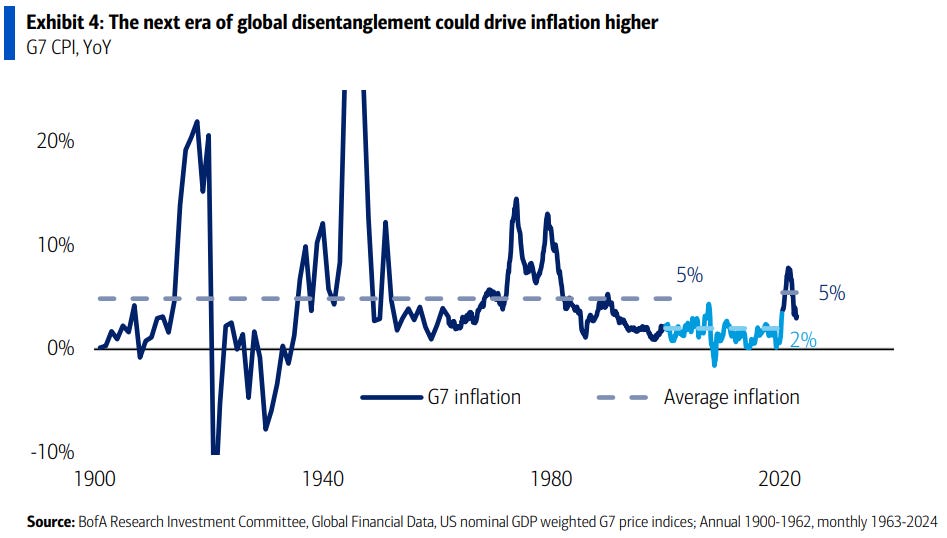
… Past 20 years suggests disinflation, but the past 100 warrants caution G7 CPI has decelerated to 3% year-over-year, after rising at the fastest clip in four decades (Exhibit 4). Inflation surges are not uncommon in history and the past 20 years of low inflation, yields, and policy rates is not the historical norm…
…Treasuries are still just for trading Structurally higher yields and inflation make government bonds less attractive. TLT, the largest government bond ETF, has lost money this year and is down >12% since 2019 (Exhibit 5).
January retail sales dulled some of the luster of consumer spending, with sales retrenching in January following strong holiday sales. Although today's incoming data and revisions detract from the stellar PCE numbers at the tail-end of 2023, on the whole, spending seems on track for another solid gain in Q1.
Risk markets are eyeing a massive pile of cash that has built up on household balance sheets, but we think the majority of it stays put for the time being. Yields on cash remain historically attractive vs. equities and IG credit and should keep liquid allocations high, particularly with the first Fed cut getting pushed out.
ETFs continue to grow rapidly, with their share of total municipal fund assets doubling in the last five years. Corporate ETFs have grown to about 25% of the overall corporate fund universe; with muni ETFs comprising only 12% of the muni fund universe, there is plenty of room for growth for this portfolio product.
Too hot: The takeaway from the year’s first six weeks is that US economic data is running too hot. Too hot for six Fed rate cuts, but also too hot for a bearish narrative on SPX earnings. In our 2024 outlook, we noted an inconsistency between the macro consensus for a slowdown in nominal GDP versus analysts bottom-up forecasting an earnings reacceleration. 2024 EPS forecasts are edging lower, but the gap is more significantly being closed by the hot data. The macro data in Q1 looks consistent with high-single-digit earnings growth, and the risk of a disorderly downgrade cycle is rapidly diminishing. Offsetting this bullish tailwind from strong data is the risk to valuations from the potential for higher rates.
We are restriking our year-end SPX forecast at 5150, this is not supposed to represent a bullish view on equities. The implied return from 5150 versus current spot is less than the risk-free rate. This is also an estimate of a modally most probable outcome, rather than a reflection of a fair value. We see still see the right tail of the distribution as much narrower than the left. Rates seem likely to provide a counterweight to hotter data on the upside. Continued strength in the data is fundamentally bullish, but leaves less room for Fed cuts. Equity valuations are stretched (SPX PE is at 20.4x 83rd percentile in 30 years). Relative to rates, the SPX EY-10y bond yield spread is at two-decade lows. Positioning in US equities remains elevated with our US EPI at 79.8 (page 6). As such, we see very low levels of volatility and flat skew leaving the market looking complacent to downside risks.
DB: Early Morning Reid (on rates reflex TO data yest on into o/n…)
… On the rates side, we initially saw a sizeable rally on the back of the US releases, as December 2024 Fed funds futures fell by 8bps, but this move reversed by the end of the trading session, with the amount of cuts expected by the December meeting unchanged on the day. Fed fund futures have given up another 10bps of 2024 cuts overnight, after Atlanta Fed Governor Bostic said he was “not yet comfortable that inflation is inexorably declining to our 2% objective”, suggesting it may take “some time” for this rate-cut condition to be met. As we go to print ECB Villeroy (slight dove) has just been quoted as saying that the "risk of cutting too late at least as big as too early".
10yr Treasury yields fell by c. 3pbs immediately after the data, trading almost 7bps lower on the day, but retraced much of the decline to finish the day down -2.5bps at 4.23%, while 2yr yields were down -0.4bps, having traded -8bps down early on. This backdrop saw the broad dollar index decline for the second day in a row (-0.41%) after its three-month high on Tuesday. Overnight, yields have edged back higher with 10yr and 2yr yields both c.+2.5bps to trade at 4.255% and 4.60% respectively…
Goldilocks: Retail Sales Fall Sharply; Philadelphia and Empire Manufacturing Both Above Expectations; Import Prices Increase Above Expectations; Initial Claims Decline
BOTTOM LINE: Core retail sales fell 0.4% in January and the level was revised down by 0.44% in December. Severe winter weather likely weighed on January spending at the margin, however it is not a plausible explanation for the sharp drop in ecommerce spending. Both the Philadelphia Fed and Empire manufacturing indexes increased by more than expected in February. The composition of both reports was strong on net, with increases in the new orders and shipment components and mixed employment components. We nudged up our January core PCE inflation estimate by 0.01pp to 0.35% (mom sa). Initial jobless claims declined and remain at a low level.
Goldilocks: USA: Industrial Production Below Expectations; NAHB Housing Index, Business Inventories Increase; Lowering Q1 GDP Tracking to +2.5%
BOTTOM LINE: Industrial production decreased by 0.1% in January and manufacturing production decreased by 0.5%, both below expectations. The NAHB housing market index increased in February, above consensus expectations for a smaller increase. Business inventories increased in December, directly in line with consensus expectations, and the November growth rate was unchanged. Utilities production rose sharply reflecting severe cold weather, implying a boost to utilities consumption that will offset some of the retail spending weakness. We lowered our Q1 GDP tracking estimate by 0.4pp to +2.5% (qoq ar) and lowered our past-quarter GDP tracking for Q4 by 0.3pp to +3.2%, compared to +3.3% as previously reported. Our domestic final sales forecast for Q1 stands at +2.8% (qoq ar).
New forecast reflects a bit more momentum than earlier assumed
With a stronger start to inflation this year, we are delaying first cut from May to June
We are also taking the opportunity to scale back on the expected size of cuts this year to 25bps from 50bps as growth has held up (for now) more than we expected
We now expect 25bp rate cuts in June, July, September, November, and December before stepping up the size of cuts to 50bps at both the January and March 2025 meetings to stem rising unemployment and a mild recession
Retail sales fall sharply in January Retail and food services sales fell 0.8% in January, below our (0.3%) and consensus expectations (-0.2%). Previous months were revised down a cumulative 0.5%, adding to the sense of weakness and leaving a much soggier contour for consumer goods spending in place than was previously in the data. Sales at the control group of stores dropped 0.4%, well below our (+0.7%) expectations and consensus (+0.2%)…
US producer price inflation is due. This does not have the political importance of consumer price data. It matters because most companies sell to other companies (not end-consumers). It is also mercifully free of the fiction of owners’ equivalent rent. However, producer prices do not tend to capture profit-led inflation, which hits at the end of supply chains.
US Michigan consumer sentiment data offers entertainment, not substance, providing the breakdown of Republican and Democrat sentiment. Political polarization in surveys is likely to increase as November approaches. Anyone who thinks business sentiment surveys are impartial is advised to look at the comments on the Dallas Fed’s manufacturing survey. If inflation perceptions fall, this might boost Democrat sentiment, but it is unlikely to shift Republican sentiment…
Wells Fargo: January Retail Sales Suggest Some Lost Momentum
Summary The broad-based drop in January retail sales suggests the consumer lost some momentum at the start of the year. Yet, a strong gain in food services sales implies services consumption remains sturdy and likely offset some weakness in goods consumption.
Yardeni: It Was Cold In January, But Spring Is Coming!
Retail sales fell 0.8% m/m in January, much weaker than expected (chart). Leading the way down was a 4.1% drop in building materials & garden equipment & supplies.
Following the release of January's employment report, we anticipated some weakness in retail sales because the 0.2% increase in payrolls was offset by an odd 0.6% drop in average weekly hours (chart).
Also weak during January was manufacturing production, down 0.5% (chart). On the other hand, utility output jumped 6.0% m/m last month! Here on Long Island, January was mild. But it must have been very wintery in the rest of the country.
Output of electric and gas utilities is seasonally adjusted, but tends to spike during the winter months when the weather is worse than usual (chart). That's what it did in January of this year. That would explain some of the weakness in January's economic indicators.
Now for some good news: Initial unemployment claims edged down to 212,000 during the February 9 week (chart). This suggests that the unemployment rate remained below 4.0% for the past 25 months! Inflation has turned out to be transitory, while the jobless rate has remained persistently below 4.0%.
… And from Global Wall Street inbox TO the WWW,
Bloomberg: $10 Million Options Wager Targets 4.55% 10-Year Yield in 3 Weeks (fwiw, these specific options just expire 2 days after March 20 FOMC…)
By Edward Bolingbroke (Bloomberg) -- Late action in weekly Treasury options included a large downside position via a single screen trade, targeting an increase in 10-year yield to around 4.55% ahead of March 8 expiry. * In one clip, 33,771 US 10-year Week 2 110.00/108.50 put spread was bought at 20, says US trader * Position targets a rise of around 33bp in 10-year yields from current levels over next three weeks; open interest in the strikes as of Wednesday’s close was 16,020 (108.50) and 242 (110.00), suggesting the position is new risk hedging higher yields * Bearish option-buying was a theme of Thursday’s US session, with heightened activity seen in the April 5- and 10-year tenors, targeting 10-year yields exceeding 4.50% * Traders Target 10-Year Treasury Yields to Soar in Options Market
Try and Keep Up Narratives change pretty quickly when traders have their eyes trained on every incremental data point. Case in point: rate hikes are back in the conversation.
Citigroup Inc. said this week that markets would be wise to start hedging for the possibility that the Federal Reserve reverts back to raising rates after a brief easing cycle.
“The market should price in some risk of future hikes – look to 1998,” Jason Williams, global market strategist at Citigroup, wrote in a note. This cycle “could be more akin to the 1998 easing cycle, which was short-lived and led to more rate hikes. If inflation does not return to a consistent 2% the upside tails around future Fed hikes should increase from this very depressed level.”
As detailed by Bloomberg’s Liz McCormick, the Fed unleashed three rapid-fire rate cuts in 1998 to contain the fallout from Long Term Capital Management’s failure and the Russian debt default. Policymakers then returned to rate increases in June 1999 to stifle price pressures.
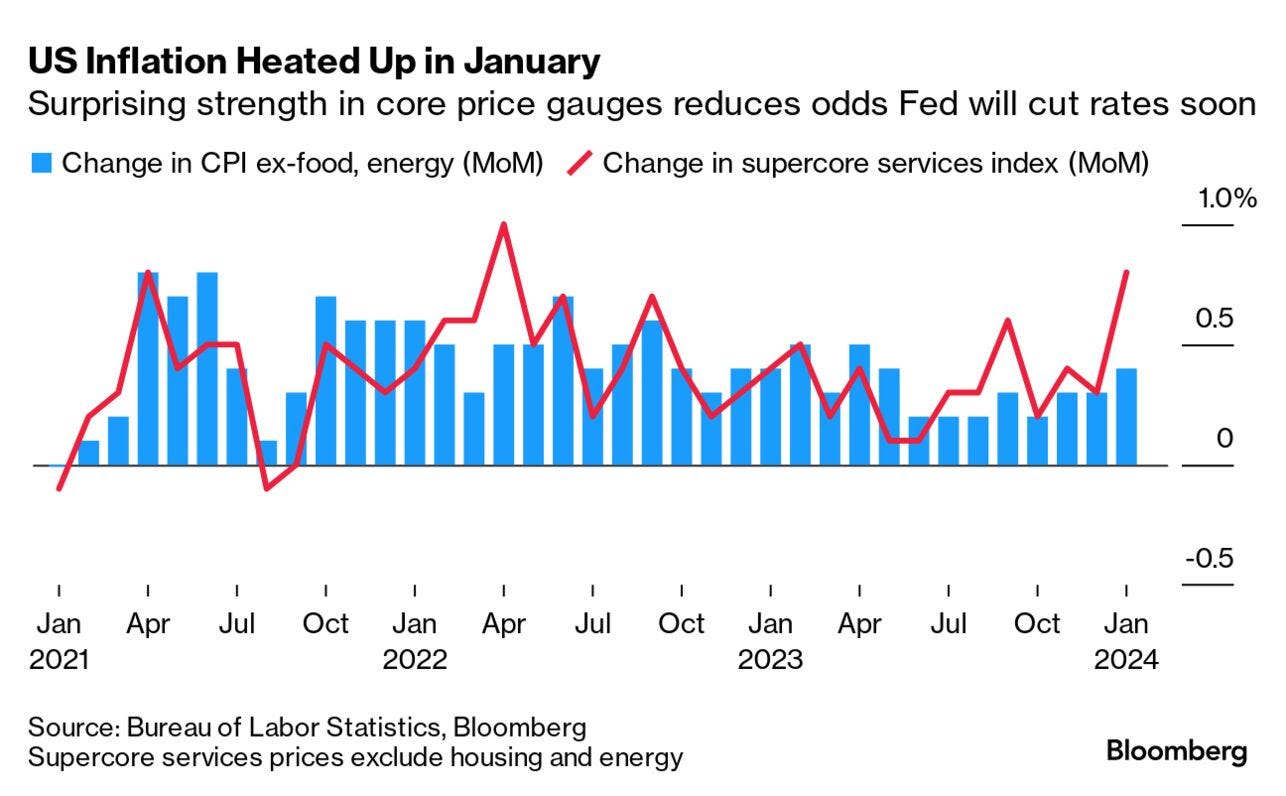
Interestingly, Citi’s Williams published his thesis a day before the release of January’s inflation report, which showed that both the headline and core consumer price index rose by more than forecast last month. While a weaker-than-expected January retail sales print gave some comfort to bond bulls on Thursday, traders have pushed out their bets on the Fed’s first cut.
In the aftermath of the print, Kit Juckes of Societe Generale took it a step further than Citi. The chief FX strategist said that the Fed’s next move could actually be a hike rather than a cut, given that more than 500 basis points of tightening since 2022 has down little to cool the US economy.
“If the US economy reaccelerates, the Fed will eventually have to tighten again and the dollar will rally,” Juckes wrote in a note to clients…
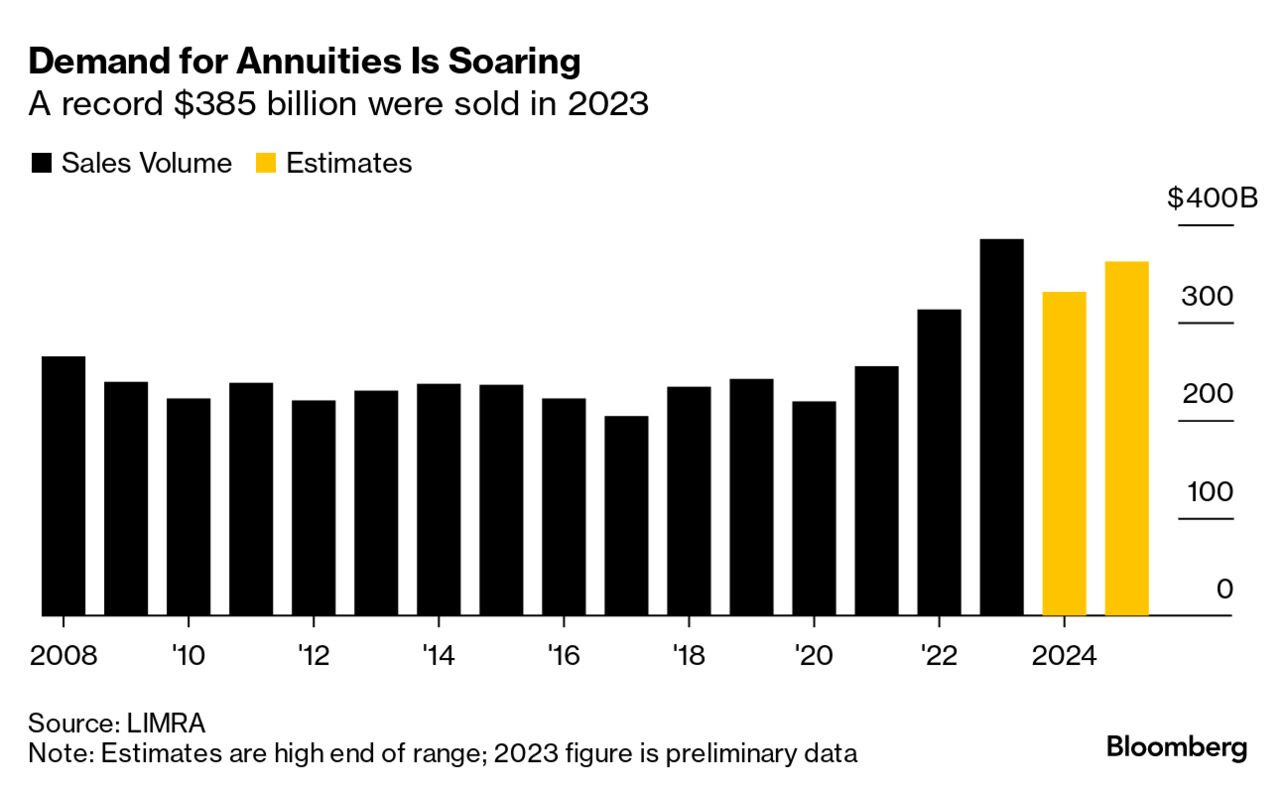
…Insatiable Life Insurers Want to know who’s snapping up a seemingly endless flood of blue-chip bonds? Look no further than life insurers.
Sales of annuities reached a record high of $385 billion in 2023, according to life insurance trade group Limra. As reported by Bloomberg’s Olivia Raimonde and Alicia Clanton, that’s up 23% from the year before.
That appetite is helping to power demand for credit and commercial mortgage bonds, as the life insurers who sell annuities are buying bonds for income purposes. As detailed previously by this newsletter, Bank of America expects that February could bring up to $170 billion in new issues (a wave which Moody’s Investors Service and S&P Global Inc. expects to lose steam by year-end).
“Current drivers of credit demand are retail and pension seeking higher all-in yields, and annuity sales driven by more baby boomers retiring and by a higher level of interest rates giving policyholders higher monthly payments,” Torsten Slok, chief economist at Apollo Global Management, wrote in a note.
Limra estimates that annuity sales could total as much as $693 billion over the next two years. While this year’s forecast of up to $331 billion in sales this year would be a decline from 2023, that level would still have been a record in 2022.
Bloomberg(via ZH): Yield-Curve Bear-Steepening Spells Trouble For Markets
… Specifically a bear steepening – longer-term yields rising more than shorter-term ones – will indicate that liquidity and money velocity are in jeopardy from rising government interest payments, and that funding markets are approaching the point where reserves could shift from abundant to scarce abruptly.
Both will imperil risk assets…
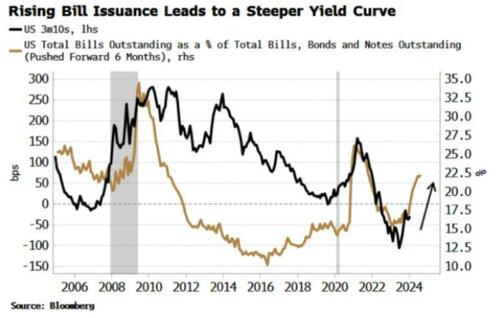
…The Yellen pivot is expected to continue for now. That means the yield curve should resume steepening. A rise in bill issuance would typically be expected to lead to a flatter yield curve as yields at the front-end rise, but that’s not what we observe. As can be seen in the chart below, rising bill issuance tends to lead to a steeper curve.
How so? Well, if bill demand is elastic, then rising issuance has little impact on the yield, while the increased short-term supply pulls demand away from longer-term tenors, and the curve steepens.
That outlook neatly tallies with the message from other leading indicators of the yield curve, such as excess liquidity. It’s also what most still currently expect. But what type of steepening we get matters greatly.
The curve has been bear steepening lately, and if inflation comes back on to the scene as I expect it to — and as this week’s CPI data hints it might already be doing — such steepening is likely to persist.
That’s bad news for markets, however. Rising longer-term yields will further swell the government’s already ballooning interest bill.
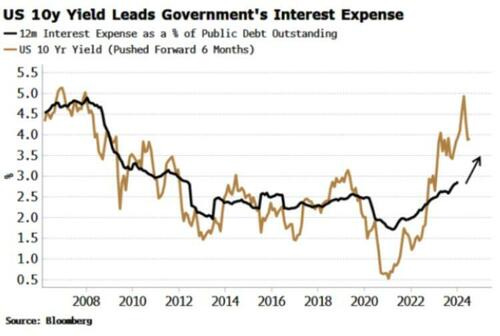
The 10-year yield does an excellent job of leading the US’s interest expense as a proportion of its debt outstanding.
Rising interest payments destabilize liquidity by reducing reserve velocity. Not so fast, you might say, as most interest is paid to the public and thus the proceeds continue to circulate in the economy. But only the household and corporate sectors are likely spend the interest remitted to them — yet they are the smallest holders of Treasuries, accounting for only about 10% of the issuance outstanding.
Financials, the biggest owners, are more likely to reinvest interest paid to them in financial assets. The money to pay the interest, which comes from tax payments or more borrowing, is met with bank deposits. The net result is that the reserves are still in the system, but they are held by savers with a lower propensity to spend, and so their velocity falls.
The relationship in the chart above projects the annual interest expense could be as high as $1.4 trillion (from $980 billion currently) within six months, based on where 10-year yields are.
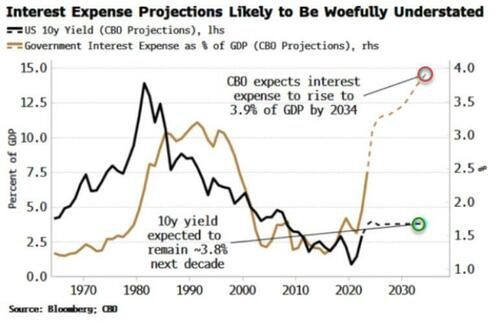
That’s less than the Congressional Budget Office’s latest projections. It sees it at $1 trillion in 2026 and $1.6 trillion in 2034, or 3.9% of GDP. But take these numbers with a clump of salt. Shown in the chart below along with the CBO’s interest projections is its forecast of the 10-year yield over the next decade. Readers can decide for themselves if they think its projections are realistic, and thus the likelihood the interest bill could be much higher than the CBO’s predictions.
That’s already a terrible backdrop for risk assets. And there’s more bad news. The Treasury’s bill issuance is increasing the likelihood of a flare-up in funding markets, by keeping bill yields attractive enough for MMFs to carry on drawing down the RRP.
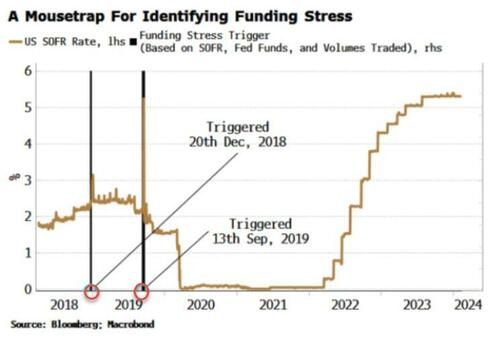
While this was beneficial for risk assets last year, as quantitative tightening continues and the so-called lowest comfortable level of reserves (LCLOR) is approached, it means we are nearing the “event horizon” in funding markets, where reserves can go from abundant to scarce in a heartbeat…
… Encapsulating this is the Funding Stress Trigger (explained here), designed to go off ahead of a sharp rise in funding rates that will destabilize risk assets if left unchecked.
This year will thus see a delicate interplay between three things:
by how much higher yields absorb liquidity from the system;
how much liquidity they attract from the RRP; and
when total reserves in the system are about to become scarce.
The time horizons these operate over are different: the effect on liquidity from rising interest payments will happen over a period of weeks and months, while the impact from bill issuance and the RRP can be almost immediate.
… The steepening thus indicates a weaker liquidity backdrop and a funding market closing in on levels of reserves that could abruptly trigger funding stress, neither of which are supportive of risk assets.
So: park the yield curve as a recession tool, and if you’re long risk assets, pray it doesn’t continue to bear steepen.
ING: Weak start to the year for US retail sales and manufacturing
January retail sales and manufacturing output were quite a lot weaker than expected, but we are coming off strong levels after upside surprises in late 2023. The outlook remains one of a slowing growth story as high borrowing costs, tight credit conditions and reduced support from pandemic-era accrued savings create a more challenging environment
LPL: Interest Rates and Potential Impact on Equities
Key Takeaways
The repricing of rate cuts further out on the calendar has pushed 10-year Treasury yields higher. Technically, the next major area of overhead resistance area sets up at the 4.35% – 4.40% range.
Higher yields captured most of the blame for Tuesday’s equity market decline. However, it is not all bad news. Market expectations and Federal Reserve (Fed) monetary policy projections have become closer aligned, alleviating a source of market volatility. Furthermore, better-than-expected economic data has been a driving force of the market’s repricing of rate cuts, reducing the likelihood of a hard-landing scenario.
If yields continue higher, defensive sectors and international equity markets could notice a deterioration in relative strength, as they have been the most negatively correlated to 10-year yields over the last year. In contrast, these areas of the market could also witness an uptick in relative performance if yields pull back from their recent highs.
… How High Will They Go?
…Summary Rising Treasury yields have recently run into a key area of overhead resistance. A breakout above the 4.35–4.40% range would not only be technically significant but also create headwinds for the broader equity market. If yields continue higher, defensive sectors and international equity markets could notice a deterioration in relative strength, and vice versa if yields pull back. Overall, starting yields for many fixed income markets are still at levels last seen over a decade ago, and LPL Research views the return prospects for fixed income as favorable and maintains its 3.75% to 4.25% year-end 2024 target for the 10-year Treasury yield.
McClellan: Taxes Will Bite the Stock Market - Chart In Focus
… If 2024 brings a combination of rapidly rising tax collections and a slowing economy, then this tax receipts to GDP ratio could quickly jump up close to that 18% threshold, making things much more difficult for the stock market.
WolfST: It Sucks Being a Retailer in January and February. But Do Retail Sales Show Consumers Cut Back?
Hope to have something more over weekend perhaps including updated weekly (likely STILL more bearish) chart update but … THAT is all for now. Off to the day job…


this weekend will have to revert back to following along WEEKLY (bearish) charts and watching 30s above 4.42% (Oct 2022 cheaps) would be bad IMO
Citi hedging, maybe that guy at Santander isnt so crazy