Good morning … since it worked for ME yesterday and there’s been little overnight to highlight …
… As we continue to draw closer to the Easter holiday, it remained quiet in markets yesterday other than for a sizeable late sell-off in US equities which came a bit out of the blue. Markets have been a bit thin this week so that might have contributed as we await the main event at 12.30pm London time on Friday when I’ll be driving through the French countryside, and you may be having a well-deserved piece of Easter chocolate! That will, of course, be the much anticipated core PCE print… -Jim Reid of DB
… As far as the mysterious selloff in stonks, I’ll lean on what little I could glean from ZH in a moment but for now, as the holiday shortened week is just about half over, we’ve got final installment of UST supply for the month and quarter, in a few hours and so here’s how I’m lookin’ at 7s …
7yy DAILY: I’m watchin’ triangulating range (4.40 / 4.15) but am NOT seeing anything from momentum which then makes a ‘go with’ trade much harder to, well, go with …
7yy WEEKLY: zoomin’ out a touch and momentum does look to be stretching up into overSOLD territory — not yet screaming BUY BUY BUY but perhaps by weeks / months / QTRS end we’ll have something to talk ‘bout …
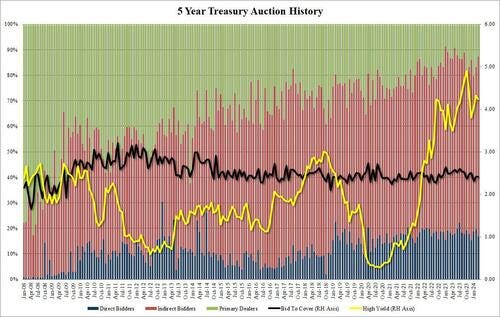
… AND then there was the 5yy auction offering some HOPE (not a strategy) …
ZH: Stellar Demand For 5Y TSY Auction Despite Record $67BN For Sale To Fund Gargantuan Budget Deficit
… The Bid to Cover was 2.41, identical to last month and just below the recent auction average of 2.43.
The internals were especially strong with Indirects surging to a 2024 high of 70.45% from 63.53% last month, and far above the 65.5% recent average. And with Directs awarded 16.8%, just below the recent average of 18.0%, Dealers were left holding just 12.8%, the lowest since June 2023.
Overall, this was a remarkably strong auction which was especially notable since it was also the biggest 5Y auction on record, with yields sliding across the curve after news of the auction pricing hit...
... and indicates that there is a growing disconnect between supply (surging) and demand (also surging) which will continue until one day there is a violent repricing as demand finally pulls back from the infinitely growing supply at which point it will be game over for the western financial system. Until then, just BTFD if you can find any D that is...
… AND
ZH: Durable Goods Orders Rebound In Feb From January Collapse, Defense Spending Slides
ZH: US Home Prices Rose For 12th Straight Month In January, Despite Soaring Rates
ZH: Conference Board Consumer Confidence Slides, Revised Down For 5th Straight Month
… all told, as ZH my only remaining source to the inside of a BBG Terminal (for better or worse!) …
ZH: Stocks Drop As 'Soft' Data Slumps, Trump's 'Wealth' Pumps'n'Dumps
… The longer-end of the bond curve outperformed today (with the short-end modestly higher in yield) with 30Y -2bps on the day, helped by a strong 5Y (record size) auction. The stronger than expected durable goods orders print snapped yields to yesterday's highs but the soft-date weakness (and the auction) wore yields lower as the day went on...
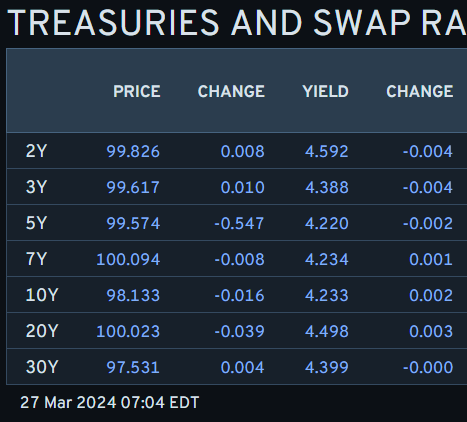
… and so, in this ‘mysterious’ and outta the blue selloff there seems to have been something for everyone. Moving right along then … here is a snapshot OF USTs as of 704a:
… HEREis what this shop says be behind the price action overnight…
… WHILE YOU SLEPT Treasuries are little changed with all eyes on the BOJ after the yen closed at 152, a 34-year low. DXY is UNCHD though while front WTI futures are lower (-0.6%). Asian stocks saw a drop in Chinese share markets but mixed outcomes elsewhere, EU and UK share markets are mixed while ES futures are showing here at 6:30am. Our overnight US rates flows saw a very quiet session marked by 2-way activity: buying in intermediates versus selling from systematic names. Overnight Treasury volume was ~70% of average with 2yrs (31%) a standout for their notably weak average volume this morning…
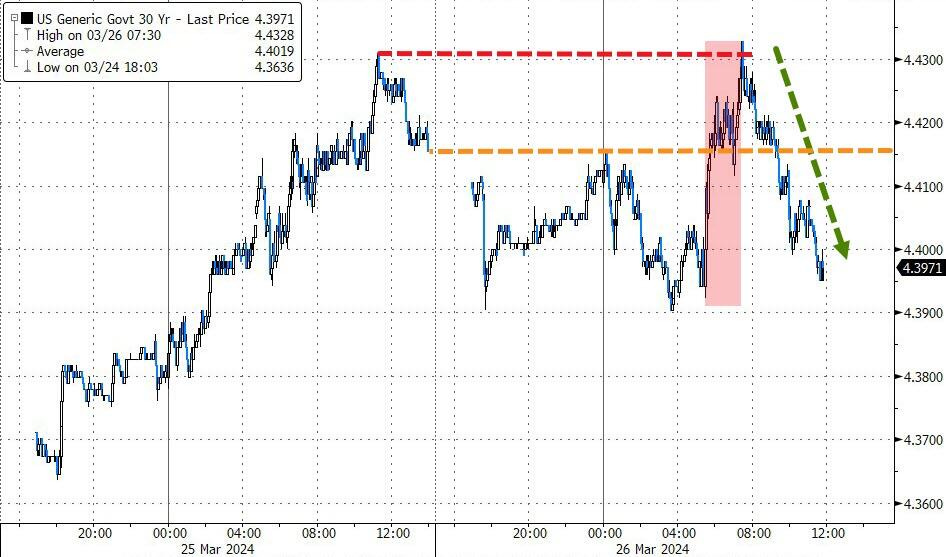
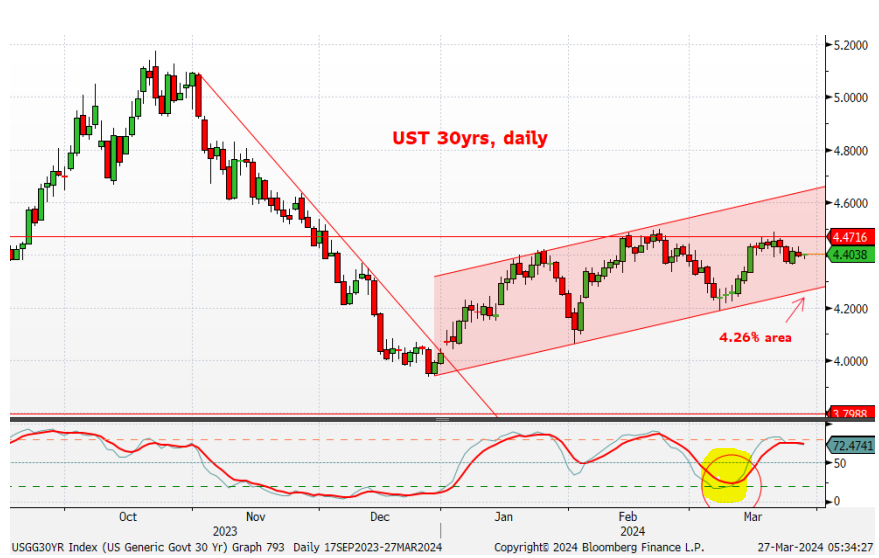
… Now benchmark Treasury yields remain in well-defined ranges/channels, with many of the related charts looking like this morning's first attachment of Treasury 30yrs.
… and for some MORE of the news you might be able to use…
IGMs Press Picks: March 27 2024 (point this one out to JPOW and Co…)
Globe and Mail: Out of nowhere, commodities are on a run: U.S. crude oil is trading well over US$80 a barrel, gold bullion has shot up to record highs and a variety of other resources have caught the updraft.
NEWSQUAWK: US Market Open: Equities firmer, JPY bid after a BoJ/MoF/FSA meeting and Crude lower; Fed's Waller due … Bonds mixed though price action has been contained; Bunds rose incrementally on Spanish CPI, upside which proved fleeting
DB: Early Morning Reid (continuing from above but on RATES…)
… Government bonds have had a more difficult quarter but lacked a bit of direction yesterday. Yields rose a bit after decent durable goods data but fell back to broadly flat after a decent 5yr auction. $67bn was issued 1.0bps below the pre-sale yield, so it was a fairly solid auction, even as the indirect bidder share fell to 70.5%. The auctions for this week are far from over, as we have the US 2yr FRN ($28bn) and 7yr Notes ($43bn) auctions coming up later today. 10yr yields eventually fell -1.3bps on the day. 2yr Treasuries outperformed, with yields down -3.3bps. Markets slightly dialled back expectations of Fed cuts, trimming rate cut bets for 2024 by -1.4bps to 78bps…
Much is made of what the yield curve predicts for the real economy – and how it has been unusually misleading in this cycle. Much less is spoken about how the economy first leads/drives the yield curve, i.e., a stronger economy flattens the curve, before the correlation shifts and a flatter curve leads (by up to 2 years) and is associated with a future weaker economy.
Figure 1 above highlights the first part of the relationship: the labor market's (Conference Board jobs hard to get minus plentiful) relationship with the curve, with a coincident correlation of 79% for monthly data since 1985. The data fits with the ideas that …
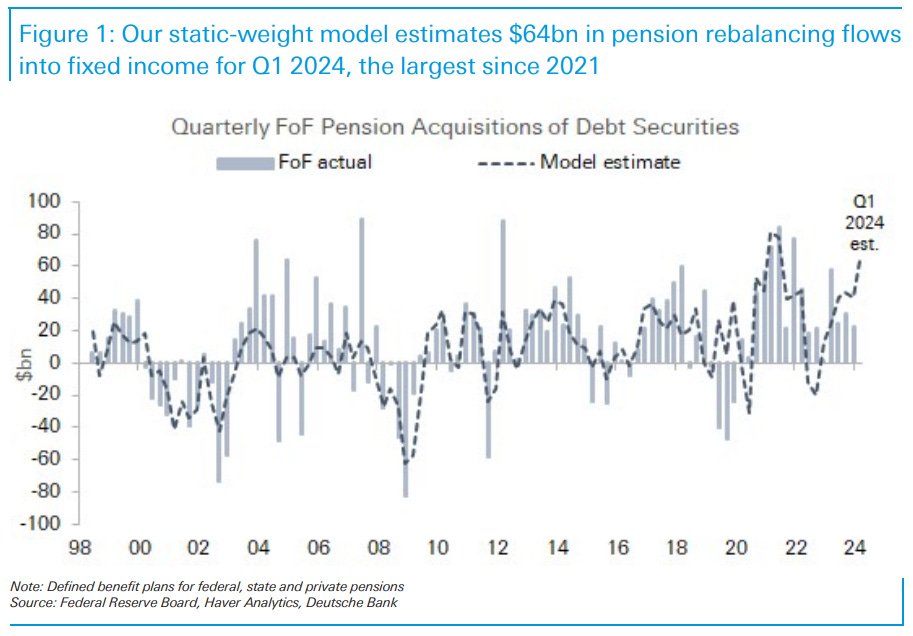
DB: Mind the pension flows for quarter-end (month/qtr end flows to be aware of…)
A historical run-up in equity prices over the past quarter creates robust pension rebalancing needs for Q1, with potential for large long-end buying flows materializing over the upcoming March quarter end. Our static-weight pension rebalancing model estimates $64 billion in total fixed income purchases for the current quarter from private and public defined benefit plans. This is nearly 60% larger than our model estimated for Q4 2023, which saw $22bn in reporting flows, and the largest since 2021.
Stripping of Treasury bonds, a reliable indicator of pensions' duration demand and a component of our model, shows that activity on a 3-month average basis has been running at the fastest pace on record. Despite this, the underperformance in 30y swap spreads since the beginning of this year suggests pension underinvestment in the long end, possibly out of concerns over a more hawkish Fed narrative and yields moving higher.
With the March FOMC meeting out of the way and the Fed reaffirming its 2024 rate cut bias, pensions seem primed to jump back in. Since last week, bond spreads have widened sharply, suggesting active pension buying in the long end. We anticipate additional pension flows to emerge over the holiday-shortened week, which should help richen valuations in the long end. We keep our 30y spread widener (targeting -65 bps) and recommend entering tactical long-end flatteners ahead of the quarter-end.
DB: Debt stability: Role of inflation is inflated, term premium is paramount
Last week, the Congressional Budget Office (CBO) released its latest update on the long-term fiscal outlook in the US (see here). Consistent with previous versions of this report, the CBO continues to expect budget deficits to run at historically elevated levels over the coming decades, leading to a continued march higher in the US debt-to-GDP ratio. In this note, we present a framework for considering the stability of US debt-to-GDP over time.
Building on our work from 2021 (see “Some pleasant fiscal arithmetic”), which was based on analysis in the 2013 USMPF paper, we derive a debt stability condition that is the sum of two terms: the extent of inflation surprises and a measure of the liquidity or safety premia embedded at different parts of the yield curve. We then show empirical estimates for these components and assess the levels of budget deficits that could reasonably achieve debt stability.
The most recent values for the debt stability conditions imply a steady state budget deficit of 2.4% of GDP. Even under the most favorable historical conditions, which are consistent with recent record lows in term premia and "other determinants" of r-star, the steady state budget deficit-to-GDP ratio would be 4.1%, well below the 5-6% budget deficits projected by the CBO over the next decade. With higher debt loads likely to eventually raise term premia over time, absent policy changes, it is difficult to foresee conditions emerging that would be consistent with stable debt ratios in the US.
JPM: US Treasury Market Daily (from yest ahead of 5s BUT inclusive of quarter end rebal flows / potential)
… Away from today’s developments, we turn our attention to potential quarter-end rebalancing flows and their impact on the Treasury market. Importantly, equities have outperformed fixed income by 10.2% so far this quarter, on track for the fourth largest outperformance over the last decade (Figure 1Equites arontck uperfom ixedncom byrethan 10%this quarte…). This suggests room for some reallocation from equities into fixed income and indeed we find that yields tend to exhibit a modest tendency to decline around quarter-end, following periods of meaningful equity outperformance. Indeed, in 5 out of the 9 quarters when equities outperformed bonds by more than 5% over the last 5 years, 10-year Treasury yields declined in the 2 weeks leading up to quarter-end (Figure 2). Further, as the Figure also shows, yields tend to reverse those moves in the first week of the new quarter. Importantly, the bearish move following quarter-end is not particularly consistent, as it took place in only 4 out of those 9 occasions, and this average is skewed higher by a 27bp move in the first two weeks of 2022. Overall, all else being equal, we would expect a modest bullish impulse from rebalancing flows later this week, and this could be particularly meaningful given this week’s holiday-shortened trading calendar…
UBS (Donovan): Inflation and interest rates (he neglected to link TO the FRBNY PAPER — HERE — as well as note the same landing page of the FRBNY discusses another scenario where China property sector leads to LOWER FLATION … fair and balanced, right?)
… There are a few central bank speakers clustering around media microphones today, mainly from the European Central Bank. It is frankly difficult to even pretend to be excited about this prospect, so I am not going to try.
A paper from the New York Federal Reserve has highlighted an interesting question—does globalization raise or lower inflation? The paper suggests a push to increase manufacturing output in China may raise some prices (even as labor intensive product prices decline) because of the price consequences of China’s relatively inefficient consumption of commodities.
A gap between the Conference Board's present situation and expectations indexes continued in March. Richmond Fed data weakens.
The expectations index remains low, all things considered
… And from Global Wall Street inbox TO the WWW,
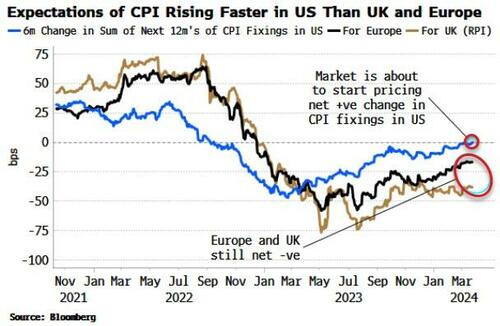
Bloomberg (via ZH): Priced-In Fed Rate-Cuts Are On Shakier Ground Than In UK And Europe
… As the chart below shows, inflation expectations are being marked up by more in the US than in the UK and Europe.
This comes when recession risks continue to recede in the US.
The Dallas Fed Manufacturing Index for March was just released, coming in weaker than expected. But the Fed regional indexes are quite useless individually as they are too volatile. However, we can improve the signal by looking at a diffusion of them.
When all of them are contracting it is not a bad recession indicator…
…As long as the data keeps coming in solidly, and inflation inches higher, the amount of cuts expected in the US – especially relative to the UK and Europe – is at risk.
Powell stated at last week’s Fed meeting a surprise weakening in unemployment would prompt them to cut rates, but net conditions are already very loose.
The market may end reversing its position of last year - where further hikes that were telegraphed prompted more cuts to be priced, given the expected damage to the economy – and instead see cuts telegraphed as a policy mistake, and price in subsequent rate hikes.
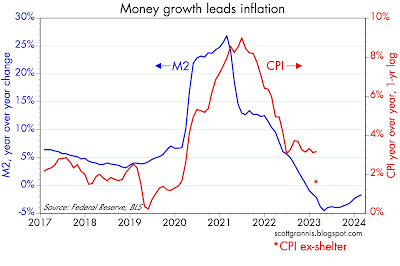
… M2 growth since early 2022 has been flat to negative, thanks in large part to the Fed's belated decision to jack up interest rates. Higher interest rates made M2 money more attractive, effectively neutralizing in large part the huge excess of M2 at the time. Although there is still some "excess" money according to this chart, it is not a source of inflation because interest rates remain high: extra money supply is countered by the extra demand for money that results from high interest rates.
Chart #3
Chart #3 illustrates how changes in M2 growth tend to precede changes in the CPI by about one year. That relationship appears to have broken down over the past 6-8 months, however. I think the reason for that is that the CPI is being overstated by the way the BLS calculates shelter costs. The red asterisk shows the year over year change in the CPI ex-shelter (1.8%) as of February '24; that's much more in line with the growth of M2. And it further suggests we have continued disinflation in the pipeline since shelter costs are almost surely going to decline over the next 6-8 months.
Chart #4
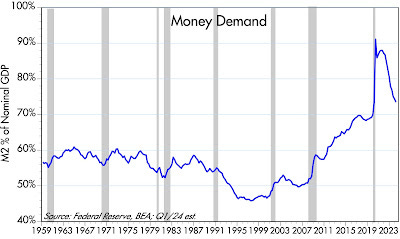
Chart #4 shows another way of calculating the demand for money. It is simply the ratio of M2 to nominal GDP. You can think of it as a measure of how much of one's annual income one wants to hold in the form of money (cash, and cash equivalents). Here it is easy to see the sudden and tremendous surge in money demand in the early months of the Covid crisis. Then, starting about a year later, we see money demand plunging. At the current rate it should return to pre-Covid levels over the next year or so. We're almost out of the Covid woods, in other words.
Many will call this a "soft landing" or "no-landing" scenario. Because it will be the first time the Fed has wrestled inflation down from uncomfortably high levels without also triggering a recession. And the reason for that is the Fed's "abundant reserves" policy, which avoids creating a shortage of liquidity in the banking system.
ING: Weakness in US investment keeps the focus on the consumer
Durable goods orders are a good lead indicator for broader capex spending in the US. Unfortunately, ongoing weakness here suggests investment spending will remain a constraint on overall growth with the US’ 2024 economic prospects being determined by the consumer
… Real Household Disposable Income ($bn) versus pre-Covid trend
ZH: PIMCO Pulls Back On US Treasury Exposure: Fears Inflation, Fiscal Folly
*I fail to understand (per ZH article) why EU rules upon Africa or wtf do/have to affect coco prices for us ALL. Do these EU policies reduce supply? Guess THEY really do plan on us eating bugs & lab grown meats, what replaces chocolate I wonder....


*Thanks for that NYFED report link :)!
*I fail to understand (per ZH article) why EU rules upon Africa or wtf do/have to affect coco prices for us ALL. Do these EU policies reduce supply? Guess THEY really do plan on us eating bugs & lab grown meats, what replaces chocolate I wonder....