BBG: SK Hynix’s Record Profit Misses Investors’ Lofty AI Expectations BBG: Korean Stocks See Record Wave of Trading Halts on Chip Selloff ZH: SK Hynix Stock Dumps On Actual Earnings Miss; Pumps On Promise Of “Explosive” Demand
… AND just a few pre FOMC thoughts …
Supply is done. All items at slight profits and now we wait for the FOMC decision and presser this afternoon. With this pre-FOMC vigil mindset sinking in, I’ll be real brief…
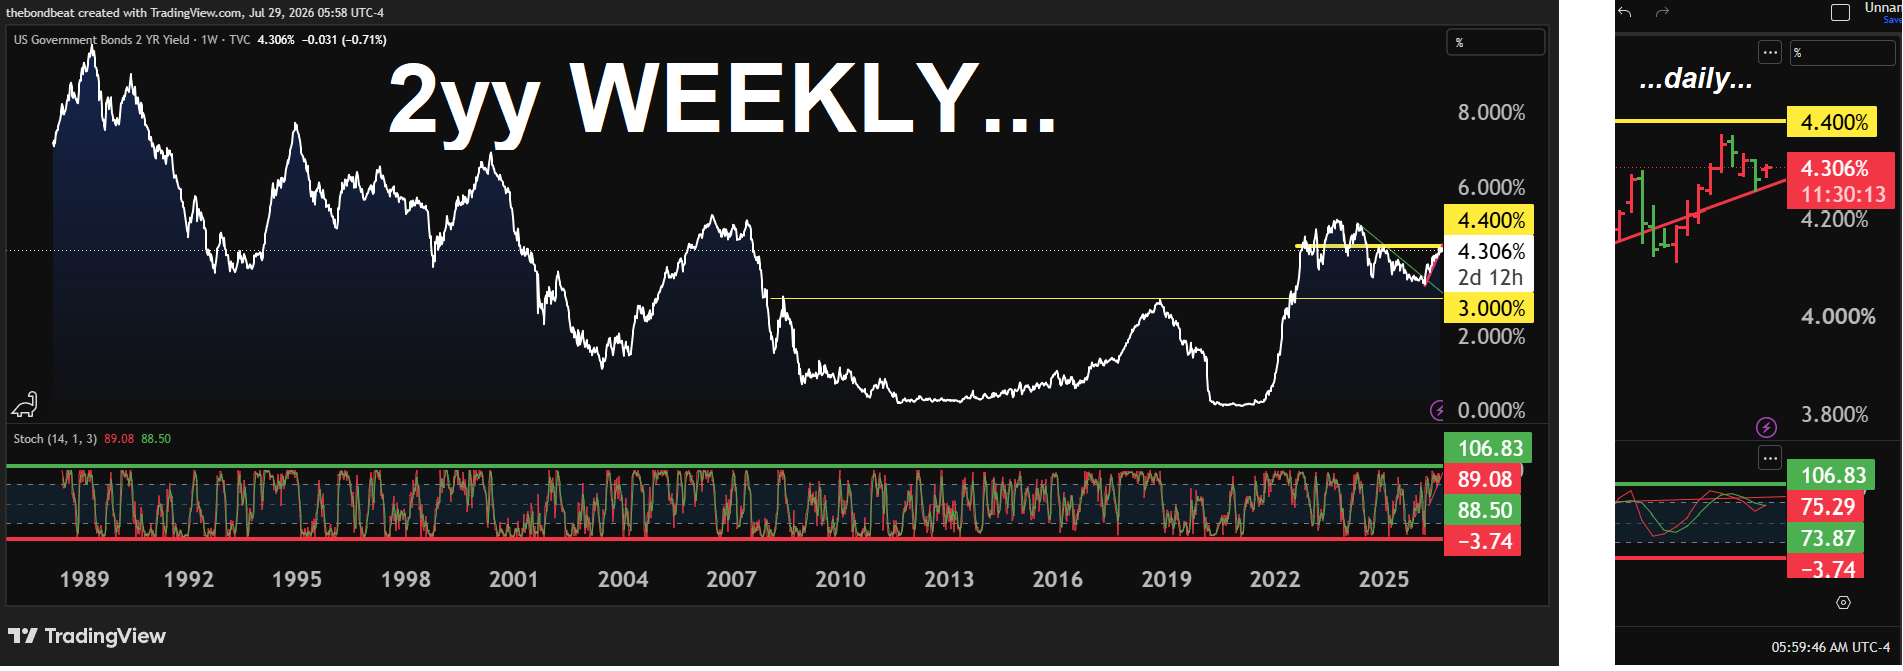
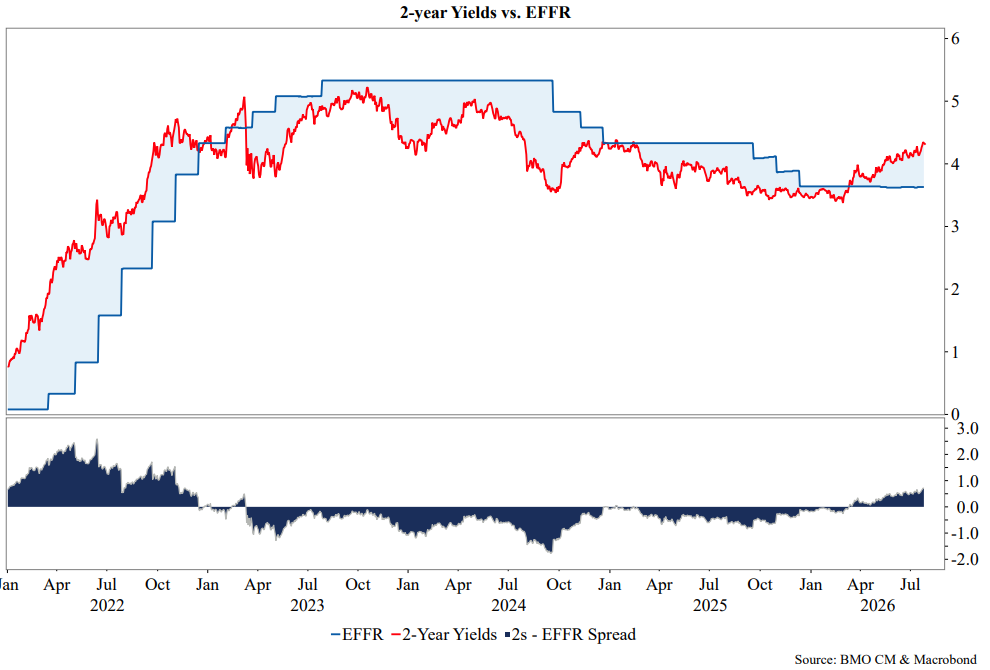
Polymarket (79% UNCH) vs CME FedWatch (68.5% UNCH) … I choose … Professor 2yr note (McClellan HERE…and more below from best in biz showing spread of 2s to FF … ). Suffice it to say, yields having marched higher ARE as get a metric as you’ll find showing Global Wall expectations and the putting of their money where their mouths are …
… momentum appears to be overSOLD as hikes priced, question is if we’ve sold the ‘rumor’ (enough) and will be buying the fact?
#Got2s? Wan’t ‘em ahead of a possible HAWKISH HOLD (my guess) and info overload??
As Citi describes it, we’re entering period of time likened to INFO OVERLOAD …
Citi Europe Open - All the moving parts Information overload as AI unwind meets Middle East flare-up into a live Fed decision. SK Hynix operating profit miss coupled with strong guidance triggers massive volatility with KOSPI sliding as much as 12% triggering another circuit breaker for a straight day…
…Rates: Treasuries trade steady with 10s hovering at 4.608% into the FOMC decision. Bigger moves seen in Australia rates where front end yields fall 8-9bps after Q2 inflation data showed a softening. Expectations for another RBA rate hike tempering after Gov. Bullock's speech on Tuesday also appeared moderately balanced. Traders have slashed bets on another hike to 50% from 90% before the report…
… and not that anyone asked or cares, but I am sympathetic to all arguments. Inventor of the MOVE index (Harley Bassman, below) says the Fed SHOULD HIKE (50bps) today and he offers some needed CONTEXT to this ‘call’ …
… I will say I can offer no economic support for a 50bp hike, rather I am looking solely at market psychology and politics…
… NOTED. I would think (hope, not a strategy) this Fed less political than previous ones but that likely more fantasy than reality.
Going on, though, and with my disagreement with HIKE for whatever reason, I’d tend to be MORE sympathetic to BMOs ON HOLD view (also below) …
…the logic holds that patience will outweigh any urgency to respond to the energy-driven inflation spike of March-May. We’re not suggesting that there won’t eventually be a case for higher rates – it just isn’t a foregone conclusion…
… That said, my apologies for clouding the waters even further this morning and I’ll stop.
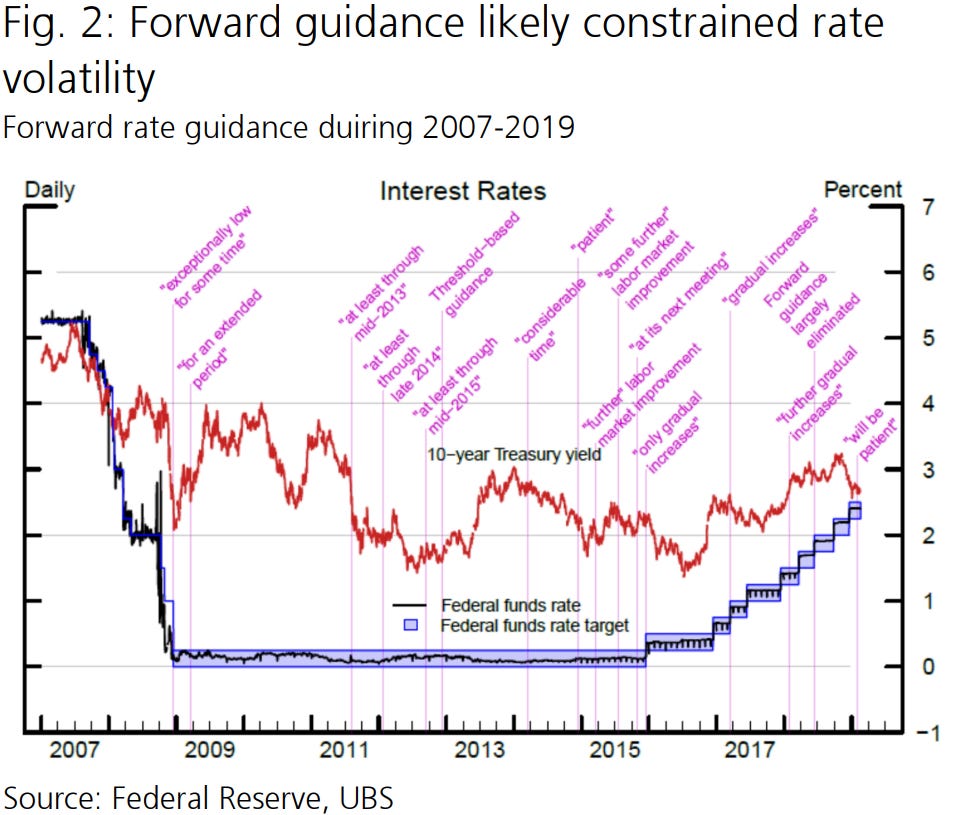
Fed on HOLD, to use central banker summer camp (Jackson Hole end of the summer) in a way unlike previous campers, given the desire to NOT offer any guidance. I still believe it will serve as a useful tool and will watch with great hopes for a signal … In other words, forward guidance now looks like …
As far as the data (and as if this matters) … think stag’flation hot take?
ZH: US Home Prices Unexpectedly Jumped In May; Chicago Leading, Vegas Lagging
ZH: Conference Board Survey Signals Ugly Job Market, Weakest 'Present Situation' In Over 5 Years
… Good luck to them. I’ll turn the keys over to The BondBot Intern and head outta the way …
HEADLINE: The Warsh Warning: Ignore the Rate Decision. Fear the Message.
Markets have reached peak summer hysteria. Every headline is treated like a five-alarm fire while the Treasury market quietly waits for the only opinion that matters: Fed Chair Kevin Warsh’s. A few well-known macro voices are calling for a surprise hike, but futures markets still overwhelmingly lean toward a hold—and that’s still the highest-probability outcome. The real risk isn’t 25 basis points; it’s Warsh refusing to hand Wall Street the roadmap it desperately wants. His deliberate lack of forward guidance has turned every data point into live ammunition. Meanwhile, the AI trade continues to leak after SK Hynix exposed the uncomfortable truth that even spectacular earnings can’t outrun impossible expectations, while renewed Middle East tensions are giving oil—and inflation anxiety—another heartbeat. This isn’t one story; it’s a dozen storms colliding over the Treasury market. By this afternoon, traders won’t be dissecting the rate decision—they’ll be parsing every adjective Warsh utters.
Punchline:The Fed doesn’t have to pull the trigger today. It just has to remind markets the safety is off.
… only took a couple of amendments, got something workable, not terrible but still don’t feel as though my job at risk … on THAT note, me and ‘this job’ I don’t really have be like …
Good luck out there today!
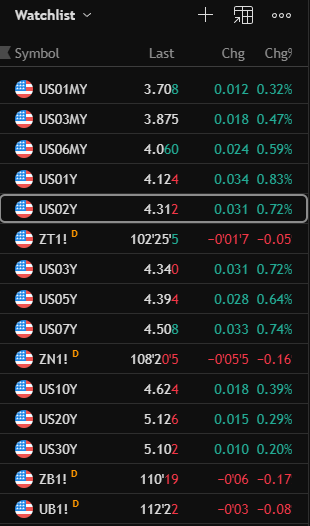
Onwards and upwards TO the reason many / most of you are likely here … whatever it may be on Global Wall’s mind but first … here is a snapshot OF USTs as of 630a:
… for somewhat MORE of the news you might be able to use … a few curated links for your dining and dancing pleasure …
Finviz (for everything else I might have overlooked …)
Moving from some of the news to some of THE VIEWS of Global Wall you might be able to use …
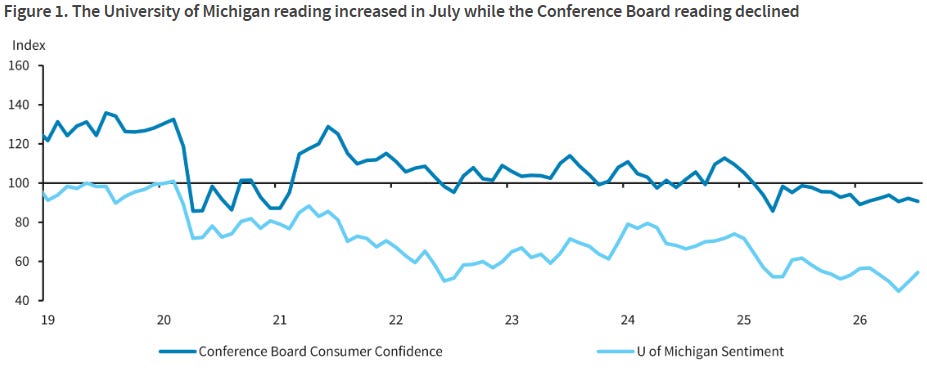
INflation back in housing OR just a (dead cat?)bounce? Whats NOT bouncing … confidence. Related? Maybe …
28 July 2026 Barclays US Economics: First Look: May house prices increase following prior declines
The S&P Cotality 20-City house price index (+0.15% m/m) and the FHFA index (0.3% m/m) increased in May. Today's data provide signs that the price relief that had been seen in prior months has subsided in May.
Barclays US Economics: July consumer confidence declines on weaker current assessment
The Conference Board’s consumer confidence index declined 1.4pts in July, to 90.8. The drop reflects a more pessimistic assessment of current economic activity alongside a constant view of future conditions. Weaker expectations of business activity and the labor market drove the decline.
…The decline is in contrast with the July University of Michigan reading Today’s reading contrasts with the July University of Michigan survey, which increased 4.9pts, to 54.4. The two surveys showed differing views on current economic conditions, and the University of Michigan survey also indicated a stronger assessment of future conditions, while the Conference Board survey saw no change. The gain in the Michigan survey was broad based and showed a decline in one-year-ahead inflation expectations. We generally take stronger signals from the Michigan index and remain attentive to the release of its preliminary August print on Friday, August 14.
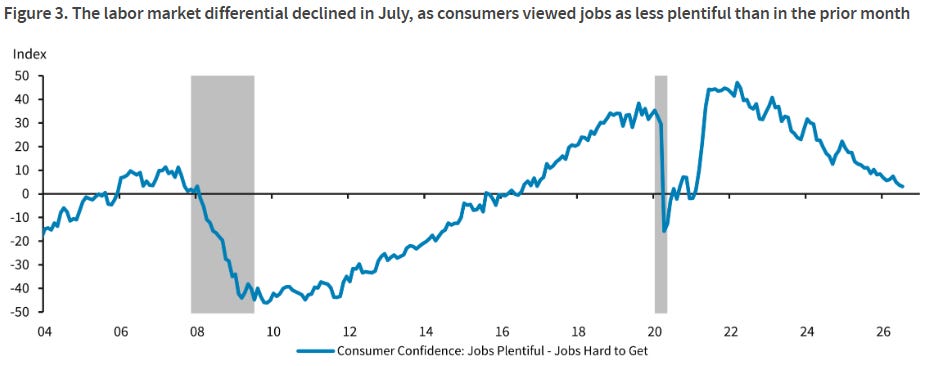
…Consumers' assessment of the labor market was similarly more pessimistic, with a larger share viewing jobs as "not so plentiful" (+1.1pp, to 22.5%), while the percentage of those who view jobs as "plentiful" (-0.9pp, to 24.6%) and "hard to get" (-0.2pp, to 21.5%) declined. The labor market differential slid 0.7pts, to 3.1, as the "hard to get" component declined slower than the "plentiful" component.The correlation between the labor market differential and the unemployment rate (U3) has historically been negative, though a narrowing of the differential has coincided with upward moves in U3 over the past few months.
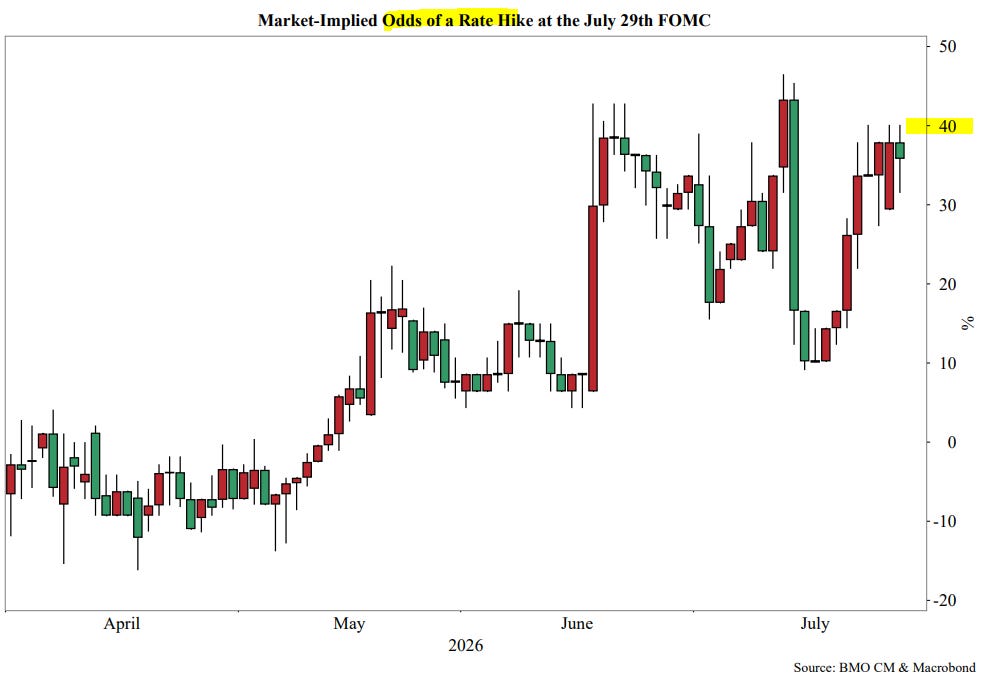
…There might be a compelling case to be made for a hike – that much is clear from the market’s comfort in pricing roughly a one-in-three chance of such an outcome even this close to the Fed decision. Conversations regarding the potential for dissents have picked up in frequency – which seem likely whether the FOMC pauses or hikes. We remain solidly in the hawkish pause camp, which would give the Fed the ability to assess inflation in July and August before acting. Our bias is driven only in part by the June inflation data, which is expected to translate into a “high” +0.1% core-PCE move on Thursday. Perhaps weighing more heavily in our reasoning is the fact that tomorrow’s decision surely isn’t about a single 25 bp hike, but rather whether the 2026 inflation data implies that the neutral policy rate is higher than previously assumed. In the event that adjusting fed funds higher is warranted, it would undoubtedly come in the form of a series of quarter-point moves (3-4 hikes?).
Therefore, the logic holds that patience will outweigh any urgency to respond to the energy-driven inflation spike of March-May. We’re not suggesting that there won’t eventually be a case for higher rates – it just isn’t a foregone conclusion. Fed funds futures are pricing in ~50 bp of hikes by Q1. Should the Fed move tomorrow, that would be 85-100 bp very quickly. Hence, the likely reluctance to move given the competing information on the trajectory of realized inflation. It surely isn’t wasted on the Committee that the recent escalation in the Middle East was able to quickly reprice oil prices higher…
…Tactical Bias …Taking a step back, we’ll note that oil and Treasuries are once again trading virtually in lockstep following a brief decoupling of the two asset classes over the course of the ceasefire. For context, daily changes in 10-year yields and the front-month WTI crude oil contract have been directionally consistent in the last seven consecutive trading sessions. With Wednesday’s FOMC decision and Thursday’s core-PCE release on the horizon, the macro fundamentals are coming back into focus at a moment when the pause in fighting between the US and Iran has brought oil prices back below $80/bbl. However, it remains to be seen whether peace talks will ultimately prevail and therefore lead to a decoupling of the price action in 10-year yields and WTI crude, or if the threat to global oil supply will re-escalate, bringing energy prices back to the forefront of the macro narrative…
EARL on the run, markets rotate, bonds remained steady …
Oil fell on potential US-Iran de-escalation; global yields declined; Fed uncertainty remained elevated; Asian technology shares underperformed; US equities rotated defensively; KRW and CLP gained; DXY at 101.39 (-0.1%); US 10y at 4.61 (-4.2bp).
Potential progress toward reopening regional shipping routes reduced the energy risk premium, supporting global duration and broader equity participation even as semiconductor weakness weighed on Asian markets and the Nasdaq.
…US rates bull-steepened as lower oil prices, weaker consumer confidence, and technology-sector weakness supported demand for duration (2y: -3.5bp; 30y: -4.8bp). Brent and WTI declined 4.5% and 4.1%, respectively, after reports of potential diplomatic progress between the US and Iran and discussions aimed at restoring shipping through the Strait of Hormuz. July consumer confidence fell to 90.8 versus expectations of 92.4, while the labor-market differential reached its lowest level since early 2021. Markets reduced near-term tightening expectations ahead of Wednesday’s FOMC decision, although elevated futures positioning and differing strategist views preserved substantial event risk. The $44bn 7y Treasury auction tailed by 0.2bp at 4.473%, with a 2.49 bid-to-cover ratio, but the modest miss did not interrupt the broader rally…
Rates UP, sentiment (out the curve) COULD then be challenged …
29 July 2026 ING Rates Spark: A Fed hike could shake sentiment
We don't think the FOMC will hike rates, but markets see a 30% probability that it does. The front end of the EUR and GBP markets can move even higher on a hawkish tilt. Longer-dated global rates, however, could find resistance to follow through, especially if the positive market sentiment gets challenged by a tightening of financial conditions
GDP down AND lower confidence. What could possibly go wrong … maybe we should be talkin CUTS today??
Taking on board today’s trade and inventories data for June we took down our estimate for Q2 real GDP by a tenth to 1.6% (saar). The data will be released on Thursday. Trade and inventories are both expected to weigh on growth in the second quarter, and despite the weaker overall pace of growth, we expect real consumer spending accelerated up 2.6% (saar) relative to just 0.5% (saar) in Q1. Business fixed investment we expect remained robust too.
Conference Board consumer confidence slipped -1.4 points to 90.8 in July, slightly below consensus, as a weaker assessment of current conditions offset stable expectations. Higher gasoline prices and ongoing Middle East tensions likely weighed on sentiment during the survey period, in our view. Labor market perceptions softened, with the closely watched labor market differential falling to its lowest level since February 2021, and references to jobs and unemployment increased in write-in responses. Despite the softer confidence reading, consumers were relatively more upbeat about spending, with stronger vacation and travel plans, stable intentions to purchase major appliances, and increased expected spending on services such as restaurants, travel, and entertainment over the next six months…
28 July 2026, 14:37 UTC UBS: Fed task forces: Big potential, expect incremental change
Chair Warsh has launched five monetary-policy task forces, though any recommendations must ultimately win majority FOMC support which limits fast or large changes.
The communications and balance-sheet reviews are likely to be the most consequential, potentially affecting rate-market volatility as well as longer-term bond market valuations.
The communications review could revisit the dot plot rate forecasts as well as forward guidance; reducing their signaling role would likely increase rate volatility.
Major communications reforms may be difficult to achieve given the Fed's recent challenges in building consensus.
Balance-sheet reforms are more likely to gain broad support but would likely be implemented gradually to avoid disrupting funding markets or longer maturity rates.
Regulatory changes that lower reserve demand could support a smaller balance sheet. Guidance for a gradual return to a shorter Treasury-focused portfolio would likely use runoff and reinvestment rather than asset sales.
For markets, the likely end state is higher long-end term premiums, a steeper yield curve, and a more limited role for asset purchases reserved for recessions or periods of market stress.
…The communications task force will likely examine the use of forward guidance, economic projections, and interest-rate projections. Meaningful changes could increase interest-rate volatility. The rate "dots" in the current communications framework help anchor near-term expectations, particularly for the current year. Former Chair Powell indicated during the recent communications review that he was unable to find a consensus around significant changes, suggesting reform may prove challenging. That said, there is a reasonable probability that projections are reformatted in a way that reduces the anchoring effect on near-term market pricing…
…For fixed income markets, the balance-sheet review points toward a gradual but persistent increase in long-end term premiums, a steeper yield curve, and somewhat wider MBS spreads as the Fed's presence at the long end recedes. The 2013 taper-tantrum episode has made policymakers cautious about making asset purchase policy changes. From May to September 2013, 10-year yields rose over 135 basis points with large spillovers in most markets following comments from former Chair Bernanke about slowing the pace of asset purchases. As a result, the timeline for these policy changes and effects is measured in years rather than months, given the slow pace of portfolio runoff and the cautious approach the Fed is likely to take. Spreads on fixed income may experience a temporary benefit from regulatory reform if changes to liquidity rules expand bank balancesheet capacity before reserve balances begin to decline…
29 July 2026 UBS Global Strategy Rates Map - Bonds in the global portfolio
The big picture: 8% on global equities and 0.35% on bonds The AI debt boom is showing some fatigue, staggered lock-ups are a conversation starter in macro circles, and concerns about semis and momentum linger. Yet, a cycle like no other goes on and global stocks (MSCI world) are up 8% year-to-date against a modest 0.35% for the USD-hedged global aggregate total return bond index. Since Dec '19, global equities have put up a 103% return versus 8% for bonds. This has not been a horse race.
Some good news and asymmetry for bond bulls The good news is that yields have settled at levels high enough to offer some buffer again, with what looks like a containable inflation bump ahead. This has also been different from 2022, when global equities fell 19% and bonds 11%. This time, rangebound equities have not yet triggered CTAs de-risking, but CTAs have tripled their duration underweight, leaving positioning at unprecedented levels. From here, the asymmetry is clear: they can only add duration. Any rally of more than 15bps from current yield levels is likely to trigger sizeable buying flows, equivalent to roughly $100- 250m of global DV01. The net supply of interest risk to the market in the euro area and US continues to look manageable through 2026-27 (Figure 4). In fact, the UBS funding update pushed out the US coupon supply increase to May '27 from Feb '27 previously. The 10y equivalent supply net of Fed is expected to reduce to edge lower in 2027 as a %GDP. Supply, in other words, is not the villain of the story.
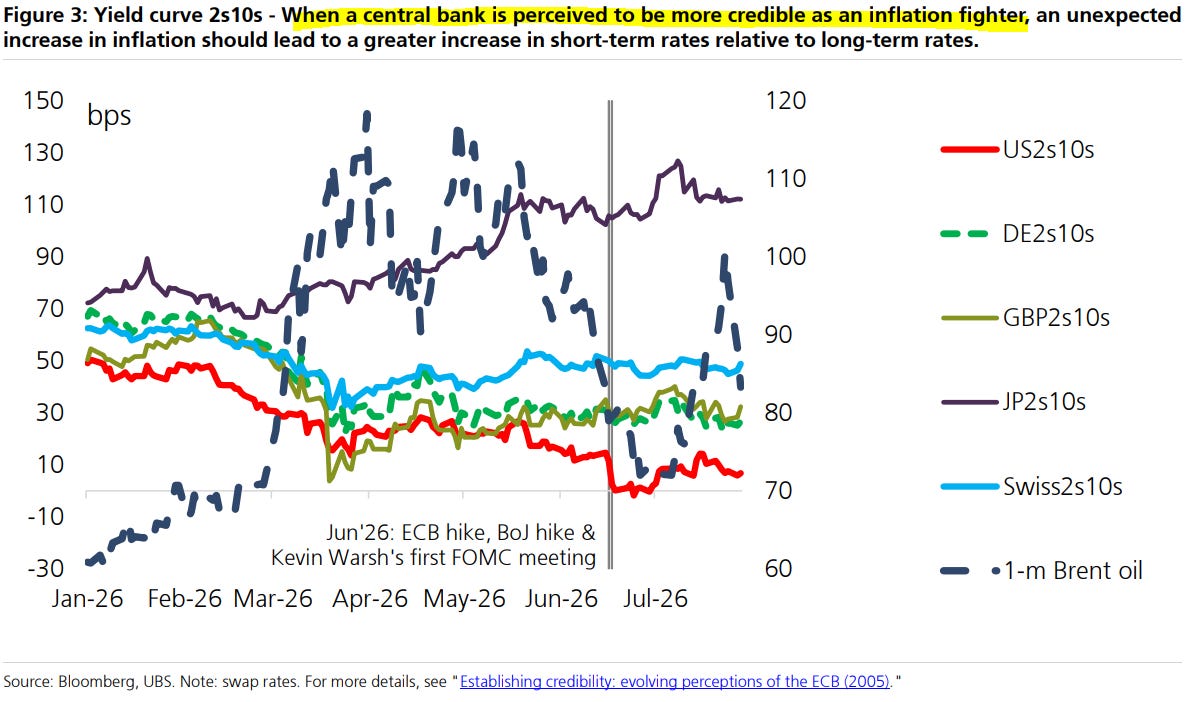
Flatter yield curves - a credibility, not growth story An unexpected increase in inflation should lead to a greater increase in short-term rates relative to long-term rates when a central bank is perceived to be less tolerant of inflation and more credible as an inflation fighter (see "Establishing credibility: Evolving Perceptions of the ECB (2005)" - still worth a look 2 decades later). Figure shows that this is exactly what happened (Figure 3).
Lesson of ECB & BOJ vs Fed in June '26 Encouragingly, the rate hikes of 25 bps by the ECB and BoJ in June '26 did not spark any fresh pricing of further tightening (Figure 2). In contrast, the June's Fed meeting did and debate is now when the Fed will deliver on some of the pricing and if we could see more hikes priced.
Avoiding an expectations trap, regardless of Phillips curve Central banks do not want to get caught in an “expectations trap," the unhappy situation in which public expectations of higher prices pressure the central bank into contributing to actual inflation increases. The basic mechanism is always the same. The key thing is that the public starts expecting higher inflation. In this framework, you can even be flexible on the reasons why. You do not even need a short-term Phillips curve as a source of higher inflation. The point is that once households start behaving as though nominal growth is going to run hotter, a central bank faces temptation. Being responsive to concerns about the health of the economy then leads to continued accommodation and an expectations trap. The elevated levels of real rates in Europe and the US with market-based measures of medium-term inflation close to targets is one indication that central banks are ready to defend their credibility.
Concerns about risk assets persist We continue to receive questions on the risks of rising funding costs for US tech firms. Further pressures from Chinese lab competition for US tech is very much a baseline with clients. Attitudes of reserve managers on gold are also shifting given its "equity-like" volatility but without income. All this should support core bonds…
Iran’s missile strikes against US Gulf military bases pushed oil prices modestly higher. It is a reminder of the challenge for investors—Iranians are clearly setting the agenda in the Gulf war, and investors do not know how to analyze the motives of the Iranian military. This constrains investors’ ability to price in plausible scenarios, and leaves little other than the default optimism bias to influence markets.
The Federal Reserve meets, with Fed Chair Warsh refusing to offer markets a framework within which to consider policy. Does the Fed care about inflation expectations in a world of social media hysteria? What second-round inflation effects matter? Does the upcoming “adjustment” of consumer price inflation calculations (lowering inflation) affect policy? Warsh is channeling Gollum and crooning “my precious” over the Fed’s framework, risking volatility and higher risk premiums in markets.
The equity market technology convulsions continue, with less ferocity. We are still far from the levels that would likely alter consumer behavior. To the extent that this sell-off has been motivated by AI customers’ increased reluctance to spend, the move might signal more funds available for more conventional investment…
Finally, a couple few words (and a chart) from Dr. Bond Vigilante ahead of today’s FOMC meeting … INFLATION>labor …
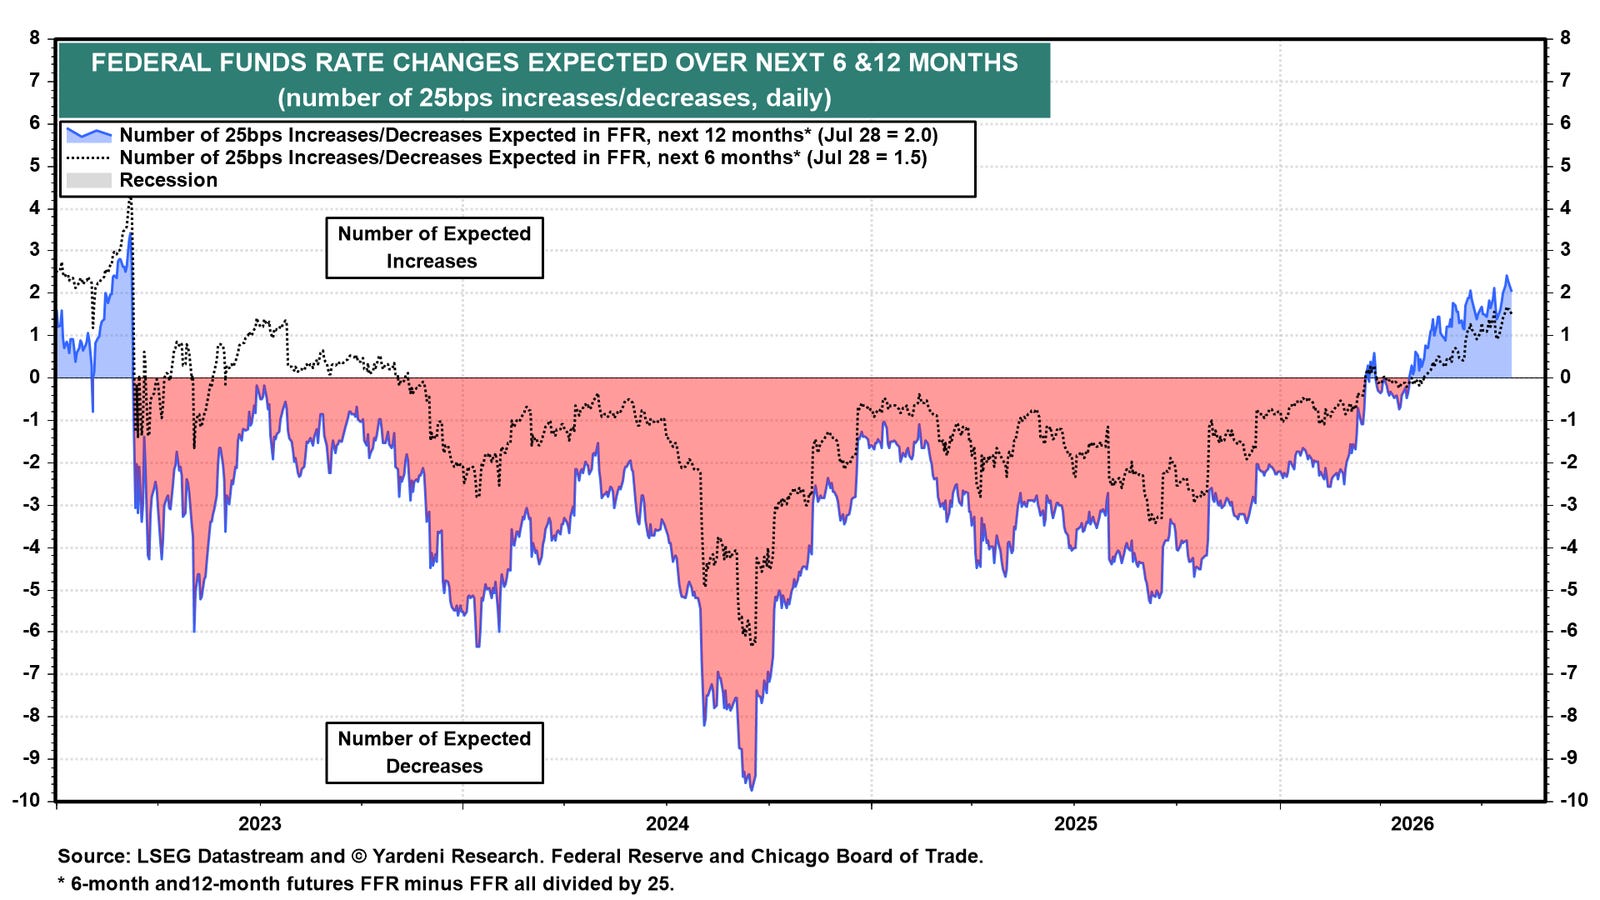
All eyes are on Wednesday’s FOMC meeting. Markets expect the Fed’s monetary policy committee to leave the federal funds rate (FFR) unchanged at 3.50%-3.75%, with the CME FedWatch assigning roughly a 70% probability to no change and a 30% probability to a 25bps rate hike. Investors will be closely watching the FOMC statement, Fed Chair Kevin Warsh’s press conference, and the degree of any dissent for clues about the policy outlook. Given the economy’s continued resilience and persistent inflation pressures, there is a reasonable chance that two hawkish regional Fed bank presidents, Lorie Logan and Beth Hammack, dissent in favor of a rate hike.
Recent data continue to suggest that inflation risks outweigh labor market risks. Consumer spending remains robust, the labor market is balanced, and manufacturing activity is rebounding, boosted by the AI investment boom and onshoring. As a result, the FFR futures market continues to price roughly two 25bps rate hikes over the next 6-12 months (chart).
… Moving along TO a few other curated links from the intertubes. I HOPE you’ll find them as funTERtaining (dare I say useful) as I do … …
Dr Slok noting questions the markets askin’ …
July 29, 2026 Apollo: The Market Is Asking Questions
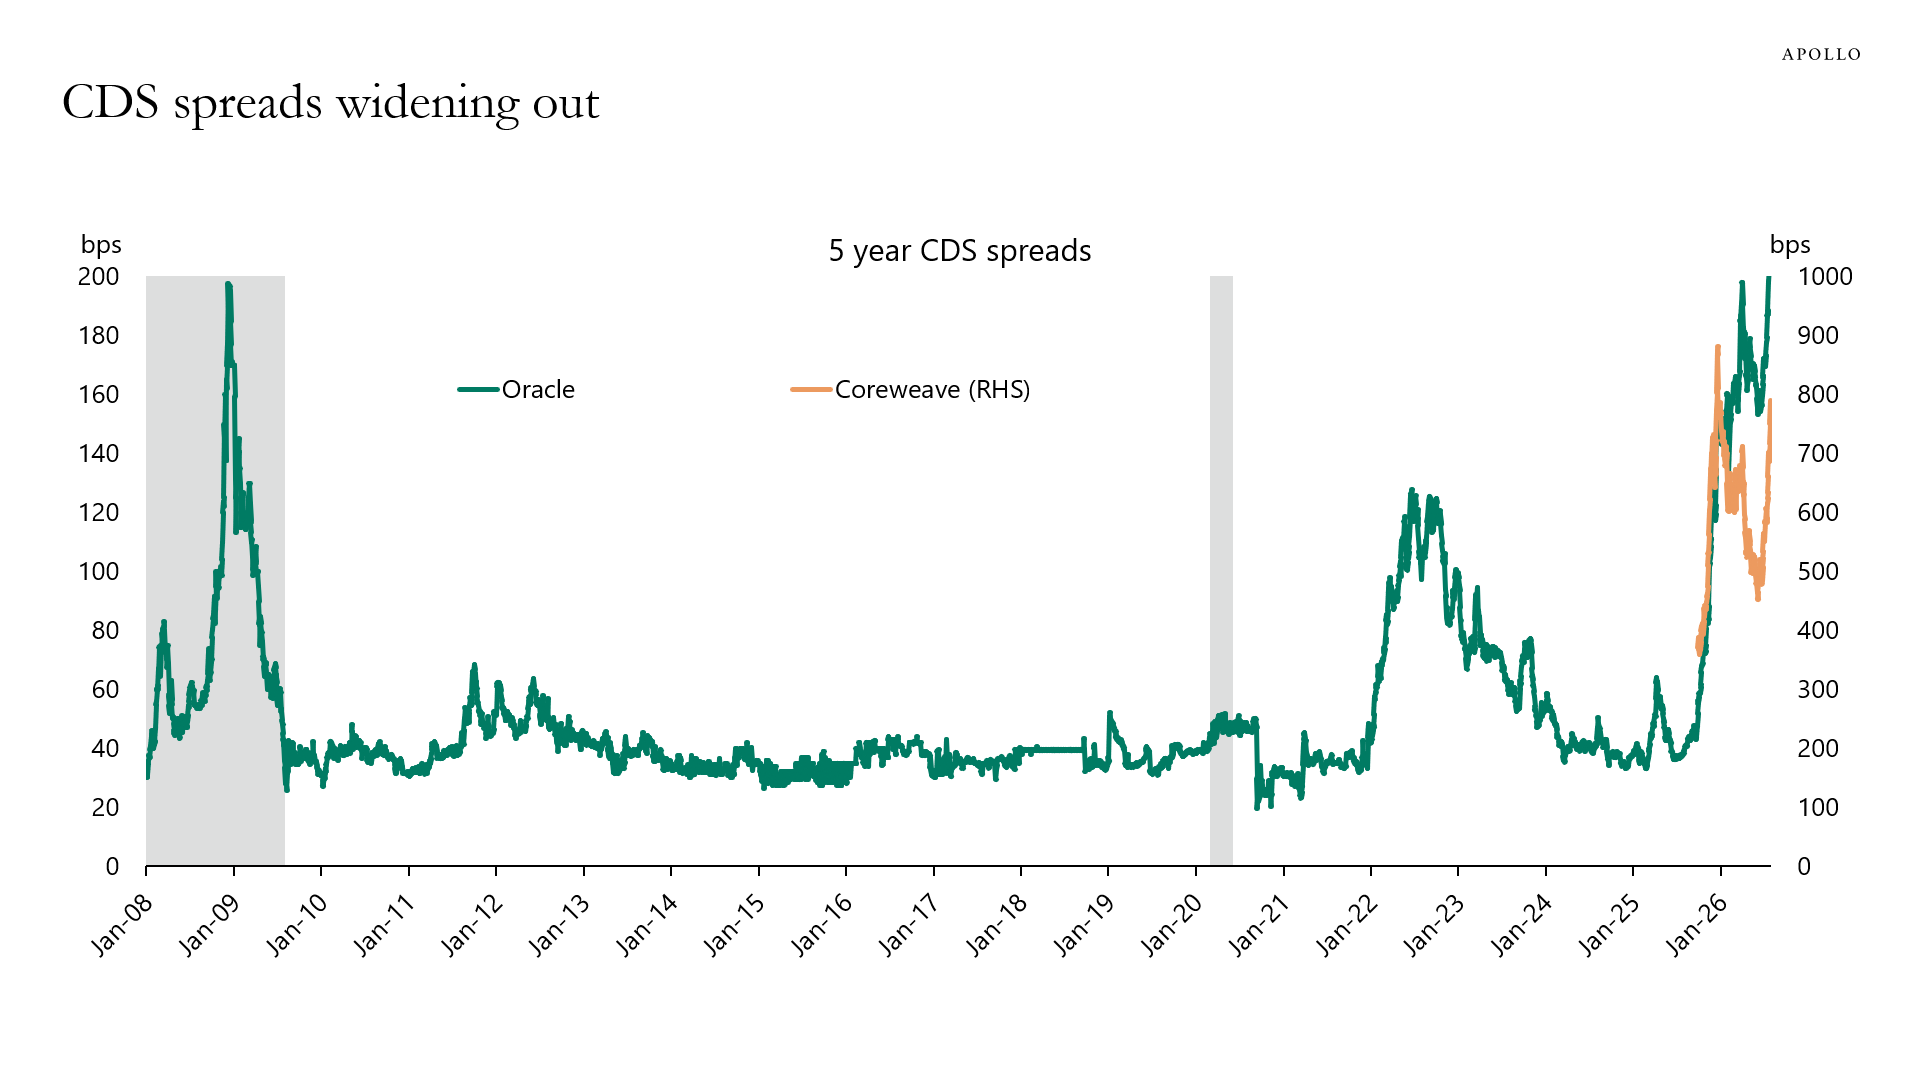
CDS spreads have started to widen out for names in AI, and the market is asking three fundamental questions:
1) Will the AI capex pay off, and how quickly? With trillions committed to data centers, chips and power up front, the question is whether AI monetization ramps fast enough to clear the cost of capital before the assets depreciate, or whether it’s an overbuild whose ROIC never catches up to its WACC on a massive, front-loaded outlay. For more, see also here.
2) How is all of this being financed, and at what spread? Hyperscaler spreads are widening as the buildout is increasingly funded with debt rather than organic free cash flow, and as issuance surges, the question is whether the all-in yield climbs to a level where the marginal data-center dollar no longer clears its return hurdle, forcing the capex cycle to self-throttle.
3) Will there be unlimited demand for compute, or will compute demand peak? The bull case assumes demand is effectively insatiable as inference workloads, agentic systems and new model generations compound, but the risk is that efficiency gains, model commoditization or slower-than-expected enterprise adoption cause demand to plateau well below the capacity now being built, leaving the industry with a glut of expensive, rapidly depreciating infrastructure.
… all of Global Wall be like …
CHARTS … I like em and here’s one which is, well, nuts. Turn that frown upside down, right?
Jul 28, 2026 CAPPNOTES: S&P 500 - A Different View Patterns, momentum and a signal we’re watching closely
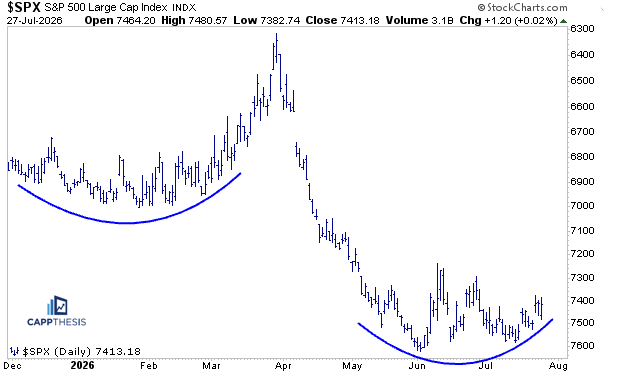
A Different Perspective: Turn the S&P 500 Upside Down
When a market is struggling to break out, I find it helpful to look at the chart from a completely different perspective.
Most of us naturally have a bullish bias—myself included. After a sustained uptrend, we tend to interpret consolidations as continuation patterns, expecting them to eventually resolve higher. And to be fair, they often do.
But not always.
One simple exercise is to flip the chart upside down.
Doing so removes some of that natural bullish bias and forces us to evaluate the price action more objectively. Sometimes, patterns that seem constructive in their normal orientation begin to resemble something very different.
An Interesting Comparison
Viewed upside down, the current S&P 500 pattern bears a striking resemblance to the market’s behavior from late 2025 into early 2026.
At that time, the index repeatedly tested the 7,000 area but failed to break through. Momentum gradually faded, market breadth had already begun to weaken, and once a negative catalyst emerged, the pullback accelerated.
Of course, we also know how that period ultimately ended—with a relatively brief decline followed by an exceptional reversal.
Today’s market is obviously not identical. But with the S&P 500 once again stalling beneath major resistance, this time near 7,600, it’s a scenario worth keeping in the back of our minds.
…The Key Takeaway
This isn’t a prediction that the market is about to break down.
Rather, it’s a reminder that perspective matters.
Whether it’s flipping the chart upside down, monitoring the newly triggered weekly MACD sell signal, or weighing competing bullish and bearish patterns, the goal is the same: remain objective.
The next several days could prove pivotal. Between earnings season, the Federal Reserve, and key economic data, the market is about to receive several potential catalysts.
Until price confirms one direction or the other, keeping both scenarios on the table remains the most disciplined approach.
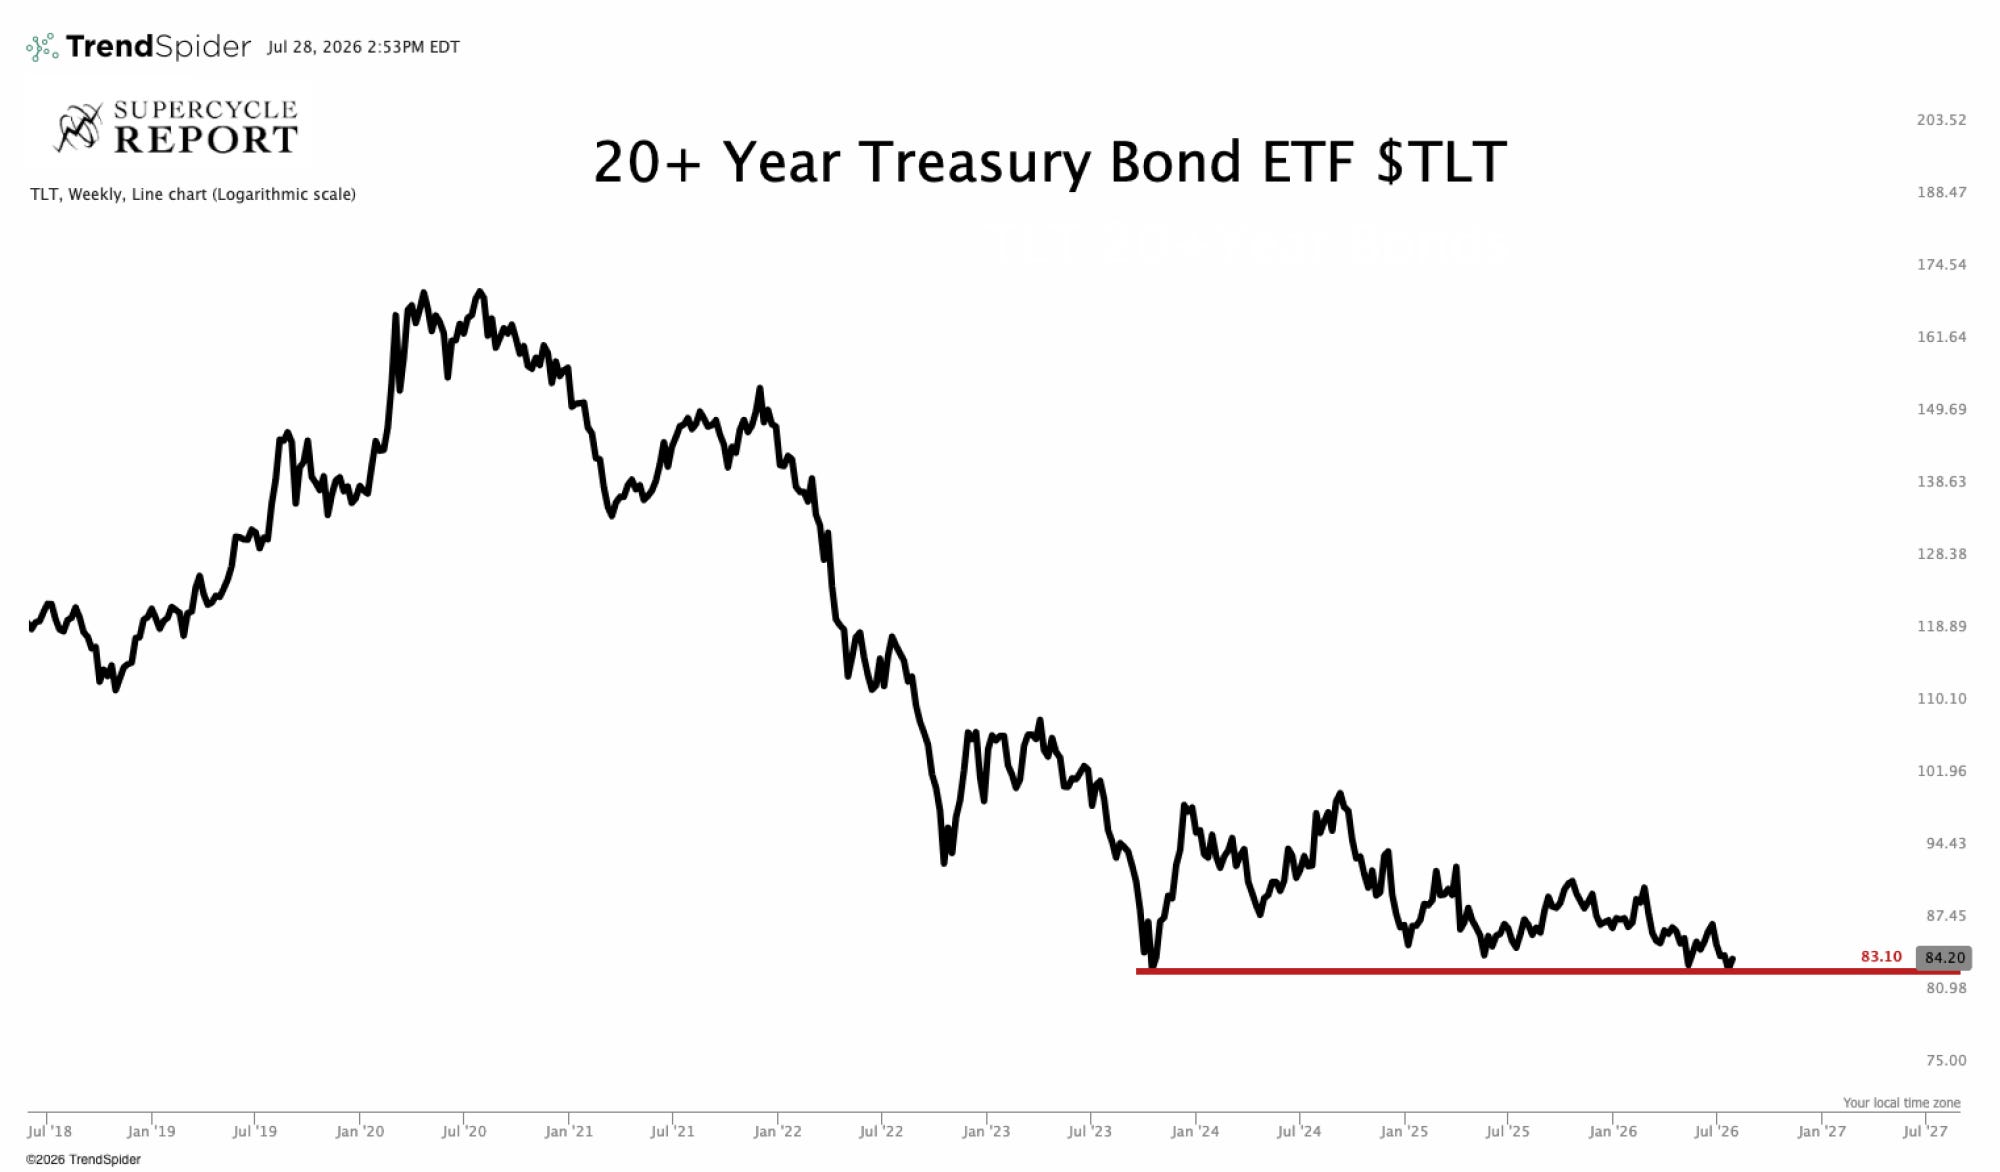
AND another chart … TLTs, this time, from a shop that is bearish bonds and remains SHORT
July 28, 2026 AllStarCHARTS: The Fed Isn’t Going To Surprise Anyone
…The Fed’s focus remains the same. Inflation is still running above its target, the labor market remains relatively healthy, and higher energy prices combined with ongoing geopolitical tensions continue to complicate the outlook.
The real question isn’t whether they hike tomorrow.
The real question is how long they intend to keep rates on hold.
That’s where the charts become more important than the headlines.
Take a look at TLT, the 20+ Year Treasury Bond ETF.
It is sitting on one of the most important support levels we’ve seen in years.
Could bonds bounce from here?
Absolutely.
In fact, I wouldn’t be surprised at all to see a relief rally if the Fed simply holds rates steady and delivers a patient message. Short term traders could easily push bond prices higher for a few days.
But my longer term view hasn’t changed.
I’m still hanging on to my bond shorts.
Warsh may sound more hawkish than some of the current committee members, but I don’t view him as a true inflation hawk. Talking tough and maintaining restrictive policy for years are two very different things.
He has to talk tough or people will think he is Trump’s puppet.
The bigger trend still points toward structurally higher inflation, rising commodity prices, and eventually higher long term yields.
That’s why this support level matters so much.
If TLT breaks below 83.10 during Fed week, I think the market will be telling us something far more important than anything said during the press conference.
What they SHOULD do and will do, often different, nuance to be discussed throughout the ages and here, the inventor of the MOVE (so a very smart guy) says Fed SHOULD hike 50bp
I have been on record as "higher for longer" against the naysaying Team Transitory for a few years. Thus, I pushed back hard on the late-2025 expectation of three FED rate cuts.
To my chagrin, I was more right than anticipated, and I now offer that the FED should hike their rate by 50bps after tomorrow's meeting.
I will say I can offer no economic support for a 50bp hike, rather I am looking solely at market psychology and politics.
As I detailed in my Commentary - "Moral Hazard" (May 23, 2023), I believe Forward Guidance contributed greatly to the GFC, and the DOTs have only made it worse. Investors have used such to increase both risk and leverage. The FED’s March 2021 Forward Guidance that rates would remain near zero until 2023 is why SVB did not hedge.
Thus, Warsh's elimination of Guidance last month and placing DOTs on the chopping block is terrific public policy; and a 50bp hike in July would lock in this success.
A 25bp hike is too chicken $hit to match Warsh's rhetoric, and 75bp implies he knows we have an economic problem, which he does not.
The December 2026 Fed Funds futures contract is priced at 4.04%, so the notion of a "market Armageddon" is silly. The market already has the rate right, just not the timing.
A 50bps hike shows there is a new sheriff in town, and he is not beholden to the President. An independent Fed is the cornerstone of the Global financial system, smartly confirmed by the recent Supreme Court decision that exempted the FED from Executive Branch (Presidential) control…
From bull to bear …
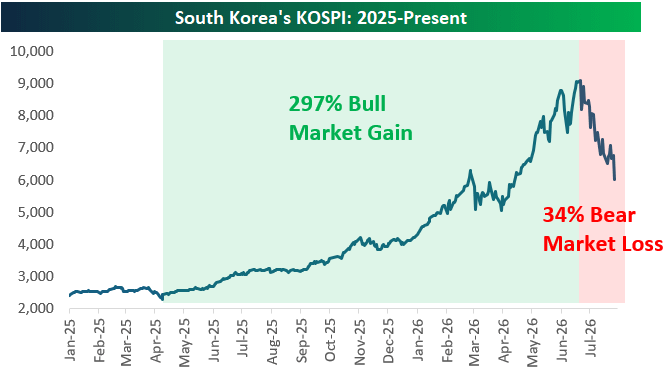
Tue, Jul 28, 2026 BESPOKE: South Korea KOSPI Crash
After gaining 297% from 4/9/25 to 6/22/26 for its strongest bull market since an 850% rally from May 1982 to April 1989, South Korea’s KOSPI has crashed 34% in the last 25 trading days (36 calendar days):
Below is a look at historical bull and bear markets for the KOSPI using the standard 20% rally/decline threshold on a closing basis.
As shown, the current bear market decline of 33.9% is already slightly worse than the average bear market drop of 33.5% for the index, while the length of just 36 days for this bear is well shorter than the average bear-market length of 229 days for the KOSPI going back to 1980.
Of course, we won’t know how long this bear will ultimately last until it’s over, and we won’t know when it’s over until we see the index rally 20%+ from a low point. What we do know is that after one of the most parabolic rallies in history for a major global index, the KOSPI is currently in the midst of one of its fastest-ever bear-market drops.
Read this short note last night and think Colas & Co are right and this paper set to make a comeback … here are a few words AND A CHART (of stocks) to keep in mind today / tomorrow and in light of the drift HIGHER yesterday …
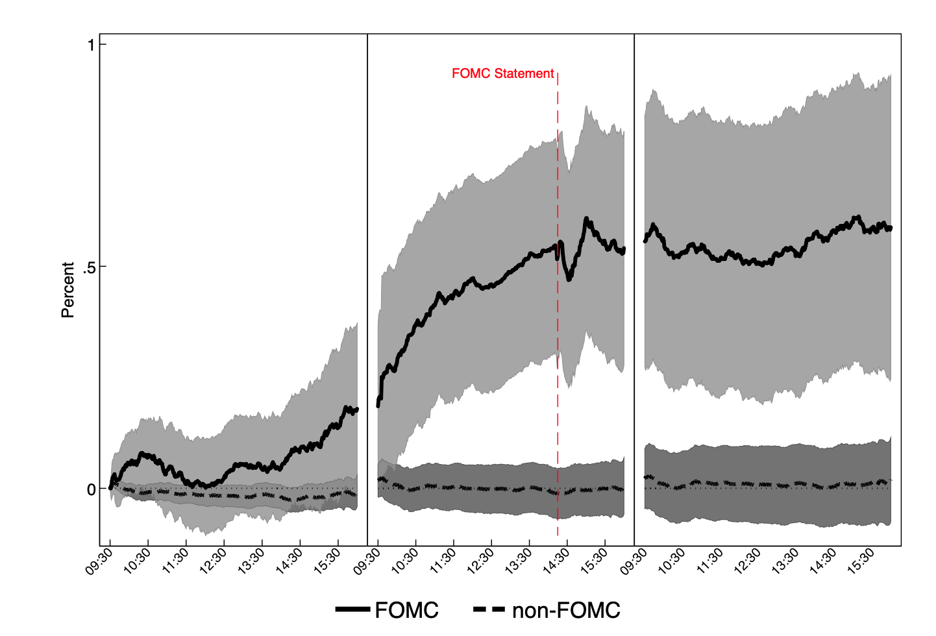
…Topic #2: A brief reminder of the “Fed Drift”, shorthand for a piece of New York Federal Reserve research that was published in 2011, updated in 2013, fell off investors’ radars afterwards, but we suspect will make a roaring comeback over the rest of the year.
The work (link below) looked at S&P 500 returns in the 3-day period around regularly scheduled FOMC meetings from 1994 through 2011 and compared those to all other days. This timeframe reflects the period when the Fed did not communicate much aside from bare-bones reports about committee decisions. Fed Chairs started doing regular press conferences in 2011, and the FOMC began publishing the famous “Dot Plot” in the Summary of Economic Projections in 2012.
The following chart from the Fed’s paper shows cumulative S&P returns for those Fed meeting-related days (top line, 95 percent confidence interval in light gray) and the rest of the 1994 – 2011 period (bottom line, dark gray).
The authors found that 80 percent of the S&P 500’s excess returns over cash occurred in the 3 days around Fed meetings, as those narrow windows provided the market with important information about monetary policy. That, in a nutshell, is the “Fed Drift”: stocks rally around FOMC meetings (top line) and generate much smaller returns when waiting for the next one (bottom line).
Takeaway: Chair Warsh’s rolling back the calendar to a time when the Fed communicated far less may well mean returning to a time when US large cap returns were concentrated in just 24 days out of the customary 250 – 251 trading sessions in any given year. Today’s modest gain (S&P 500: +0.2 percent) checks the box on Day 1 returns. How the S&P does tomorrow and Thursday will tell the rest of the story.
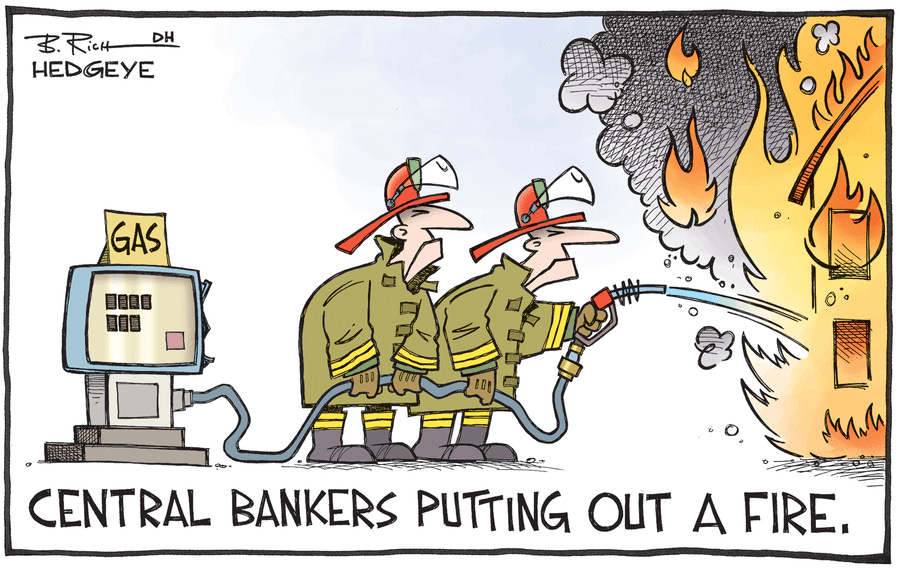
I do struggle with the concept that Oil Spike generated Inflation could be cured
by hiking interest rates...
Seems to be an Oil supply/demand problem...that would eventually cure itself,
as oil supply/demand rebalances..
Not sure higher interest rates helps here. Might even make matters worse...
Business costs being pushed up by rising fuel, so we're going to raise their borrowing
costs, also ???