while WE slept: USTs in narrow RANGE; NFIB UP (but); a dip to buy? -CitiFX; map of dot plot mavericks and their net hawkishness -DB; just say NO (to Fed put)
Good morning … An interesting day yesterday and it would appear that things are relatively calm this morning, as they were this time yesterday, due to holiday in Japan. There was, however some news from EZs largest economy …
Reuters: German investor morale tumbles in August
… this was then more recently followed by some news from the US small biz sector …
NFIB: Inflation Continues to Plague Main Street
… The Optimism Index rose 2.2 points in July to 93.7, the highest reading since February 2022. However, this is the 31st consecutive month below the 50-year average of 98. The last time the Index was at or above the average of 98 was December 2021. Of the 10 index components, 5 increased, 2 decreased, and 3 were unchanged…
… Still, it certainly feels like a(nother)calm before the (data)storm and with PPI later on (and some more professional charts below) I thought I’d start with a quick look at the front end …
2yy: bearish momentum waning, ‘support’ (prior lows) up nearer 4.135%
… Technicals schmechnicals. DATA and geopolitical turns of events will dictate pricing and price action, just as it governed yesterdays ‘aggressively UNCH’ action …
ZH: Gold, Oil, & Bonds Soar As Stocks Swing Wildly To Unch Ahead Of Big Data Week
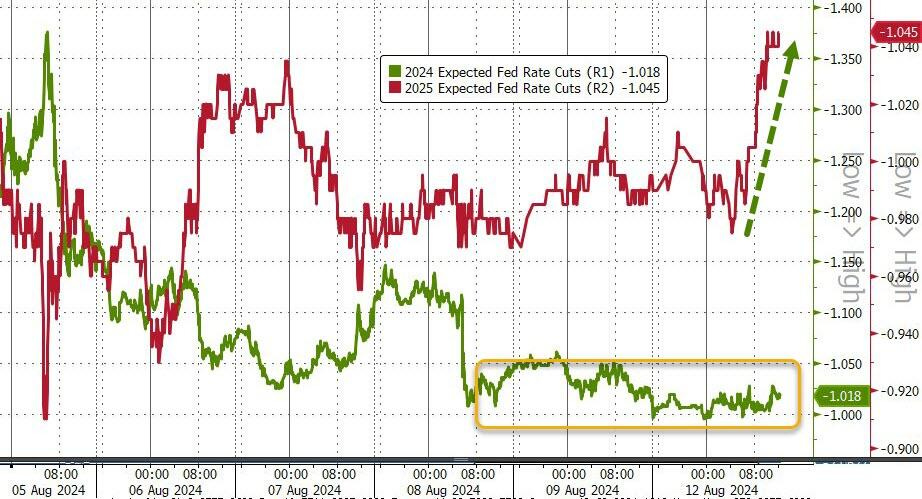
… Rate-cut expectations rose today but the dovishness was all pushed into 2025 (with 2024 stuck at four 25bps cuts)...
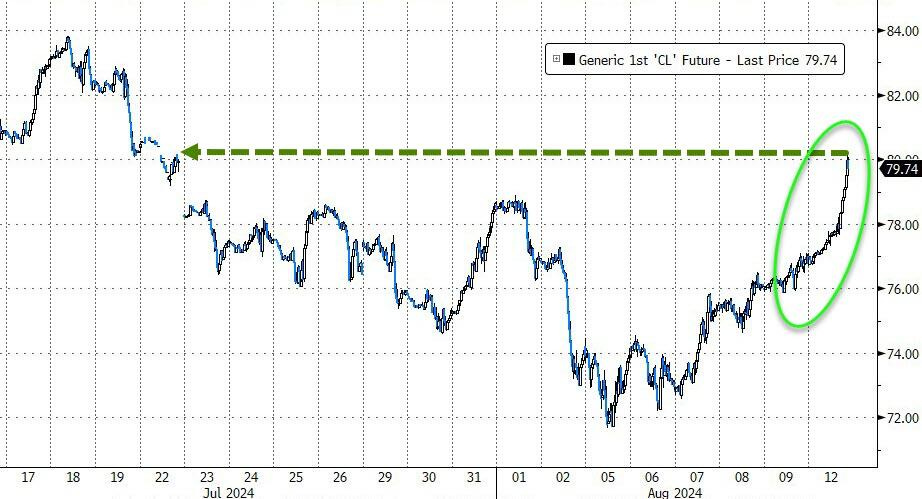
…Crude prices also exploded higher today amid geopolitcal tensions with WTI topping $80 for the first time in three weeks)...
… here is a snapshot OF USTs as of 643a:
… and for some MORE of the news you might be able to use…
IGMs Press Picks: August 13 2024
NEWSQUAWK: US equity futures firmer, Antipodeans lead whilst havens lag, GBP gains post-jobs data; US PPI due … USTs are flat awaiting today’s US PPI, Bunds benefit from dire German ZEW metrics … USTs are essentially unchanged and awaiting PPI before Wednesday’s US CPI for insight into PCE at the end of the month, a figure which is scheduled for the week after the Jackson Hole symposium. Into the release, USTs are in a narrow 113-04 to 113-11+ band.
Reuters Morning Bid: Market lull as PPI eyed, Nikkei returns to base
Finviz (for everything else I might have overlooked …)
Moving from some of the news to some of THE VIEWS you might be able to use… here’s SOME of what Global Wall St is sayin’ …
CitiFX: US rates: A dip to buy?
Yields have bounced higher after a sharp slide on August 5. In techs, the moves are significant and signal that we could see further moves lower.
…US 5y yields
Weekly close below 3.75% sets a ‘lower low’ and brings the 55-200w MA setup into play. Formation indicated target is at 2.77% (200w MA).Similar to 2y yields, however, this could be a slow move, since weekly momentum is showing signs of crossing higher form ‘oversold’ territory.
Short term, a bullish hammer candlestick on Aug 5 and a bullish outside day on Aug 8 supports the case for a short term move higher in yields. Short term resistance is at 3.99% (Mar low), while short term support is at 3.45% (Aug low)
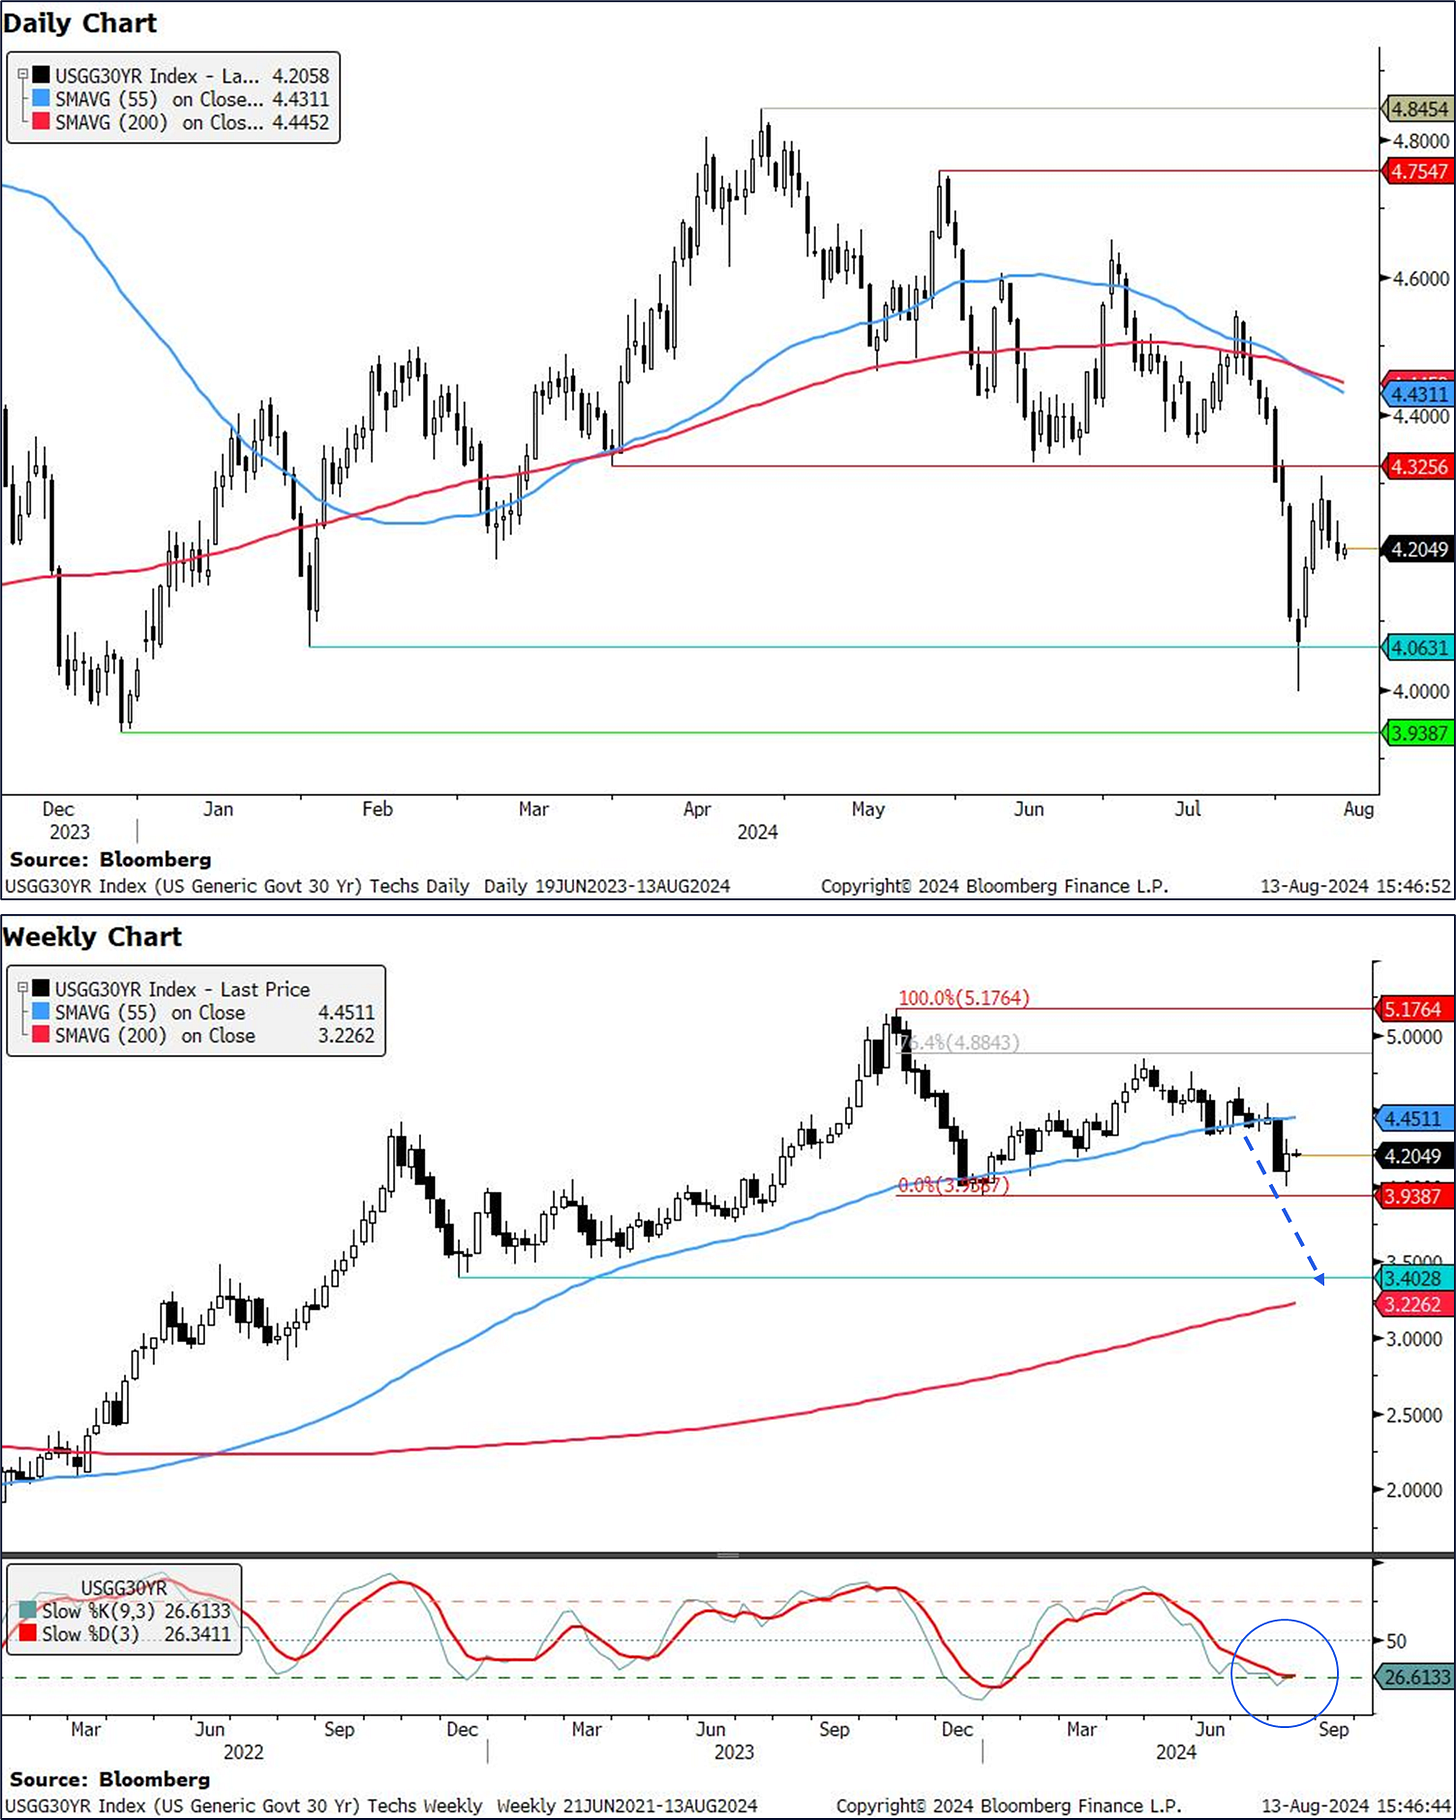
…US 30y yields
Yields have tested support at 4.06%. (Feb low) and posted a hammer candlestick at the bottom of the downtrend. On top of that, we are also on the verge of crossing higher in weekly slow stochastics.Overall, the picture here suggests we could be range bound between resistance at 4.33% (Mar 28th low), and 4.06% support in the near term, which lends to the case of a bull steepening view (given the above techs in the short end).
For the longer term: We look for a potential weekly close below 3.94% (Dec 2023 lows), as it would suggest a larger move lower towards 3.21% (200w MA) and 3.40% (Dec 2022 low).
DB: USD CPI market preview
Market fixings are currently pricing July CPI at 2.92% vs 3.0% consensus YoY, 2.97% consensus Index NSA and 2.96% DBecon…
Our main focus will be on OER & primary rents. The recent slowdown in the ATRR indicator suggests significant downside risks in Q3, but the magnitude of previous revisions suggests some caution. We would also be looking at used cars and airline fares given the recent weakness. Wholesale prices point towards continued deflation in used cars (the impact of which is augmented in SA terms). Fuel prices suggest downside on airline fares should be limited relative to the May-Jun prints.
As for the CPI fixings pricing over the coming months, we find the market is pricing continued disinflation, with estimates of CPI ex gasoline MoM pace consistent with pre-Covid 1.5-2.0% y/y trend in H2. Leading indicators suggest the bar for pricing further downside over the coming months should be relatively high - and likely dependent on rent inflation and core services ex rents dynamics.
Market-wise, we maintain our long 5y5y CPI. Besides the balance of risks assessment, 10y CPI trades fair relative to model-implied estimates, with upside risks to our fair value stemming from shipping costs. 5s10s still trades too flat relative to the level of front-end BEI and macro data, while 5y5y CPI remains fundamentally low relative to measures of long-term inflation expectations and inflation uncertainty. However, we recognize the trade is exposed to negative seasonality in August.
DB: Mapping the dot plot mavericks (a veritable who’s who…)
In recent work we used the individual-level historical forecasts from the Federal Reserve to assess how often Chair Powell deviated from the median rate expectation in the SEP (see “Plotting the Chair’s dot”). Using data through 2018, we found that Powell was often at the median, but as Chair he tended to skew in a hawkish direction when he deviated from the consensus. This skew differed from Powell's predecessor, Janet Yellen, and may have reflected his tendency to forecast stronger growth and better labor market outcomes.
This note extends our earlier work. We construct two measures for each official that submitted dots in the SEP over the period 2012-2013 and 2016-2018. The first metric provides a gauge of the relative hawk/dove leanings of each official and the second assesses how often each official deviated from consensus. We discuss the relationship between the two metrics as well as some of the shortcomings that will motivate further work.
MS: US Credit Strategy and Economics | North America
Staying Resilient Through Softer GrowthWe think that corporate balance sheets can navigate slower growth alongside a shallow easing cycle. Despite investor concerns, we remain constructive in the medium term and outline the key reasons for our conviction.
Key takeaways
Concerns about US growth have risen, but we continue to expect moderate slowing, not a slump. By 2Q25, our economists see inflation near the Fed's target, growth slowing to around 2%, and a total of seven rate cuts. Our view of the shallow easing path is driven by resilient growth rather than sticky inflation. The Fed has options to respond should growth weaken more than we expect.
Corporate balance sheet metrics were unusually robust when the tightening cycle began, giving a long tail to fundamentals. The quality of the IG/BB market has improved since the Fed started hiking. Headwinds from debt costs were largely confined to the lowest-quality issuers.
Looking ahead, we think balance sheets' rate sensitivity is low. A wave of refinancing has helped to chip away at maturity walls. Interest coverage for floating-rate borrowers has stabilized and should improve as the Fed cuts. Debt-service ratios for high-grade companies could weaken but are unlikely to drive downgrades.
We expect a "sticky but shallow" default cycle, as distressed tails remain contained. Defaults in this cycle have been driven by high debt costs, rather than a "problem sector" or poor earnings. Lower rates will help. Further, defaults have been toward restructuring versus bankruptcies, dampening the negative feedback to the economy. The risk is weak recoveries for debt holders.
Tight credit spreads do not reflect euphoria, in our view. All-in borrowing costs remain high and have dampened corporate aggression. HY/loan markets have shrunk since Covid and LBO activity remains muted, while corporate leverage has flat-lined. We see tight spreads as a reflection of demand outstripping supply at attractive yields.
Credit markets have historically performed best when growth is in this "sweet spot." Spreads are tight, but we think they are supported by strong fundamentals, modest supply, and rapidly improving technicals. Volatility might remain high in the short term, but we stay constructive over the medium term.
… 5) Tight spreads do not reflect euphoria, overheating, or financial instability risks. Rather, we see them as a function of a demand-supply mismatch…
UBS: Real real rates
US July producer price data are due. Producer prices better represent corporate pricing power than consumer prices. (Consumer prices are a combination of the pricing power of retailers, and the power of imagination in devising owners’ equivalent rent.) This means the real fed funds rate is around 3% for companies—an unnecessarily restrictive rate…
Wells Fargo: Consumer Staying Power May Come Down to Credit
With excess savings depleted and a shaky jobs market raising doubts about future income growth, the role of credit is becoming a critical factor in the staying power of the consumer. We break down where credit is growing, where it is shrinking and the extent to which banks are willing to lend…
Yardeni: Is Oil Price Anticipating an Imminent War Between Iran & Israel?
The war in the Middle East may be about to widen. Consider the following:
(1) The Israeli intelligence community reportedly believes that Iran has decided to directly target Israel in retaliation for the assassination of Hamas Political Bureau Chief Ismail Haniyeh. That decision was made after an internal debate between the Iranian Revolutionary Guards (IRG) and the new Iranian president and his advisors. The IRG has been pushing for a more severe and widespread response than the April 13 attack on Israel. The president and his advisors advocated for a more limited attack.
(2) In a call on Sunday night, the defense minister of Israel reportedly informed US Defense Secretary Lloyd Austin that Iran is preparing a significant attack against Israel. Austin ordered that the USS Abraham Lincoln Carrier Strike Group, along with F-35C fighters, accelerate its transit to the Central Command area, bolstering the military presence already provided by the USS Theodore Roosevelt Carrier Strike Group. Additionally, the USS Georgia, a guided missile submarine, has been deployed to the region.
(3) If the attack happens and causes significant casualties and damage in Israel, the result might be an outright war between Israel and Iran with Israel targeting Iran’s oil and nuclear facilities. They would also target key officials of the Iranian regime.
(4) Oil prices jumped by more than 3% today suggesting an imminent widening of the war in the Middle East (chart).
(5) Our Energy sector overweight hasn’t played out as well as our overweights in S&P 500 Tech (Information Technology & Communication Services), Industrials, and Financials. Fortunately, at just 3.7% of the S&P 500 market capitalization, Energy is an easy sector to overweight in a portfolio these days (chart).
… And from Global Wall Street inbox TO the WWW,
Bloomberg: Reminder: Inflation still matters more than anything (Authers’ OpED)
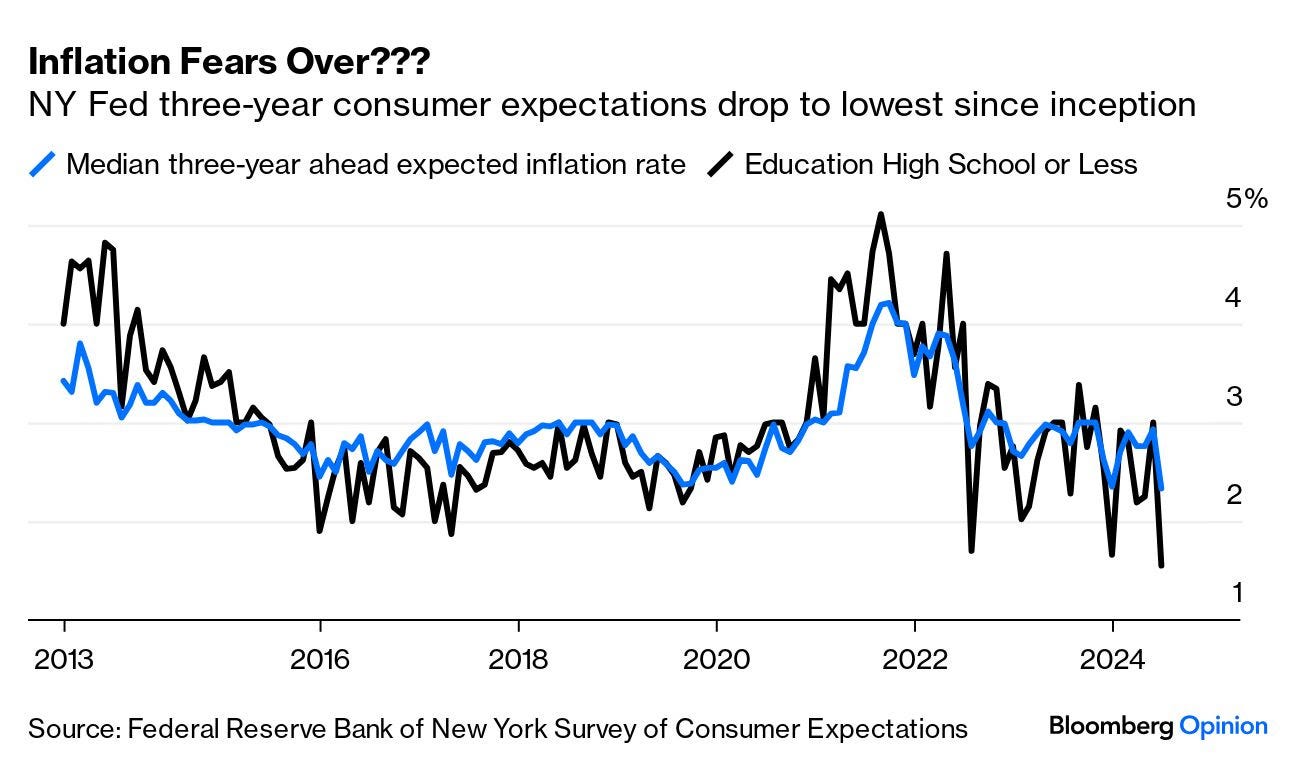
The calm that’s returned to markets could be upset by violent repositioning if a CPI surprise threatens rate cuts.… What’s perhaps surprising is that consumers are now overcoming their fears of inflation. Monday saw the publication of the New York Fed’s regular survey of consumer expectations, which is very closely watched by the policy-setters on the Federal Open Market Committee. The figures for three-year inflation were very surprising; the lowest expectations since the start of the survey in 2013, with the fall most marked among those whose education ended at high school or earlier (who generally suffer more harm from inflation than others):
There were no methodological chances last month that might explain the sudden dip. A fluke, or “noise,” in the data is always possible, but we’ll need to wait for next month’s survey to get any light on this. On its face, it suggests that consumers are suddenly very confident that inflation is coming down. The fact that the least-educated seem most optimistic is also, if this number isn’t a fluke, a very positive indicator for the Democrats in the November election. Shifting political probabilities might also change expectations on inflation and rates.
Turning to market expectations for the next three years, the breakeven level (where fixed-rate and inflation-linked yields would turn out equal) has also dipped frantically. It’s currently below 2%, which happens to be the Fed’s target, at a post-pandemic low:
All of this is consistent with a world in which the Fed decisively reassumes control and drives a soft landing with which all can be comfortable. As more or less nobody truly appears to expect this outcome in their heart of hearts, judging by the commentary whirling from all sides, the implied risks of surprises are real.
Hedgopia: Fed Should Just Say No To Fed Put
… Investors have been spoiled by the so-called Fed put, which essentially ensures the central bank steps in with expansionary monetary policy to put a stop to excessive declines in stocks. Alan Greenspan (1987-2006) dealt with the 1987 crash by committing the Fed’s “readiness to serve as a source of liquidity to support the economic and financial system”. Excessive liquidity creation is probably what caused the dot-com bubble and the housing bubble. His successors – Ben Bernanke (2006-2014) and Janet Yellen (2014-2018) – were no exceptions. This is evident in the parabolic rise in the Fed’s balance sheet and in the suppressed fed funds rate (Chart 3).
WisdomTree: Prof. Siegel: Calm Markets Amid Fed Uncertainty
Last Monday morning, I tried to shake up the conversation about how far behind the curve the Federal Reserve (Fed) is currently by suggesting an inter-meeting 75 basis points (bps) cut and another 75 bps cut in September…
… For those who worry about reigniting inflation, like during the 1970s, I have comforting news. The money supply growth during the 1970s never slowed down as it has now, it continued growing around 10% a year in that decade. Over the last 12 months, the money supply growth was only 1.5%, after going through a rare period of actual decline in 2021. We want money supply figures growing around 5% a year to reflect 2-3% inflation and 2-3% real growth in the economy. We are undershooting this target dramatically because the cost of borrowing set by the Fed is currently too high…
… THAT is all for now. Off to the day job…


