Good morning … And now for something completely different. A quote from one fo Global Walls most popular of popular kids …
… The most interesting theme of the day was a steady but notable global rates sell-off that, for example, wiped out nearly half of last week's -10.8bps fall in 10yr UST yields. There was no obvious catalyst so maybe thin trading played a part? -Jim Reid of DB (more below)
… Perhaps there was a bit of a need for a concession to take down this weeks front end supply before heading straight into month, quarter and in Japan, to the best I reckon, fiscal YEARS END. And they say common sense ain’t so common?
Once and awhile, an unexplained bond market selloff is easily explained? With that in mind and as the week presses on jam packed with front end supply (and so, some steepening impulse) and ahead of 5yr liquidity event aka (Treasury auctions) … a picture …
5yy DAILY: 4.40 appears to be ‘support’ and I’ll call ‘resistance’ somewhere down closer TO 4.15 which makes this mornings 4.22 just a touch below the middle of the triangulating range … daily momentum NOT much of an impulse either so a concession from here likely needed …
… while SOME pictures, they say are worth a 1000 words, this one, IMO, leaves plenty to be desired.
What then to make of this afternoons liquidity event? Leaning on yesterday’s 2yr auction …
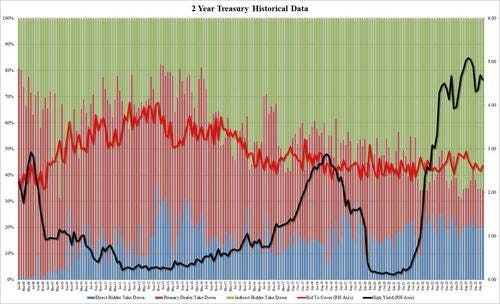
ZH: Stellar Foreign Demand For Record Big 2Y Treasury Auction Despite Modest Tail
… The internals were also solid with Indirects awarded 65.8%, the most since June 2023 (and clearly above the recent average). And with Directs taking down 20.8%, the most since Nov 23, Dealers were left holding 13.4%, or the lowest since last June.
Overall, this was an impressive auction with solid foreign demand, with the only modest negative the slight tail despite the concession as yields ripped higher into the auction deadline.
… as far as WHY might 2s have gone so well? Well, one idea …
ZH: "It's A Far Deeper Recession Than Publicized..." Dallas Fed Manufacturing Survey Screams Stagflation
… that AND continued push from Team Rate CUTS of whatever the narrative is to be based on … for somewhat more, see below from Apollo and … here is a snapshot OF USTs as of 705a:
… HEREis what this shop says be behind the price action overnight…
… WHILE YOU SLEPT Treasuries are modestly higher with the curve flatter amid a light tape (see above) and ahead of today's record sale of UST 5yrs ($67bn) and other data. DXY is lower (-0.17%) while front WTI futures are UNCHD. Asian stocks were mostly higher, EU and UK share markets are all green (SX5E +0.35%) while ES futures are showing +0.4% here at 7am. Our overnight US rates flows saw real$ buying out the curve off the earlier lows. Further in the curve, systematic types have sold the front-end while pushing 2s30s around 2bp flatter in doing so. Overnight Treasury volume was about average overall with 30yrs (130%) seeing some relatively elevated turnover this morning.
… and for some MORE of the news you might be able to use…
IGMs Press Picks: March 26 2024 (kindly note today’s 2nd item — FT story many are going to be chatting about)
…FT: US facing Liz Truss-style market shock as debt soars, warns watchdog Fiscal burden is on unprecedented path, says independent Congressional Budget Office chief.
NEWSQUAWK: US Market Open: Equities mostly firmer, Dollar lower and Gilts outperform after BoE's Mann; US Durable Goods due … Bonds incrementally firmer and Gilts outperform after BoE’s Mann
Finviz (for everything else I might have overlooked …)
Moving from some of the news to some of THE VIEWS you might be able to use… here’s SOME of what Global Wall St is sayin’ …
ABNAmro: US - Is inflation heating up again? We think not
Activity and jobs growth have slowed to a more trend-like pace in recent months. A couple of hot inflation prints have reignited market doubts over the disinflation path. We see little reason to think this will persist; on the contrary, pipeline price pressures remain benign. We continue to expect the Fed to begin lowering rates from June.
… Indeed, financial markets appear more worried about inflation than about downside risks to the growth outlook. Near-term market-based measures of inflation expectations have risen sharply since the start of the year, and markets now expect three rate cuts from the Fed this year, compared to almost six cuts back in January (we continue to expect five rate cuts). Inflation in January-February did come in on the firm side, although this followed some especially weak readings at the tail-end of 2023. The core CPI, for instance, rose 0.4% m/m in both January and February, which is around double the normal rate of price growth (though still far below the 0.7-8% readings at the height of the inflation surge). We did not see anything in the reports to suggest these firm inflation readings would persist. The strength was driven by three main factors: 1) pass-through from the recent jump in oil prices to some core components, such as airfares; 2) lumpy pass-through of earlier rises in housing rents; 3) possible residual seasonality in the m/m data (as Fed Chair Powell also suggested).
The bottom line is that pipeline price pressures still point to significant disinflation to come, especially from housing rents, with rents for new leases growing at rates below the pre-pandemic trend already for the past half year…
BNP Quant Trades of the Week: Buying for now, expansion later: Short USD, long duration (coincidental this idea of long duration comes as month and quarter comes to a close…)
KEY MESSAGES Market Themes:
The markets have moved to BERT’s "Buying assets" regime, which tends to be characterised by a positive performance of risk assets, higher bond prices, a weaker USD and lower volatility.
The USD appears overbought and German 10y yields appear too high, according to our models. We favour long GBPUSD, short USDIDR and long duration.
The US data outlook is improving. Data surprises have returned to neutral and loose financial conditions are a tailwind. Data in April could trigger a return to BERT’s Expansion regime.
DB: Early Morning Reid (recap of bond move AND of some Fedspeak yest…)
… 10yr US yields closed +4.7bps higher at 4.25% with 2yrs +3.6bps at 4.63%. Markets also trimmed the amount of Fed rate cuts they are expecting this year by -4.7bps to 80bps. We also saw the expected probability of a June cut fall to 79%, down from nearly 86% at the peak last week. It was real yields that drove the sell-off, with the 10yr real yield up +5.9bps after falling for the previous four sessions. The yield increases levelled off following a decent 2yr auction. Bonds totaling $66bn were issued 0.5bps above the pre-sale yield, but with the indirect bidder share reaching its highest level since June. We still have $110bn in Treasury supply to come this week, with a record $67bn 5yr auction later today, so something to keep an eye on…
… There was some Fed speak of note with a little caution expressed regarding expectations of Fed cuts. Atlanta Fed President Bostic repeated weekend remarks that he now expected only one rate cut this year (versus two before), suggesting the Fed could be patient if the economy was holding up. Meanwhile, Chicago Fed President Goolsbee said he continued to see three rate cuts in 2024 but highlighted the need to see housing inflation moderate more. And Fed Governor Cook noted that “fully restoring price stability may take a cautious approach to easing monetary policy”. While being mostly consistent with Powell’s narrative last week, these comments underlined the upward narrowing of end-2024 rate expectations we saw in the FOMC dot plot last week (even as the median dot was unchanged at three cuts).
Goldilocks: Core Services Ex-Housing Inflation: Back on Track After a January Bump (phew, thats great news … inflation scare OVER …)
The core PCE services ex-housing price index rose 0.6% in January (vs. 0.2% on average in 2023H2), raising the year-on-year rate to 3.5%. While we attribute much of the pickup to a one-off “January effect,” the firmer inflation numbers at the start of the year have sown doubts about whether last year’s downward trend will continue. In this week’s Analyst, we revisit our component-level assumptions and explore the scope for core services ex-housing inflation to continue and its implications for the core inflation path…
…Taken together, we expect 2024 core services ex-housing inflation to decline modestly to 3.3% year-on-year by the June FOMC meeting and to remain there in December before falling to 2.6% by December 2025. We expect overall core PCE inflation to reach 2.4% by the June meeting and to remain there in December before falling to 2.0% by December 2025. Our forecasted path—or even a somewhat higher path—should be good enough for the FOMC to deliver the first rate cut in June.
UBS: March Nowcasts Suggests Inflation Continues to Hold Firm (firm inflation means WHAT then for Team Rate Cuts?)
… UBS Evidence Lab Nowcast expects the core CPI to increase 0.33% m/m in March, higher than the US Economics team's preliminary estimate of a 23 bp increase. Major components such as used/new car pricing, lodging and airfares all tracking relatively stable vs. last month. Rents continue to increase m/m, but at continuing stable rate. The Nowcast points to a headline CPI SA m/m increase of 0.37% driven by relatively stable food, but higher energy prices this month. The US Economics team's preliminary estimate for headline CPI is a 24 bp increase. Preliminary estimates for retail spending, ex-autos and ex-gas is expected to decline 0.1% m/m this month
UBS: State-by-state recession indicator still elevated (another defense for Team Rate CUT)
Weighted by labor force size, 42% of U.S. states are breaching Claudia Sahm's eponymous recession rule. — a level unseen outside NBER-sanctioned recessions.
The Sahm Rule says "recession" in an elevated share of U.S. states
Summary Strengthening Trend Still Largely in Place
New home sales dipped 0.3% to a 662K-unit pace during February. The slight decline occurred against a backdrop of mortgage rates creeping higher during the month. Despite easing a bit recently, affordability is still a major constraint on homebuyer activity and the edge-up in financing costs looks like it was enough to discourage transactions. More resale inventory coming to market also may have cut into sales during the month. All that being said, a strengthening trend largely remains intact, with sales up 5.9% on a year-over-year basis in February. Moving forward, a structural shortfall of available single-family homes as well as home builders' ability to bridge the affordability gap with price incentives should continue as tailwinds and support an improving sales pace this year.
… And from Global Wall Street inbox TO the WWW,
Apollo: Incoming Data Suggests Monetary Policy Is Not Restrictive (ie CUTS are not easings …)
The best guide to whether monetary policy is restrictive is not r-star but the incoming data. The incoming data shows that after the Fed turned dovish and the stock market rallied, we have in January and February seen strong employment growth, low jobless claims, and upward pressure on CPI and PPI inflation.
Maybe the lagged effects of Fed hikes work after 12 to 18 months through income in the consumption function. However, the effects of easy financial conditions on consumer spending are immediate. Given that financial conditions have eased significantly over the past five months, with record-high stock prices, tight credit spreads, and rising home prices, it is not surprising that the incoming economic data is strong.
The bottom line is that the last mile is harder because of the immediate positive impact on the economy of record-high stock prices. In contrast, the long and variable lags work mainly through a rising unemployment rate.
In short, the long and variable lags of monetary policy have been overwhelmed by the 25% increase in the S&P 500 since November.
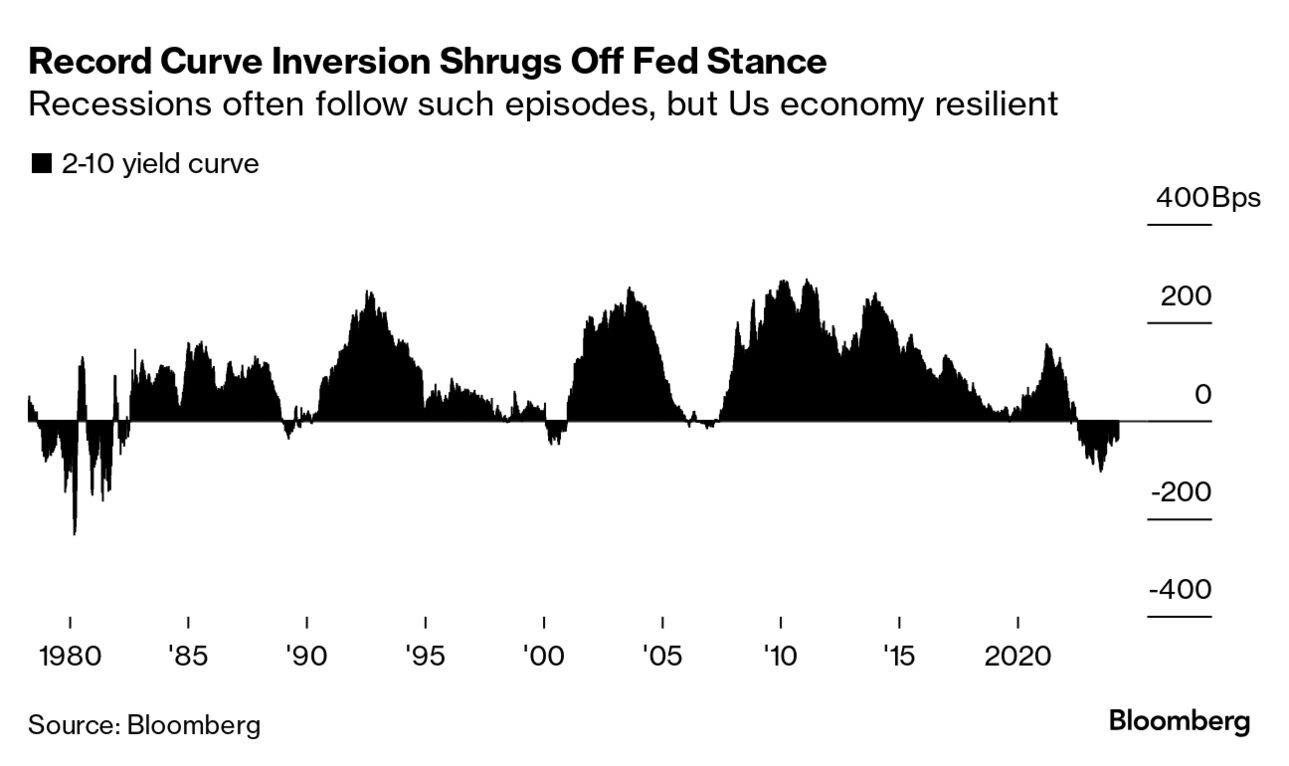
…The classic US yield curve just set a record for the longest stretch ever with 10-year yields below those on two-year notes. The inversion has persisted for more 430 trading days and counting, surpassing the previous longest stretch, which ended in May 1980. While previous such episodes mostly preceded recessions, this one is becoming notable for the way that even a very deep and very long inversion has yet to be accompanied by obvious signs that the US economy is heading for contraction.
That’s meant so-called steepening trades — bets that shorter-dated notes will outperform longer-dated peers — haven’t done all that well with two-year yields remaining elevated. The curve seems stuck at around minus-40 basis points, even after Federal Reserve policymakers gave a pretty clear signal that the gap between the two yields should start to close.
The Fed stuck with its projections for 75 basis points of interest-rate cuts this year, a boon for two-year notes. And it raised its dot plot for next year, as well as increasing both its growth forecasts and its estimate of the long-term cash rate. Admittedly, inflation estimates remained contained, but Chair Jerome Powell also stressed the likelihood that yields will remain higher than in the pre-Covid era. All of that argues for stickier longer-end yields and a steeper curve. So far, however, that isn’t what the market is delivering.
… The economy is still chugging along, and the Fed also raised its estimate of gross domestic product (GDP) for this year to 2.1% from 1.4%, which I believe is much more realistic. Deflationary forces are easing, and conditions are definitely easier on all fronts—including the weekly bank deposits which look to be increasing again. We’ll confirm this with the M2 money supply later this month. The upward momentum for the market should continue—even if you think the market is over-valued, it is hard to fight this powerful trend over the short run and even medium term …
A Liz Truss style bond market disruption for the US sure sounds ominous....although she certainly proved INCOMPETENT on many fronts (Ukraine, Economics). I've read/listened to interesting analysis that Truss-bashing is more about blaming UK/EU economic issues on Brexit & conservatives (FAR Right OMG!), than the more logical culprits such as debt, migration, deindustrialization, overregulation, yada yada good day all!
Prayers & more for Baltimore, and all you East Coasters considering the nightmare supply chain issues incoming. If our CA fires are any indication, recovery will be MUCH swifter than expected, the miracle of Capitalism & Stimulus I suppose.