Good morning … an interesting story crossed yesterday and I’m not sure which team (Rate CUT or other guys) can / will claim …
AP: Target to lower prices on thousands of basic items as inflation sends customers scrounging for deals
… and with that DE / DIS / IN flation in mind, I’ll kindly ask you to make something outta this one …
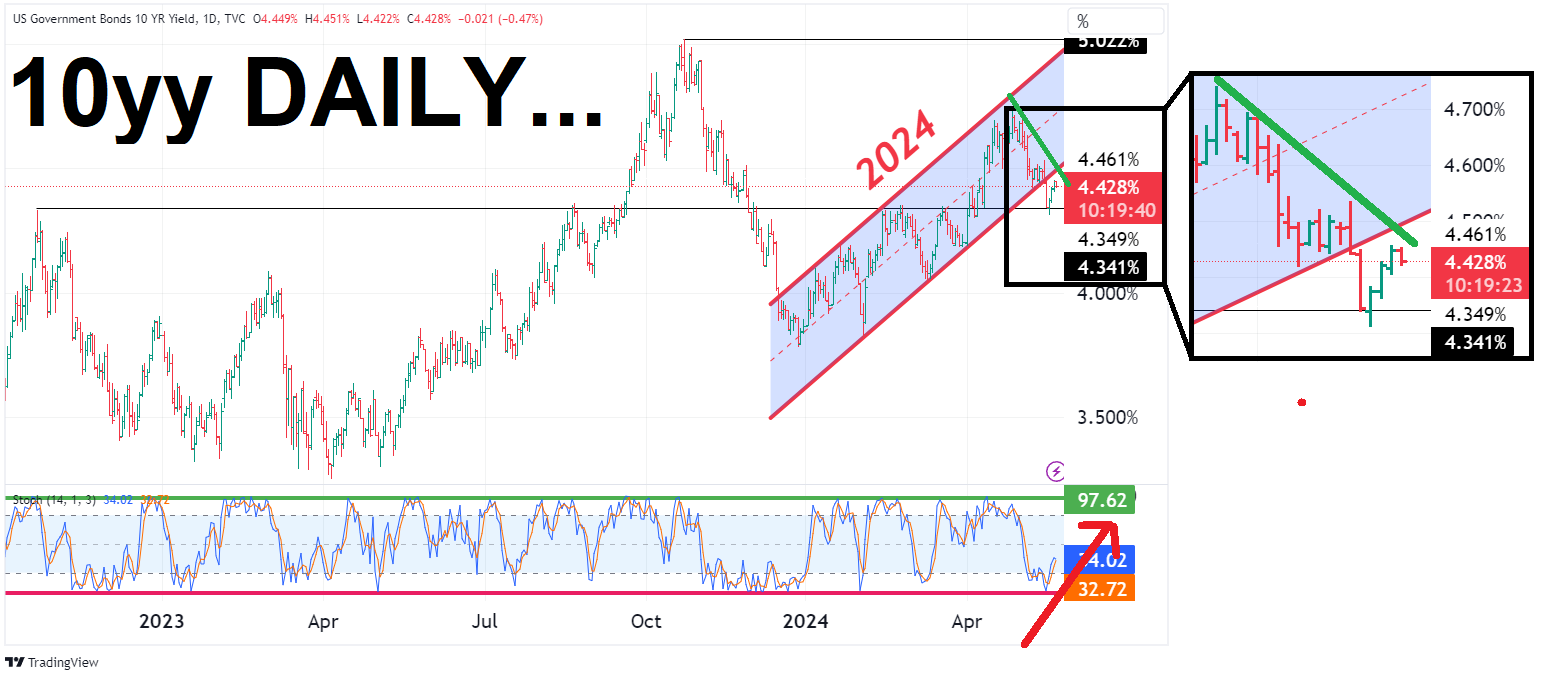
… see what you wanna see? Bullish channel break, bearish momentum or forget daily and turn to whats sure to be more bullish weekly / monthly? One thing for sure is that yesterday once clock struck 4p, folks were asked to hand in their Dow 40,000! hats and whether or not that matters is, as always, up to you … I will quit while I’m behind having NOTHING to add ahead of the first official Hamptons Hedge of the year, Friday and so … here is a snapshot OF USTs as of 705a (from a source other than my usual due to some technical difficulties which means i’ve less confidence IN this price / yield snapshot but … here goes):
… AND for whatever it’s worth, trialing the above from TradingView, a side-by-side with my usual source …
… not bad for free and you know that saying (apparently TGT does), if its free its for me and … I’ll move on … HEREis what this shop says be behind the price action overnight…
… WHILE YOU SLEPT Treasuries are slightly higher after a range-bound trade during the Tokyo session, with volumes still depressed. Sociable front-end buying appeared to be going through with modest steepening seen into London hours, with a curve steepener block (9k TU vs 2.5 US) posted around 2am. Another block 3.3k buy in TYs was seen prior to a thin UK/EU calendar (the 19y Gilt and 5y Bobl auctions went fine, despite a small tail in the former). Crude oil is -1.3%, while the some of the shine has come off in the metals space: XAG -0.5%, BCOM -0.4% HG +0.2%). Equity index futures are close to flat in the US (ES +1pt), while the DAX is lower (-0.5%) after some weakness in APAC bourses overnight (SHCOMP -0.4%, HSI -2.1%, NY -0.3%, KOSPI -0.7%). UST volumes are running 50-60% the 30d average.
… and for some MORE of the news you might be able to use…
NEWSQUAWK: US Market Open: European bourses slip whilst US futures hold flat, DXY softer and Crude subdued; Fed speak due … Treasuries are flat, whilst Bunds narrowly outperform following softer than expected German PPI before coming off best levels amid higher EZ Labour Costs Prelim data … USTs are flat trade with the recent slew of Fed speakers unable to have any meaningful sway on price action in what has been a quiet start to the week. For now, the Jun'24 contract is holding above the 109 mark and within yesterday's 108.30+-109.09 range.
… Rates: Fair thee well US: US rates now appear fair to us. We still recommend clients trade the 4-4.5% 10Y range tactically from the long side. We await better opportunities to add duration.
… Bottom line: We now see US rates as close to fair and are neutral duration. We continue to believe clients should be aiming to be trading a 4-4.5% 10Y range, adding to duration near or above 4.5% & lightening duration exposure at or below 4%. The current environment is very supportive of carry trade type structures. Trading the rate trough is easier than timing of cuts or pace. Liquidity regs are likely coming, which should support short-dated USTs.
BARCAP Long & Short of It: A Second Wind (from an equity report …)
Long-only equity exposure no longer historically extended; hedge funds emerged as dip buyers through 1Q earnings; systematic funds rebuilt equity longs post-April sell-off with room to add further; retail investor sentiment on the rise but no meme stock fever; MFs stay heavily overweight Big Tech while HFs lean cyclical.
… Long bond futures positioning back to all-time highs Asset managers increased their long 10Y Treasury futures positions to all-time highs after some unwinding in Q1, probably as the US macro outlook remains uncertain. Similarly, the outsized positioning in short speculative bond futures by macro hedge funds (reflecting a highly levered basis trade motivated by the vastly increased supply of Treasuries stemming from Fed QT and deficit financing) unwound through the end of March before leveling out last month.
The G10 monetary easing cycle is broadening as the ECB, BoE, and BoC are all likely to cut rates in June. The Fed will not be in the first wave of cutters because of the 2024 inflation pickup, and risks to our forecast of two cuts this year (July and November) remain skewed to the later side even after the relatively benign April CPI. Nevertheless, the US adjustment is on track with both (harmonized) core inflation and labor market tightness in the middle of the range of G10 economies despite much stronger US growth (at least until recently). Once the Fed does cut, the biggest opportunities for investors may well be found in EM, where real policy rates are now in very restrictive territory as central banks remain (excessively) fearful of depreciation vs. the US dollar. China’s solid overall performance masks large gaps between sectors, with accelerating growth in industrial output but also accelerating house price declines.
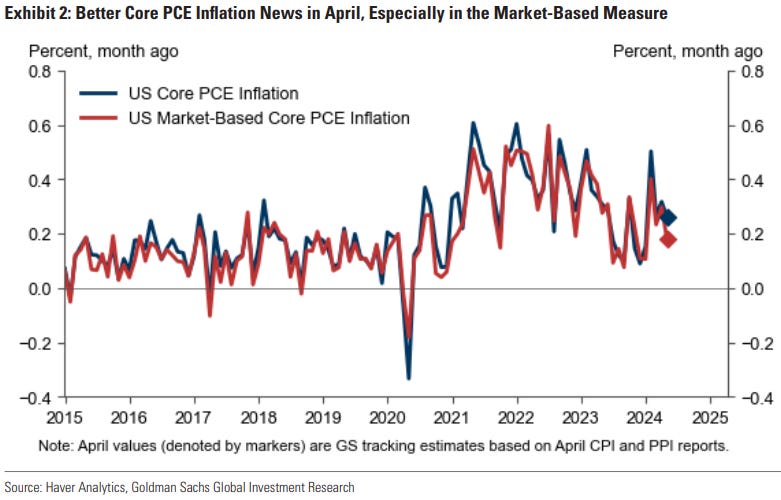
… 2. The Federal Reserve will not be in the first wave of cutters because of the pickup in sequential core inflation during Q1. How much of the damage was undone in April is a matter of perspective. Using CPI, PPI, and import prices, we estimate that core PCE increased 0.26% month-on-month, a pace well below the 0.36% average of the prior three months but probably not sufficient for a July cut if maintained in May and June. However, we also estimate that the market-based core PCE index—which was noted by Fed Chair Powell in a talk last week and which excludes imputed items such as portfolio management services and gambling—rose just 0.18%, a pace that would be quite consistent with a July cut if maintained. We continue to forecast cuts in July and November, but the timing remains sensitive to upcoming data.
…6. Not surprisingly given the weaker GDP numbers, there are now signs that US employment growth is slowing. Nonfarm payrolls grew only 175k in April, the unemployment rate rose to 3.9%, the jobs components of the ISM and S&P/Markit purchasing managers’ indices have fallen below 50, and the New York Fed Survey of Consumer Expectations shows a notable decline in job-finding expectations in the event of job loss over the past several months. This suggests at least some risk that the labor market could slow more precipitously in the remainder of the year, which would likely result in more aggressive Fed easing than the two cuts we project in our baseline forecast. This is one reason why our probability-weighted Fed call skews slightly dovish relative to market pricing, despite the upside risks from tariff-induced inflation in a potential second Trump administration in 2025.
Labor force growth is one of the primary determinants of an economy's potential rate of economic growth. The American labor force grew at an average annual rate of 1.8% in 2022 and 2023, considerably above its growth rate of the past decade.
Recent strength in labor force growth reflects, in part, strong population growth that stems from immigration. Foreign-born nationals, who currently represent about 20% of the labor force, have accounted for more than one-half of its growth over the past two years. A rise in the labor force participation rate (LFPR) from its pandemic-induced plunge has also supported growth in the labor force.
Looking forward, it does not seem likely that the labor force will continue to grow at the same robust rate that it has over the past two years. Although it is difficult to predict the path of immigration in coming years—yet-to-be-determined policy choices and economic conditions in the United States as well as in foreign countries will affect immigration flows—the aging of the population and marked drop in the U.S. fertility rate in recent years means that the “natural” growth rate of the workforce will slow.
There are some factors that could boost the LFPR further in the near term. More remote work could lift the participation rate, particularly for women with young children, as it has done over the past few years. Strength in cyclically-sensitive industries, which tend to be male dominated, could raise the LFPR rate of prime-age men. That said, the aging of the labor force will likely pull the participation rate lower over the longer-term.
On balance, we estimate that faster labor force growth over the next several years, via more immigration and labor force participation, could raise the potential economic growth rate of the United States by 0.1-0.3 percentage points per annum over the 1.8% potential GDP growth rate that was registered during the last decade.
That noted, there is uncertainty about whether the immigration boom will continue and whether more lofty participation rates will be realized. Additionally, potential GDP growth that is slightly above 2% rather than slightly below would still leave it well short of the +3% trend growth rate that prevailed for much of the second half of the 20th century.
We expect that the 10-year US Treasury bond yield will remain rangebound between 4.00% and 5.00% for the foreseeable future. We expect to see it more often below 4.50% (the mid-point of the range) than above it. This is consistent with our view that interest rates have normalized: They are back to where they were prior to the "Great Abnormal" period from the Great Financial Crisis (GFC) through the Great Virus Crisis (chart).
The 10-year nominal bond yield is equal to the 10-year TIPS yield plus the spread between the two yields, which is a widely used market-based proxy for expected inflation over the next 10 years. We expect that the TIPS yield will continue to hover around 2.00%-2.50% for a while as it did before the GFC.
We expect that the inflation proxy will continue to hover between 2.00% and 2.50% (chart). We observe that this variable is highly correlated with the price of a barrel of Brent crude oil. Barring a geopolitical crisis causing oil prices to soar, there seems to be ample supply of oil to meet global demand for now…
… And from Global Wall Street inbox TO the WWW,
Apollo: Could Housing Inflation Become a Problem Again? (hmmm, Team Rate Cut, over to you …?)
After the Fed pivot in November 2023, lower mortgage rates, rising stock prices, and increased activity in capital markets have put upward pressure on rents in Manhattan, see the first chart below.
Over the same period, easy financial conditions have boosted the housing market, with home prices currently up 7.3% over the past 12 months.
With this backdrop, the risks are rising that shelter inflation may begin to flatten out over the coming months and maybe even rise later this year, see the second chart.
The Fed will have to keep interest rates higher for longer to prevent housing inflation from becoming a problem again.
...Conclusion Supply chain disruptions emerged as a major issue as the economy began to recover from the pandemic recession and have been a key contributor to high inflation since then. As such, understanding and measuring supply chain disruptions are an important element in understanding inflationary pressures in the economy. Our supply availability indexes (SAIs) present a new gauge to measure such disruptions and have the advantage of being released early in the month as part of our regular regional business surveys, before many other indicators are available. Our May release, together with our supplemental survey, shows that supply disruptions are much less significant than a few years ago when there were significant imbalances in the economy, though supply availability has not been improving over the past couple of months. Our survey results indicate that many firms are raising prices due to supply disruptions at a time when there has been a lack of further improvement in supply availability, a troubling combination when inflation remains above the Federal Reserve’s inflation goal.
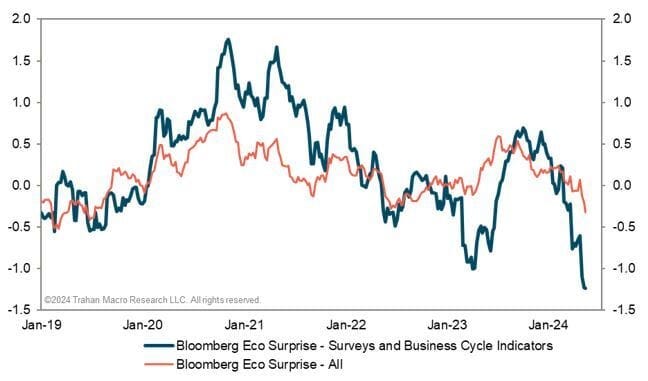
Macro Monday: Surprise! The Economy Is Getting Weaker!
U.S. economic data is coming in weaker than expected, which is having an impact on Fed policy and equity market leadership. Last week, we were treated to a trio of bad U.S. reports on retail sales, housing starts, and industrial production. All came in lower than expected for April and had their March numbers revised lower. For now, investors seem to be fine with the softer tone of the data, as they likely confirm the Fed’s first interest rate cut will arrive sometime this summer. But by the time economic data turns worse, as it’s been doing, it’s usually too late for interest rate cuts to have much of an effect. We note with interest the defensive leadership in the market of late, particularly the performance of Utilities and Consumer Staples in the wake of this run of disappointing data releases. Stock indexes may be at all-time highs, but the rally has a decidedly risk-off tone to it. This has historically been a sign that the good times are about to come to an end…
Inflation came in on target last week. Progress isn’t great but it was enough to ease concerns for the market – and maybe even for the Fed.
With earnings growth, employment and even Fed policy supportive of equities, we’ve seen new highs this week. The Dow Jones Industrial Average touched 40,000 on Thursday before receding slightly. So, can equities keep moving higher? To answer that question, we dug into the equity risk premium.
The equity risk premium is a historical gauge of excess returns that can vary over time and across markets. As an indicator, it is often used to forecast relative performance between stocks and bonds and we’re testing that theory in this week’s note.
… One inflationary risk that caught my attention is the behavior of commodity prices. While oil prices have dropped from their highs, other commodities like copper have experienced big price increases. This is partly due to anticipated demand driven by developments in technologies such as artificial intelligence (AI) and green energy investments, both of which require significant amounts of copper. AI could have some deflationary forces over time but right now the commodity demand is worth watching along with various supply deficits for some critical commodities.
Looking at the technical aspects of the market, there is strong momentum that supports further gains in the short term. However, the fundamentals and particularly this recent softness in real data present a mixed picture. I wouldn’t bet against the technical strength winning out in the short run. But it is important to monitor these fundamental economic developments closely, as they will play a crucial role in shaping the market expectations and central bank policies in the coming months.