while WE slept: USTs flat, contained, awaiting further direction; #Got7s?; record FF trading; 'testing the triple top' (10s vs 4.15% -BMO); JPOWs 'neutral hunters' -DB
Sep 25, 2025
Good morning … Equity futures and BOND YIELDS little changed as I work through inbox and askin’ … what’d I miss?
Last we met, there was a bearish lean and while the tonal direction might have been right, levels for dipORtunity (4.25 / 4.30), well, not so much … BULLISH channel remains intact and momentum appears to have moved swiftly up towards being overSOLD …
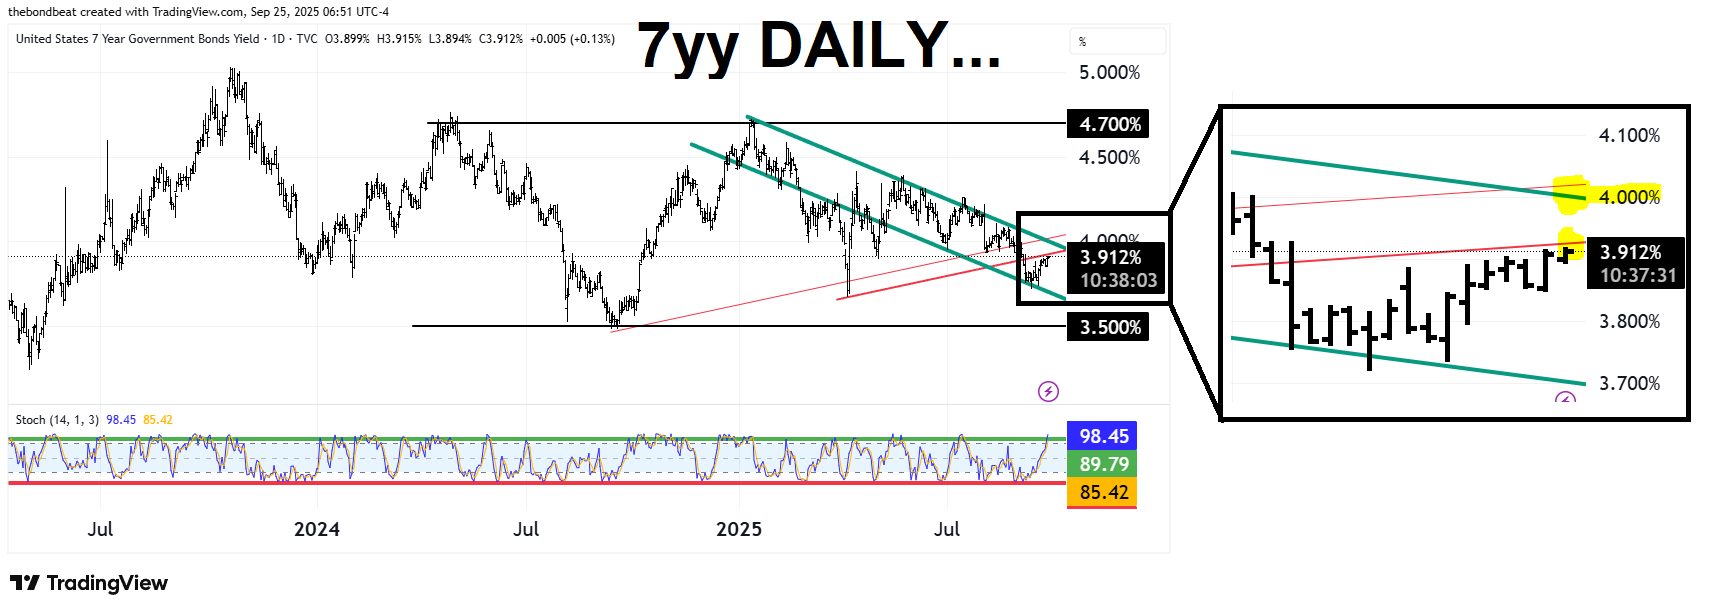
7yy DAILY: 4.10 middle of (4.70 - 3.50) range while 3.90, 4.00 TLINE significance…
… momentum (stochastics, bottom panel) look to be overSOLD and whether or not this is THE dipORtunity you have been waiting for, well is up to you and your PnL and view … it’s certainly A dipORtunity, if not THE one …
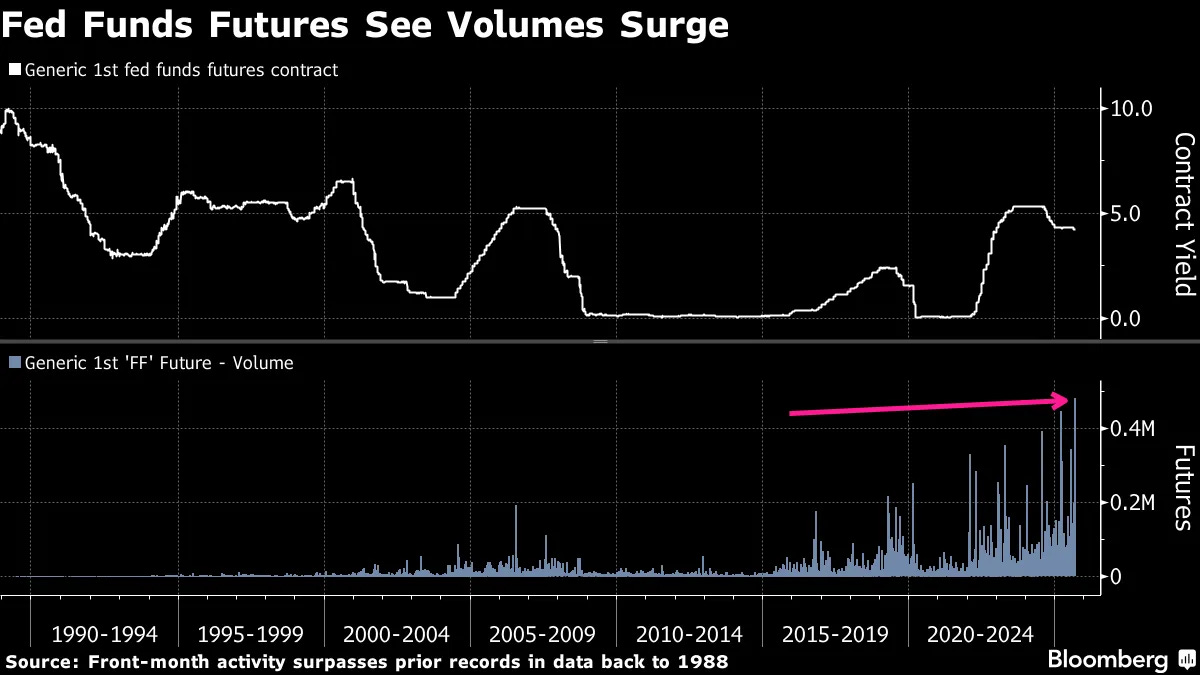
#Got7s? … Before heading TO the inbox, a quick word or two and a visual of impact / context of Fedspeak on FF trading from one of THE very best in the biz …
…Investors are piling into futures tied to the Federal Reserve’s benchmark overnight rate at a record clip amid the risk of strains in short-term funding markets at quarter-end.
Volumes in fed funds futures, which traders use to bet on the path of the Fed’s benchmark overnight rate, reached just short of 500,000 contracts in the September maturity as of 3:30 p.m. in New York. That level surpasses the previous record for the first generic contract set on April 3, when President Donald Trump’s sweeping tariff announcement roiled markets. The futures started trading on the Chicago Board of Trade in 1988.
The heightened activity comes as the effective fed funds rate, which represents where the benchmark is trading, rose on Monday — its first increase outside of a Fed policy change since 2023. The rare move triggered selling in futures tied to the funds rate and was seen as possibly pointing to tighter conditions in the repo market for overnight borrowing in the leadup to the end of the quarter.
“It appears as if this is a technical trade as it directly relates to month-end funding and financing of Treasuries, bills and balance sheet,” said John Brady, managing director at RJ O’Brien.
The effective fed funds rate rose one basis point on Monday to 4.09%, and it remained there Tuesday, New York Fed data show. It’s still solidly within the central bank’s 4% to 4.25% range, set last week when officials reduced rates for the first time this year. For the past two years, the metric has been stuck near the lower end of the band.
“Historically, the Fed preferred the fed funds rate in the middle of the target range,” Scott Skyrm, executive vice president at Curvature Securities, said in a Wednesday note. “With the current target range, that would be between 4.12% to 4.13%.”…
…The bulk of trading in the September fed funds futures on Wednesday was seen during the Asia session, where highlights included two 50,000-contract trades. The selling picked up again over the early US session as traders looked for a potential increase in the effective rate to 4.10% before month-end.
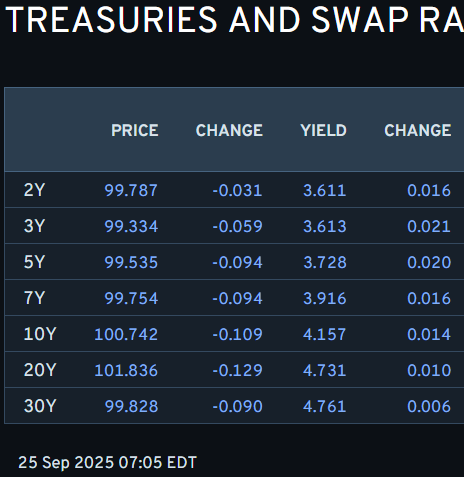
… Worth noting given overnight / asia trades in focus and with that in mind, lets get it on … But first … here is a snapshot OF USTs as of 705a:
… for somewhat MORE of the news you might be able to use … a few more curated links for your dining and dancing pleasure …
NEWSQUAWK US Market Open: Tentative trade ahead of a busy US data slate and a slew of Fed speakers … USTs are flat awaiting catalysts; Bunds are firmer amidst a subdued risk tone in Europe, Gilts little moved following a well-received tender … A contained start to the session for USTs as we await a packed afternoon and evening of US events. Firstly, weekly jobless data is scheduled and expected to rise to 235k (prev. 231k) while continuing claims, coincide with the BLS window for September, are seen lifting to 1.935mln (prev. 1.92mln). Last week’s better-than-expected claims (231.0k vs. exp. 240k) spurred a hawkish reaction, hitting USTs by around a full point over the course of one hour. There are also a slew of Fed speakers to keep markets busy.
Finviz (for everything else I might have overlooked …)
Moving from some of the news to some of THE VIEWS you might be able to use… here’s some of what Global Wall St is sayin’ … time/date stamped to best of my ability and quite possible I’ve missed plenty but here goes …
Housing. A SHOCKING number …
24 September 2025 BarclaysAugust new home sales: Shocking jump
New home sales posted an unexpected 20.5% m/m jump in August, to 800k, alongside a cumulative upward revision of 29k to sales estimates from May-July. The stronger-than-expected print most likely reflects easing mortgage rates and greater incentives from home builders.
Best in show with a recap of the day — for ME, outta pocket, an excellent read to catch back up …
September 24, 2025 BMO Close: Testing the Triple Top
…Wednesday’s weakness was more about the technicals and weight of supply (IG/UST) than the evolution of investors’ views of the macro fundamentals. Treasury yields spent the bulk of the session drifting higher, although the formation of a triple-top at 4.15% in the 10-year sector spoke to the support behind the market at current levels. Despite a solid short-term concession, the 5-year auction tailed by a modest 0.3 bp on slightly below-average end-user participation, an uneventful result in the context of recent auctions for the tenor. In an article published by the Financial Times, Chicago Fed President Goolsbee (2025 voter) expressed caution on further rate cuts by saying, “I’m uncomfortable with overly frontloading a lot of rate cuts on the presumption that [inflation] will probably just be transitory and go away.” Despite the recent pushback on the assumption that an October cut is guaranteed, STIR futures are pricing in a very high probability (93%) that the Fed lowers rates by another 25 bp next month. While we wouldn’t be surprised to see these odds come under pressure in early-October, we maintain that the remaining inter-meeting data will pave the way for the Fed to deliver another rate cut in five weeks.
For the time being, the flow of tradable information picks up on Thursday with eight Fed-speakers on the docket (Miran, Goolsbee, Williams, Schmid, Bowman, Barr, Logan, Daly). On the data front, investors will get their final look at Q2 GDP. Beyond the headline measures of growth, we’ll be focused on real final sales to private domestic purchasers, which was revised up to 1.9% (from 1.2%) in the second estimate of Q2 GDP. August’s durable goods report will help refine estimates for equipment investment within the Q3 GDP calculation. On the employment side, jobless claims will offer the most real-time assessment of the state of the US economy, although the current BBG consensus (234k) suggests that the update is unlikely to offer a signal that the slowdown in labor market conditions is accelerating.
Transitioning to the money markets space, the EFFR printed at 4.09% for the second consecutive session in a move that underpinned expectations for the fixing to be biased higher as the funding market faces month/quarter-end pressures. While the widening of repo spreads has thus far been contained in a longer-term historical context, the stability of the funding market bears watching in the near-term. Recall that last year, the SOFR-ON RRP spread spiked as high as 24 bp at the September quarter-end, and to 25 bp at year-end. This spread has been on the rise for the last three months in a sign that liquidity and funding conditions are under pressure, although the gauge remains a distance from levels that would be of true concern for monetary policymakers.
In other news, the risk of a government shutdown remains topical as there doesn’t appear to be a clear path toward reaching a spending agreement by September 30th. Recall that the last shutdown occurred under President Trump, who oversaw a record 35-day shutdown during his first term (December 22nd, 2018 to January 25, 2019). To be sure, a brief shutdown hardly presents a material risk to the US economy (i.e. real-GDP), although we’re reminded that bull steepening was the Treasury market’s reaction function to the 2018-2019 episode. If anything, the risk of a shutdown is consistent with a modest premium in the front-end, and a curve-steepening bias for the time being…
France with an interesting and funTERtaining note …
KEY MESSAGES We believe the Fed’s independence will remain in question for some time – including after the current political cycle.
For now, this will likely manifest as the Fed following an imbalanced reaction function – weighting employment risk over inflation risk.
A loss of independence does not necessarily lead to a loss of credibility. We think the Fed remains credible, for now.
The Fed Board using its legal authority assertively to fundamentally change how the central bank operates is the biggest risk to monitor, in our view. This outcome could cause the market to quickly re-evaluate the Fed’s credibility.
In this note, we model the expected market moves should the Fed lose its credibility.
Rates: We see 2s30s twist steepening 125bp and 3m30y swaption volatility 20-30bpv higher…
…Market implications We believe that markets now have very little risk premium embedded for a loss of Fed credibility. Steepeners in US rates are a well-held position, and USD puts are bid but are not at extreme levels. Further, because US term premium has thus far been relatively contained, we believe most macro positioning reflects the Fed’s move toward an imbalanced reaction function, rather than policy being set in a noncredible way. As such, if Fed independence is further eroded in a manner that increases risks of noncredible policy setting, we think markets have ample scope to move materially.
In this piece, we model the expected market moves should the Fed be perceived as setting policy in accordance with what the administration dictates, rather than macroeconomic fundamentals. We note that most of our modelling is linear, where in reality many of the moves can become non-linear and much greater than we model, especially if Fed credibility is lost suddenly.
Rates: Our analysis suggests that loss of Fed credibility could result in a 125bp steepening of the 2s30s curve. More specifically, we see this manifesting as a twist-steepening, with 2y yields lower to the tune of 50bp as 30y yields move higher by nearly 75bp.
While we are sympathetic to the view that breakevens could widen should markets lose confidence in Fed credibility, we doubt this would be the best trade, especially in the long end. This is because rising long-end yields would most likely be split between higher breakevens and higher real yields. As such, we see nominal yield curve steepeners as the best way to capture credibility concerns.
A perceived loss of Fed credibility is also likely to drive a 20-30bpv spike in 3m30y swaption volatility, bringing it closer to the Liberation Day peak earlier in 2025…
…Rates: Possibility of material twist-steepening Yield curve can steepen by 125bp: If our risk case materializes such that the Fed lowers rates irrespective of the economic trajectory, a severe twist-steepening of the UST curve could result, in our view.
Our analysis suggests that such a course of action could result in a 125bp steepening of the 2s30s curve, and a 2s10s curve steeper by 60bp. More specifically, we see this manifesting as a twist-steepening with 2y yields lower to the tune of 50bp and 30y yields higher by nearly 75bp.
We think markets are currently priced for our base case of a Fed that is credible but with an asymmetric reaction function. Even with various Board appointments in flux and the balance shifting toward nominees appointed by President Trump, markets have taken the news in stride, likely expecting that any new personnel will ultimately be more driven by data than by politics.
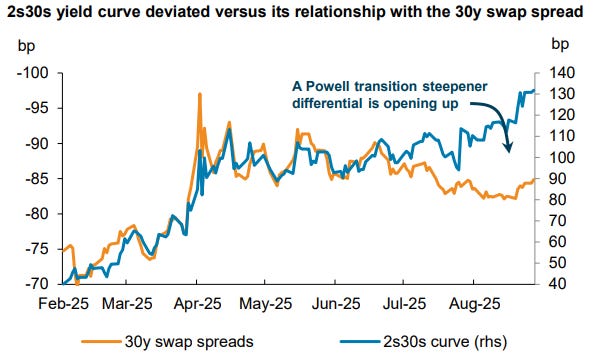
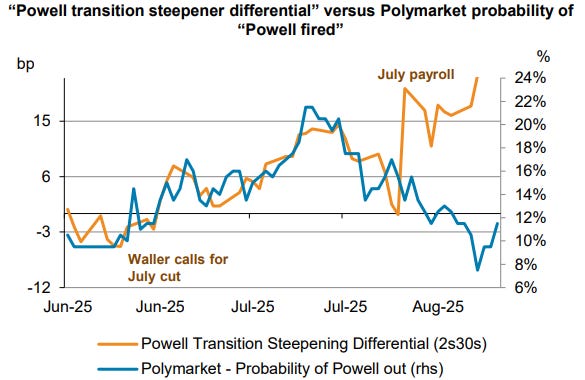
Our framework: To model how much markets could move in the more extreme scenario, we revisit price action from this summer, when such concerns were becoming more acute. To isolate these worries, we analyzed the deviation of the 2s30s yield curve versus 30y swap spreads in July (upper right chart).
The tight relationship in H1 2025 represented concerns about fiscal issues, where 30y yields rose versus 2y (i.e. steeper curve) and versus swaps (i.e. tighter swap spreads). A departure in July suggested a new driver for the 2s30s curve. If markets view politicization as a long-term inflation problem, we would expect to see 30y UST yields rise versus 2y yields but not versus swaps. For us, that explains why the 2s30s curve steepened while swap spreads remained flat.
We call this deviation between the 2s30s curve and swap spreads a “Powell transition steepener differential”. Our assessment that this differential reflects politicization concerns is evidenced by the gap starting to widen when Governor Waller called for 25bp cuts in July and peaking when “Powell fired” speculation reached its apex in betting markets (lower right chart). Moreover, the differential between the 2s30s curve and spreads widened further when Trump sought to remove Governor Cook.
A couple / few from that there large German bank …
…Risk assets have struggled to find their footing over last 24 hours, with the S&P 500 (-0.36%) posting another modest decline after the AI-driven selloff on Tuesday. Overnight futures have recouped around half those losses but it does seem that we’ve paused for breath in recent days. There hasn’t been a major catalyst driving this, but decent US housing data and stronger oil prices yesterday led to some doubts about the prospect of rapid rate cuts from the Fed. So that pushed Treasury yields higher across the curve, and there was a fresh yield curve steepening as Treasury Secretary Bessent called on the Fed to cut rates even more. Today’s US jobless claims are one to watch as last week saw a big fall, reversing the prior week’s spike higher. Since the FOMC and last week’s fall in claims we’ve seen a 10-15bps rise in 10yr US yields back close to pre-payrolls levels. So that and tomorrow’s core PCE will be important.
Back to yesterday and the noise around the Fed was there from the get-go, as Bessent said in a Fox Business interview that rates “need to come down”. Indeed, he said he was “a bit surprised that the chair hasn’t signaled that we have a destination before the end of the year of at least 100 to 150 basis points (lower).” So that’s a big contrast with the median dot from last week’s dot plot, which only pencilled in another 50bps of cuts by year-end. Bessent also offered a bit of commentary on the search for a new Fed Chair, saying that he was interviewing 11 candidates, and that there would be interviews happening next week. Meanwhile, existing Fed officials offered more measured signals. San Francisco Fed President Daly said further rate cuts were likely to be needed but stressed the need for careful decisions. And Chicago Fed President Goolsbee said in an interview that he was uncomfortable with “overly frontloading a lot of rate cuts” as inflation was “heading the wrong way” and the job market was still mostly steady.
Even as Bessent was calling for faster rate cuts, a couple of factors led markets to dial back their expectations for the months ahead. Notably, new home sales came in at an annualised pace of 800k in August (vs. 650k expected), marking the fastest they’d been since January 2022, back when rates were still at the zero lower bound. So that undercut the recent message of housing weakness that had driven some of the calls for rate cuts. Then in the background, Brent crude oil prices (+2.48%) closed at $69.31/bbl, their highest since August 1, which added to concerns about inflationary pressures, particularly with the tariffs as well.
That context meant that US Treasuries sold off across the curve. For instance, yields on 10yr Treasuries (+4.1bps) were up to 4.15%, with the 10yr real yield driving the bulk of that with a +3.5bps rise to 1.77%. At the front-end, the 2yr yield (+1.8bps) also rose as investors dialled back their rate cut expectations over the months ahead. Indeed, the amount of cuts priced by the June 2026 meeting was down -2.3bps on the day to 85bps. In Asia, Treasury yields are back down half to a basis point across the curve…
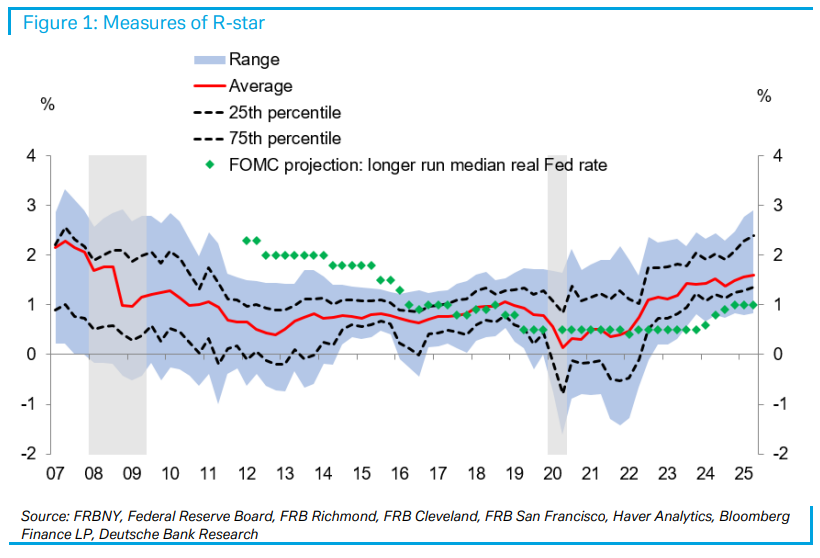
24 September 2025 DB: Jay Powell’s neutral hunters
With the Fed cutting rates by 25bps at the September FOMC meeting and signalling a few additional reductions over the coming months, the question of where policy is relative to neutral is increasingly pertinent. As we highlighted in a recent note, our updated and enhanced suite of r-star measures continues to point to a nominal neutral fed funds rate of 3.5-3.75% -- 50-75bps higher than the median SEP projection that continues to anchor monetary policy expectations for the Fed and market pricing (see “Widening our lens to yield a brighter estimate of r-star”).
We conduct a deep dive into one of the more intuitive measures of r-star in our dashboard – DB’s macro model (see “(R-)Star gazing: Macro drivers suggest real neutral rate may have risen”). We discuss the reasons why it has risen and how it could build an intuitive case for a higher r-star that is consistent with the other measures from our dashboard.
Our analysis reveals that higher r-star estimates are more about shifts in the supply-demand balance for savings than macroeconomic fundamentals, which have already normalized. This finding is consistent with the decomposition of canonical estimates from HLW and LW.
The underlying logic for a rise in r-star from this model is that, in contrast to the post-GFC period when savings demand was weak and supply was abundant, shifts in fiscal policies (in the US and globally), solid private sector balance sheets, and shifting demand for USD assets, among others, have changed the balance between supply and demand for savings. This shift supports at least a partial normalization in r-star relative to its pre-GFC levels, which we observe across nearly every metric included in our dashboard.
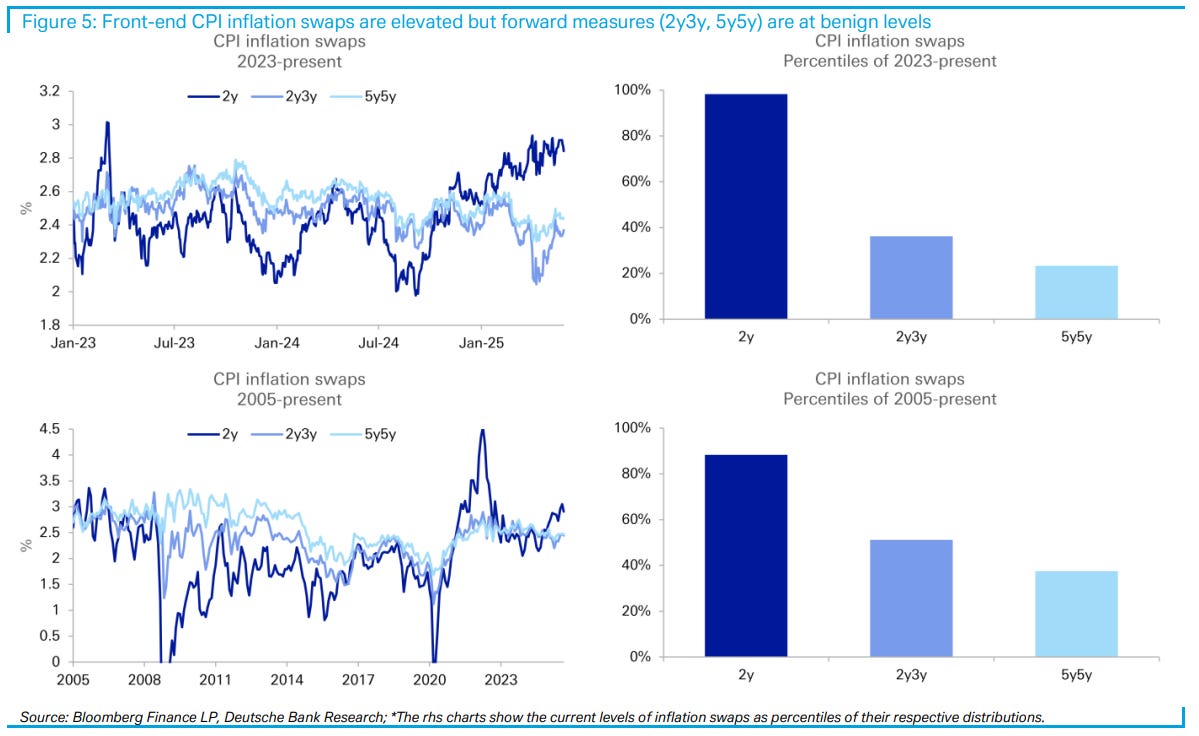
We published earlier today on market pricing around Fed independence, pointing out that despite all the focus in commentary, relatively little seems priced in the Fed path, breakeven inflation, or term premia.
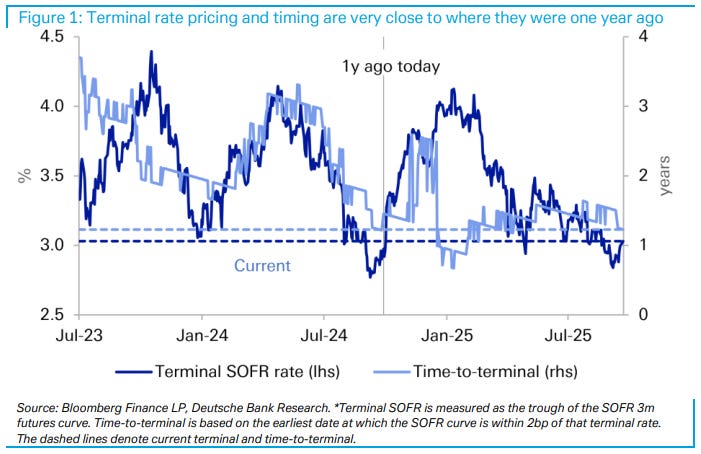
Today’s COTD reinforces the point on Fed pricing. It shows the history of the market terminal rate, measured as the trough in the SOFR futures curve, along with the time priced to reaching that rate, based on the settlement date of the futures contract associated with terminal (we take the earliest date at which the curve is within 2bp of the terminal rate, to allow for some noise in pricing).
The remarkable thing is that both – terminal rate and timing – are today almost exactly where they were one year ago. Terminal is around 3%, priced to be reached 1.25 years ahead. (Note: the big decline in time-to-terminal in December last year came from a relatively modest move in rates; because the SOFR curve was very flat at then, timing shifted a lot.)
The comparison isn’t exactly apples-to-apples. A year has passed, so although time-to-terminal has not changed the calendar date associated with it has pushed out by one year. And the fed funds rate is 125bp lower today than it was then, indicating a more gradual pace of cuts to terminal than was priced a year ago.
Still, it’s notable that the market isn’t pricing a notably lower terminal or accelerated pace of cuts given the focus on political pressures on the Fed.
23 September 2025 DB: Market pricing around Fed independence
Threats to Fed independence remain a central focus in US rates markets. But relatively little of this is priced in the Fed path, breakeven inflation, or term premia. It could be that, despite commentary, the market doesn’t anticipate a meaningful inflationary change in the Fed’s reaction function. Alternatively, market signals may be obscured by other offsetting downward pressures on rates, including possible administration policies to contain yields.
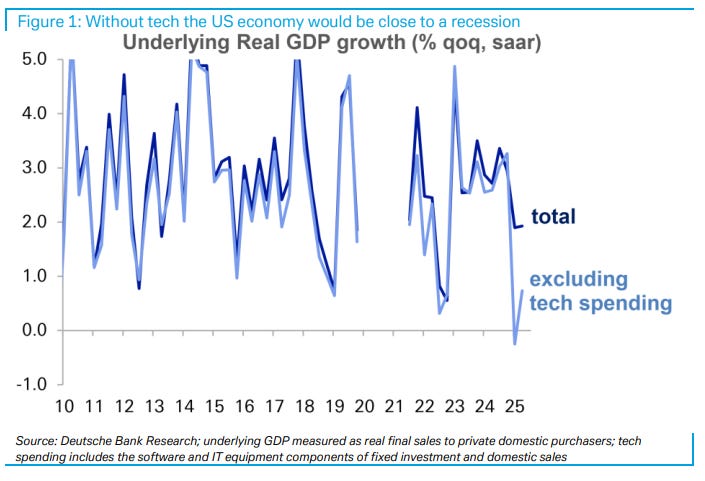
The “god from the machine” descended on to the Ancient Greek theatre stage to save the protagonist at a time of need. And so it is that AI machines - in quite a literal sense – appear to be saving the US economy right now. The chart below from our equity colleagues shows that in the absence of tech-related spending, the US would be close to, or in, recession this year. This spending is of course related to the massive capex boom taking place to build up AI infrastructure, and appears to be the missing ingredient to multiple macro puzzles, namely:
The massive slowdown in employment growth that is typically accompanied by recessions but in this instance is being compensated by AI-driven capital deepening that doesn’t need any workers;
The surprising resilience of global trade, especially in tech-heavy North Asia that somewhat ironically has been turbocharged by the trade war as chips have been exempted from tariffs thereby encouraging massive front-loading;
The discrepancy between sentiment indicators on capex, which cover the broad economy, versus the highly concentrated data center investments making for a two-speed investment cycle;
The massive outperformance of tech earnings in the S&P 500 and the ongoing concentration of performance in the mag-7;
The continued softness of inflation as broader demand conditions remain weak;
The good news to all of this is that the AI super-cycle may be helping mute the negative demand (tariffs) and supply (immigration) shocks hitting the US economy right now. It may not be an exaggeration to write that NVIDIA – the key supplier of capital goods for the AI investment cycle - is currently carrying the weight of US economic growth…
22 September 2025 DB: Widening our lens to yield a brighter estimate of r-star
Updating and enhancing our past work (see A constellation of (r-)stars and How positive r(*) you?), we present the latest results from our r-star dashboard. This tool synthesizes the signals from 13 different measures of r-star (up from nine in our last update) inferred through market pricing, term structure models, economic fundamentals, and other approaches.
After adding four new estimates -- two from macro models and two from term structure models -- our latest estimates find that r-star remains elevated relative to its pre-pandemic values. While the range is wide – current estimates span from 0.8% to 3.0% -- the latest average estimate is 1.7%. That is more than double its average value between the GFC and the pandemic (~0.7%).
This average reading remains significantly above the median from the Fed’s SEP, which stayed at 1% real (3% nominal) in the September SEP (see Sept. FOMC recap: United on risk mgmt, divided on the rate path). This gap in neutral estimates is an important driver of our more hawkish view on monetary policy than the Fed’s median projections and market pricing, which both see the Fed cutting towards 3% over time.
22 September 2025 DB: Global Economics: The Monthly Flyover
This new Global Economics monthly is designed as a concise, one-stop resource, offering a single-page briefing for each of the world’s most important countries and regions. Our aim is to provide you with a clear overview of the current economic landscape and the key macro themes shaping global markets. This will fill the gaps between our more detailed bi-annual World Outlook…
…In this first edition, we assess how the macro outlook has evolved since our last World Outlook in June. The US has led better-than-expected global growth outturns and we make another upgrade to our US outlook with this note. Fed easing has overtaken tariffs as the top global macro theme, but several other key drivers will be at play across major economies in Q4, from the impending stimulus in Germany to inevitable rate hikes in Japan and China’s anti-involution push.
…United States Growth: We remain constructive on US growth. After dipping in response to the trade shock (1.9% annual/annual / 1.7% Q4/Q4), we see growth at or above potential in 2026 and 2027 (2.0 and 2.2% Q4/Q4, respectively). Near-term challenges include weak hiring, trade policy uncertainty and squeezed real incomes. But there are many supportive factors: easy financial conditions, fiscal support (incl. tax refunds), Fed rate cuts, and AI-supported productivity gains.
Labor market: The labor market is expected to weaken modestly through yearend, with unemployment approaching 4.5%. Payroll gains have slowed, reflecting both softening demand and immigration-constrained labor supply. The economy may only need ~50k jobs / month to keep the unemployment rate steady. While risks are present if low firing dynamics change, we anticipate overall resilience.
Inflation: Core inflation is projected to rise further in the near term, primarily due to tariff pass-through to core goods prices. Recent PPI data show intensifying pipeline inflation, consistent with an extended lift to consumer prices into 2026. We expect core inflation to remain 0.5pp+ above target through next year, before declining towards 2% in 2027.
Fed: We expect the Fed to cut by 25bps in October and December, which would leave the fed funds rate near our neutral estimate of 3.5%. If near-term data for the labor market and inflation surprise to the upside, however, the Fed could skip a meeting this year. While we currently do not have additional cuts in our forecast in 2026 given that our economic forecasts are inconsistent with rates below neutral, risks are skewed towards more reductions next year.
Risks: Recession risks are close to historical averages. Downside risks include higher layoffs, which would undermine consumer spending. Upside risks involve AI replicating the 1990s productivity boom, with plausible estimates of a 0.5- 0.7pp annual boost to growth. Inflation risks are skewed upwards due to greater tariff pass-through and a Fed that could pursue a more dovish reaction function.
US rates sell off 3-4bp amid strong corporate credit issuance; US equities pare recent gains; Czech CNB remains on hold; weak Germany ifo survey; oil prices rise further on low inventory with geopolitics in focus; DXY at 97.87 (+0.6%); US 10y at 4.148% (+4.0bp).
…US rates sell off 3-4bp across the curve on the back of strong corporate credit issuance. During the New York session, Oracle sells $18bn in IG bonds, with the size of the issuance (second highest this year) coming as a surprise. The sale garners ~$88bn in reported demand, with maturities ranging from 5y to 40y. Treasury yields rise across the curve as market participants seemingly look to hedge exposure. The front-end move is potentially supported by remarks from Chicago Fed President Goolsbee urging caution on further rate cuts. The belly of the curve underperforms after an adequate 5y auction, which tails 0.1bp on tepid demand, with high allocation to primary details…
We see this “everything rally” persisting for now given how unusual this cycle has been, even as stock-bond correlations in prior cutting cycles says performance for the two assets diverge by the fourth Fed cut, i.e., about now. Still, given rich risk asset valuations - stay owning quality.
Key takeaways
US stocks and UST returns correlations have again climbed to positive, but in a good way, with both equities and bonds doing well in an “everything rally”.
Easing into a weak macro makes the case for bonds to rally, but not for stocks; stock-bond returns correlations should turn negative, but they are not today.
Prior cycles saw stock-bond returns correlations fall to negative by the fourth Fed cut, i.e., performance for the two assets typically diverge about now.
But more so than any other cutting cycle, macro is not the market, meaning the “everything rally” can persist for a while.
Still, given rich risk asset valuations and a chance we return to an “everything sells off” regime, we recommend owning quality across the board.
Exhibit 1: During a Fed-cutting cycle, stock-bond performance correlations tend to fall or stay negative — but this time, it’s different
The US releases revised second quarter GDP data. The market consensus is for no change (given data quality problems, “no change” in the details may be unlikely). US growth has been distorted this year—export and inventory data swung wildly between the first and second quarters. Unfortunately, the fiction of annualization assumes that what happens in a quarter, however unique, is continually repeated. This exaggerates first quarter weakness and second quarter strength.
US August wholesale (and retail) inventories data offers interesting detail. Policy led to wholesalers, not retailers, acquiring inventory. Inventory surged in different sectors at different times. Early stockpilers are likely to have exhausted pre-tariff inventory, creating price pressures. Later stockpilers may not be under pressure yet.
Media reports signal complexity in global trade policies. There are suggestions the G7 and the EU will set a price floor for rare earths (which are not that rare), to encourage production outside of China. Meanwhile, US assistance to Argentina allowed that country to lift export taxes, encouraging China to buy more Argentine soybeans and continue its effective boycott of US soybeans.
US initial and continuing jobless claims data will get attention, as the Federal Reserve prioritizes weak labor markets over higher inflation. There are some Fed speakers, including the outlier Governor Miran.
From a rather large domestic home lender …
September 24, 2025 Wells Fargo: New Home Sales Surge in August Builder Incentives Boost Sales
Summary More Noise than Signal New home sales surprised to the upside and jumped 20.5% during August. The surge reflects slightly lower mortgage rates and an increase in builders offering buyer incentives.
Take the gain with a huge grain of salt. New home sales are prone to heavy revisions. A flat-ish trend in sales, similar to what has been evident all year, seems more likely.
The macro implication is inventories remain elevated relative to sales, which implies a reduced pace of single-family construction moving forward. This means residential investment should continue to drag on overall real GDP growth for the next few quarters.
…That said, some degree of improvement in August does seem plausible. Mortgage rates ticked slightly lower in both July and August. Against this backdrop, mortgage applications for purchase have gradually climbed, indicating stronger buyer demand. What’s more, builders also increased the use of sales incentives, which could have driven a stronger pace of sales.
Finally, Dr. Bond Vigilante …
Sep 24, 2025 Yardeni: Q3’s Earnings Season Is Coming
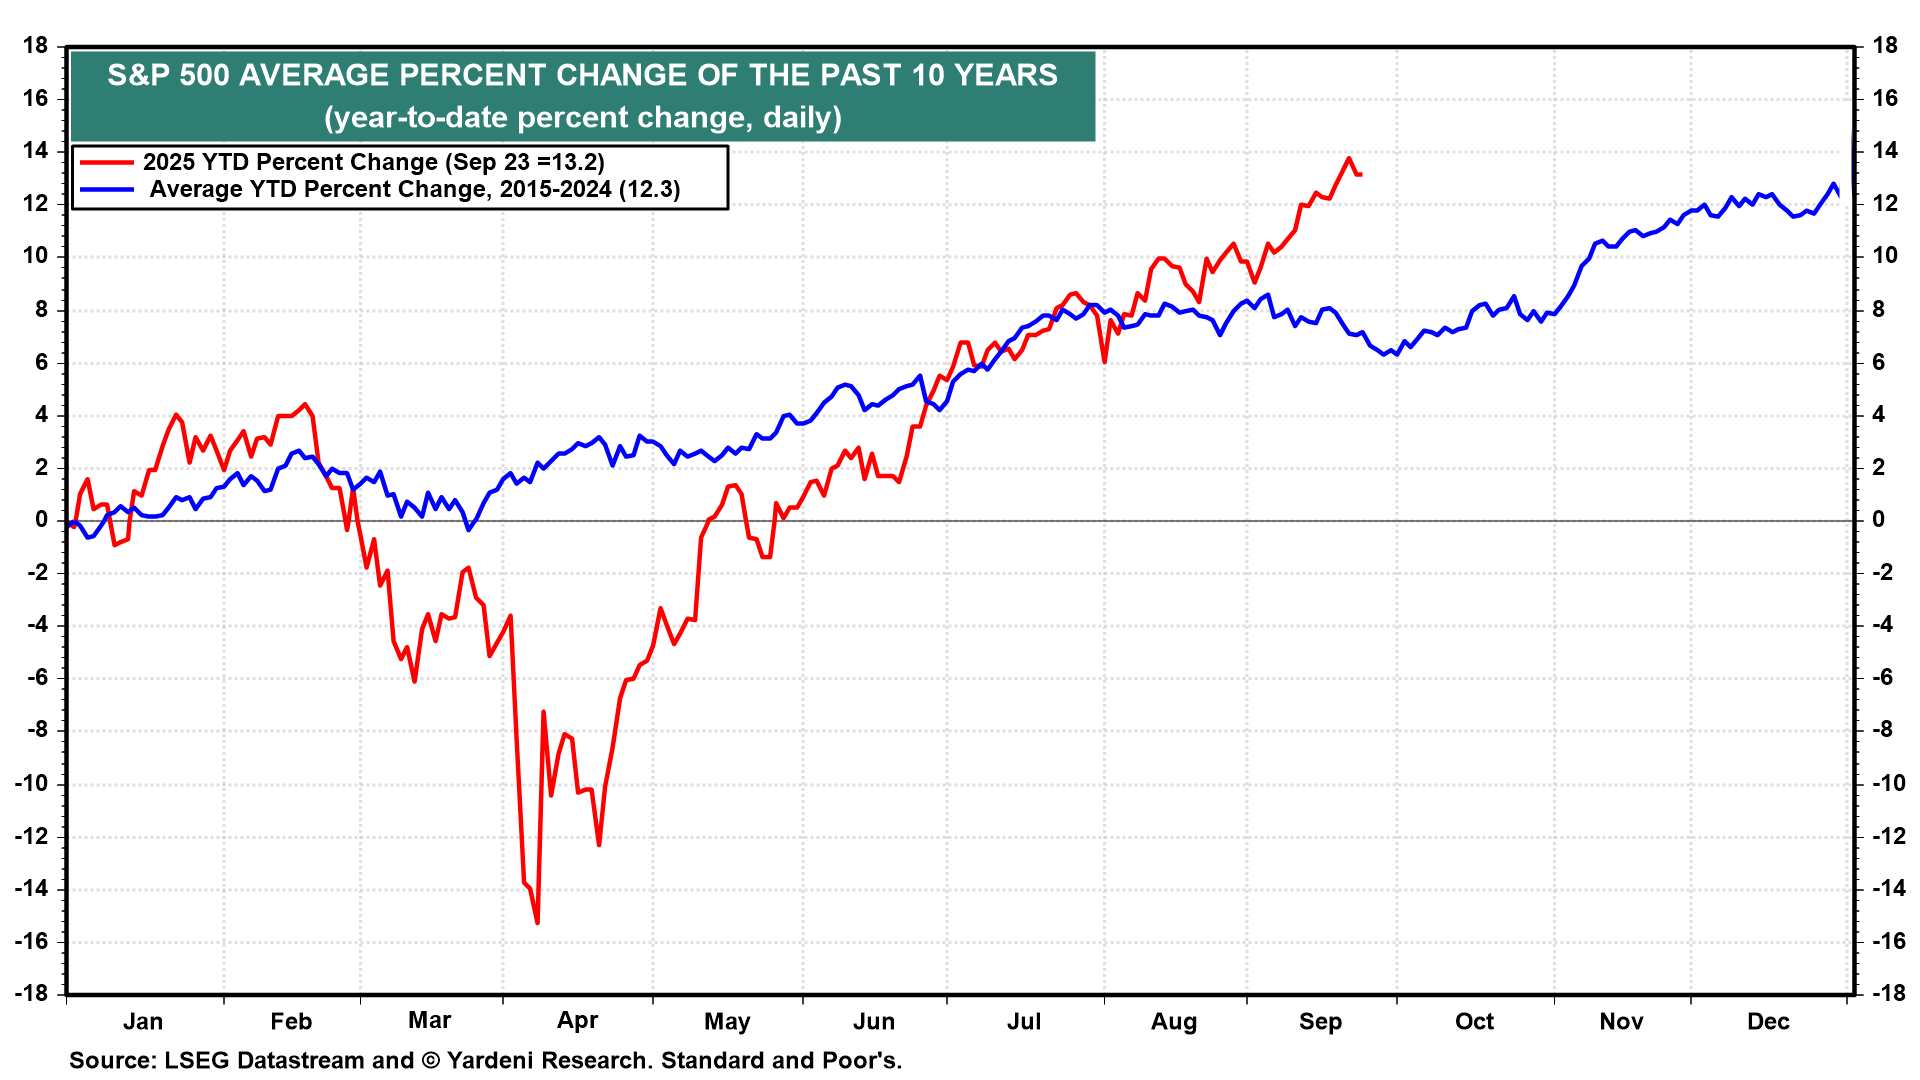
Before you know it, September will be over. It is likely to defy the month’s reputation of being a bad one for stocks (chart). Instead, the S&P 500 rose to a new record high of 6693.75 on Monday, September 22.
October has also experienced some painful stock market setbacks, although the month has often provided good buying opportunities following poor September performances. Q3’s earnings reporting season occurs in October. We expect it will be a positive one for the market.
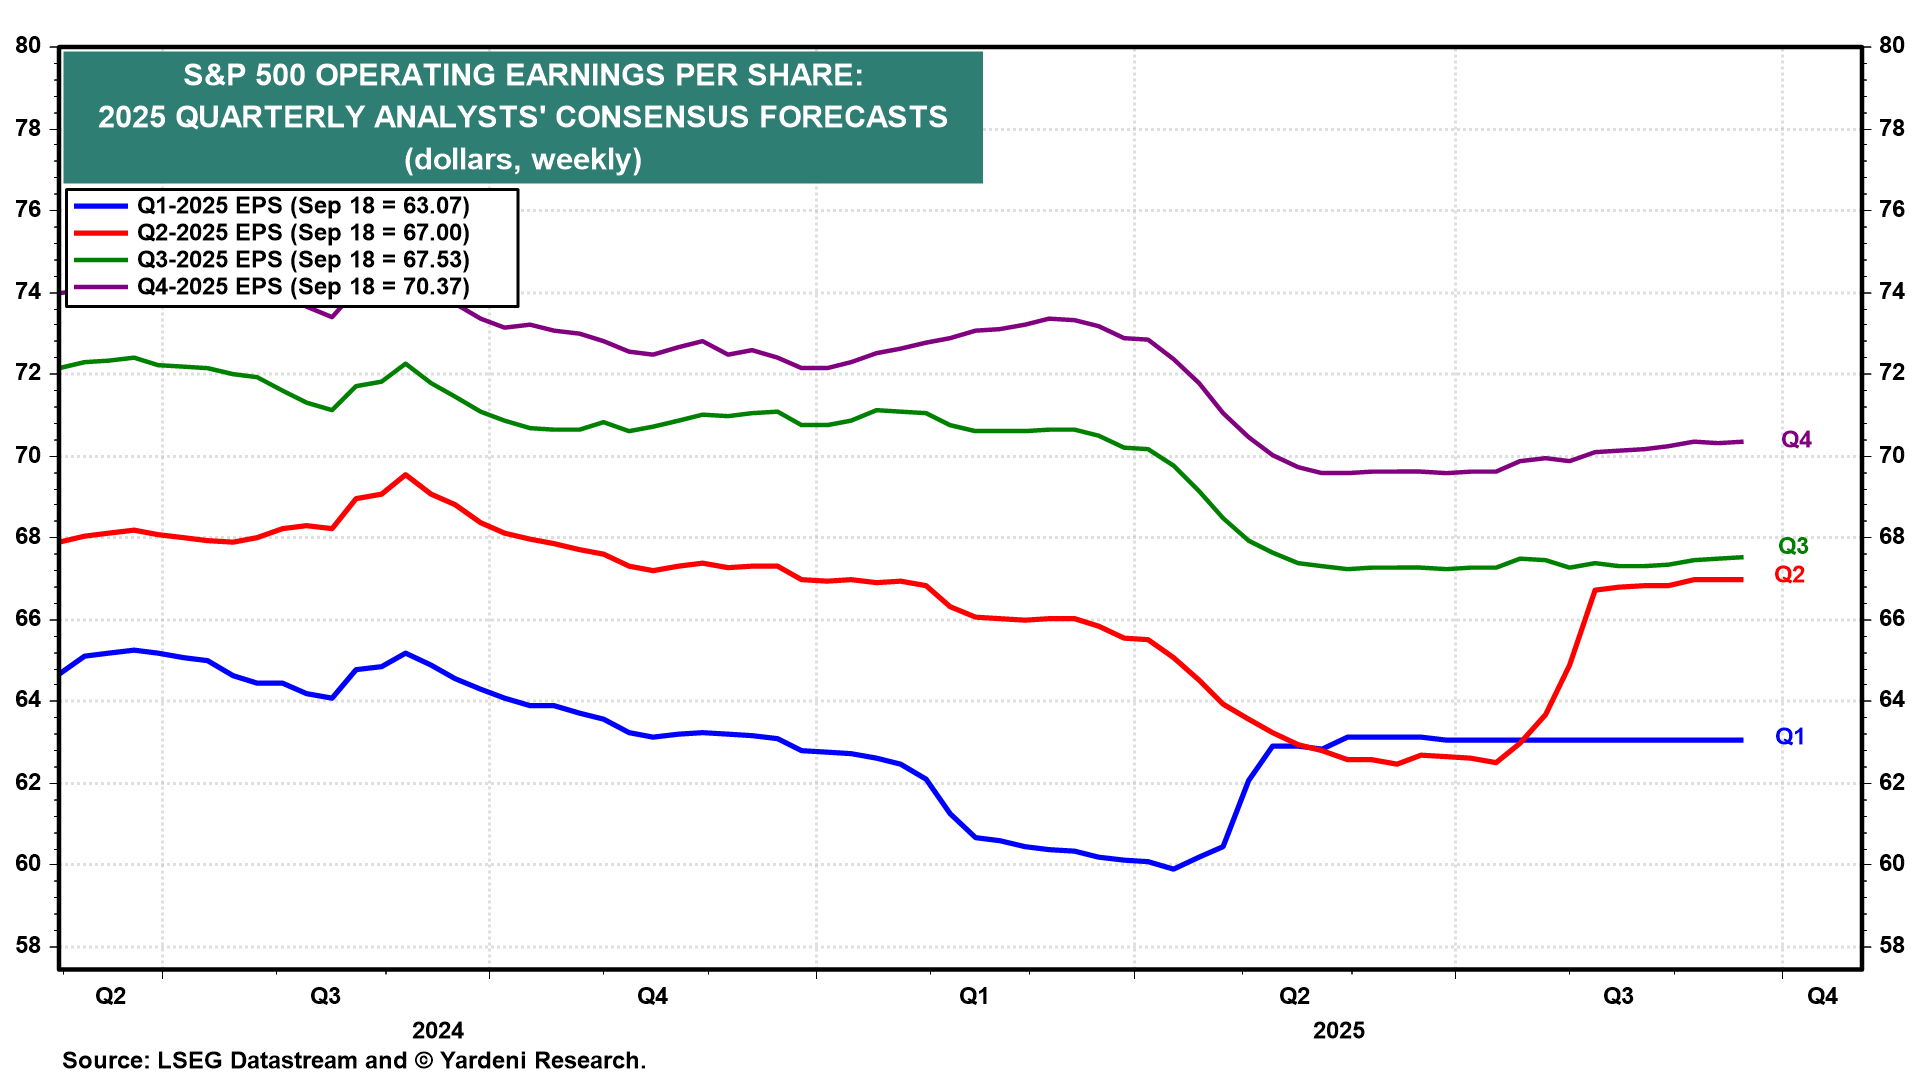
The rebound in the stock market since this year’s low on April 8 (when it bottomed at 4982.77) has been extraordinary. That’s mainly because the Q1 and Q2 earnings seasons (during April and July) were much better than expected (chart). We are expecting similar “earnings hooks” (i.e., upturns in the data series as actual results are incorporated) for Q3 and Q4.
Q2’s upbeat earnings surprises weren’t limited to the Information Technology and Communication Services sectors, in general, or the Magnificent-7 and the AI stocks, in particular. The Financials and Consumer Discretionary sectors also beat expectations …
… And from the Global Wall Street inbox TO the intertubes, a few curated links …
Good news …
September 23, 2025 Apollo: Recession Probability Declining
The consensus probability of a recession over the next 12 months continues to decline and currently stands at 30%, see chart below.
… good, depending on your PnL … Moving on TO … CHARTS … I like ‘em and here are a couple of interest IF you missed ‘em …
Sep 23, 2025 Topdown Charts: 10 Charts to Watch in 2025 [Q3 Update] Key charts and issues to keep track of in Q4 and beyond...
…4. Normal no Longer? Speaking of cross-currents I think this chart helps spell it out; long-term government bond yields are in Higher-For-Longer mode while policy rates trend lower. This tells you that the bond market is looking at rate cuts as something that is going to drive growth reacceleration and eventual inflation resurgence… and in the end: higher bond yields.
It was too early to call for “unpivots” in 2025 given what unfolded in H1, but I think we need to consider the currently unthinkable prospect of rate *hikes* in 2026 if reacceleration and resurgence start to come online in a meaningful way.
“Policy rates have peaked as central banks pivoted to rate cuts. Bond yields also peaked —initially; but that’s changing. Both lines in this chart are going to be at the mercy of the macro-risk-sandwich (a binary prospect: recession = down, reacceleration + inflation resurgence = up).
For a market hooked on rate cuts, 2025 could present a wake-up call; we may need to be prepared for pauses and “unpivots” instead of just consensus cuts.”
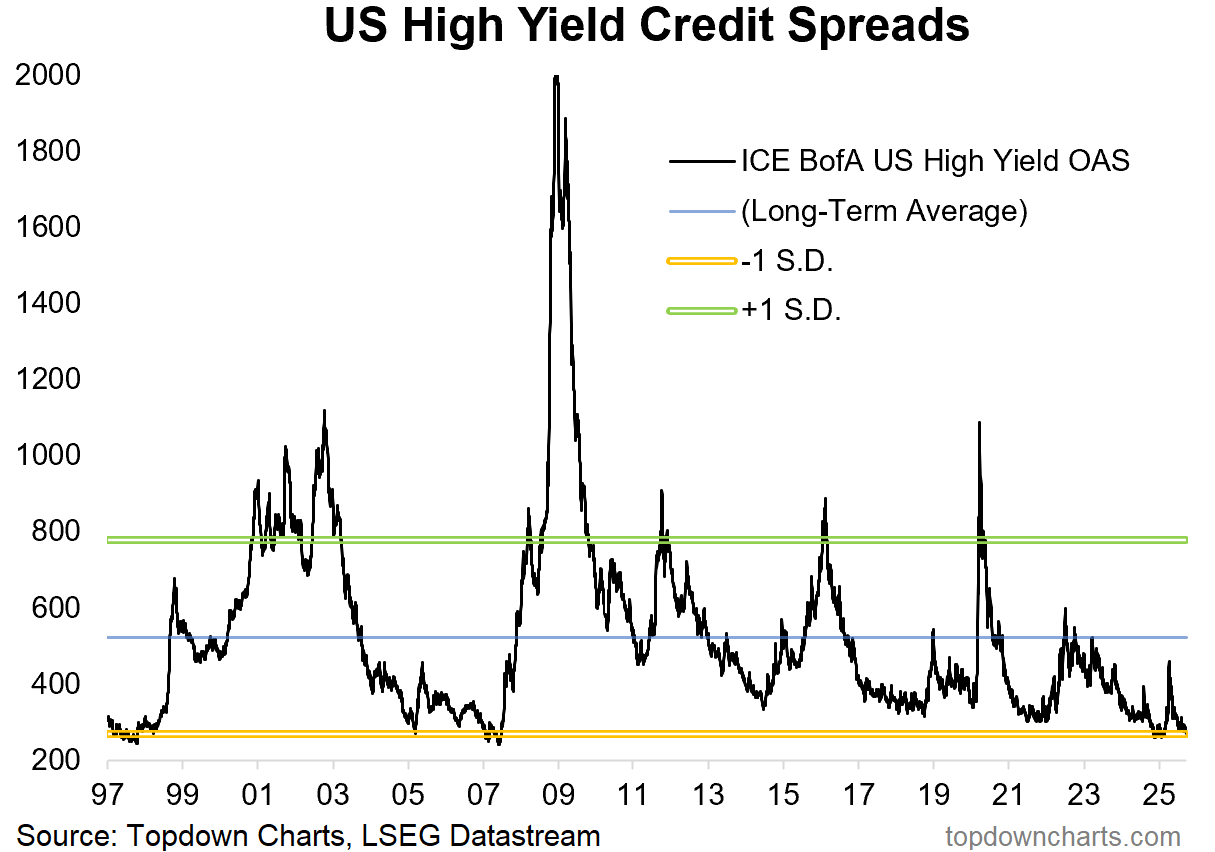
…6. No Credit Risk Premium: On risk premia, the credit risk premium has also been squeezed down to rock-bottom as investors reach for yield rather than safety in corporate bonds. Tight credit spreads and low equity risk premiums point to a market that is highly confident and probably a little bit complacent by now.
“There’s also very little risk-cushion on offer in credit — credit spreads and Stockmarket valuations are pretty much priced for perfection. Do you believe in perfect? (you better believe if you are all-in on risk assets!)”
… and … I’ll just quit while I’m behind and continue to catch up and through all i’ve missed … like this equity related deal …
Hmm … OKIE DOKIE … Guess then this helps make BONDS look particularly of interest and with some value?
Never mind … THAT is all for now. Off to the day job…


https://justthenews.com/politics-policy/polling/poll-sherrill-ciattarelli-tied-new-jersey-gubernatorial-race
I did that w/my solar generator recently....doesn't work 🤣