Good morning … especially for those celebrating The Year Of The Steepening …
… the time finally come (again?) and yesterdays steepening ray of light was brought to us by a couple things on and above the fact that the price of ‘Earl has been on the decline. MAIN talkin’ points ‘bout week economy leading to bull steepening …
ZH: Bank of Canada Cuts Rates For Third Consecutive Month, Says "Expect Further Cuts"
ZH: First Dollar General, Now Dollar Tree Shares Plunge As Both Discount Retailers Warn Of Core Customer Under Pressure
ZH: Catastrophic JOLT: Job Openings Crater To Lowest Since 2021 As Data Manipulation Fails
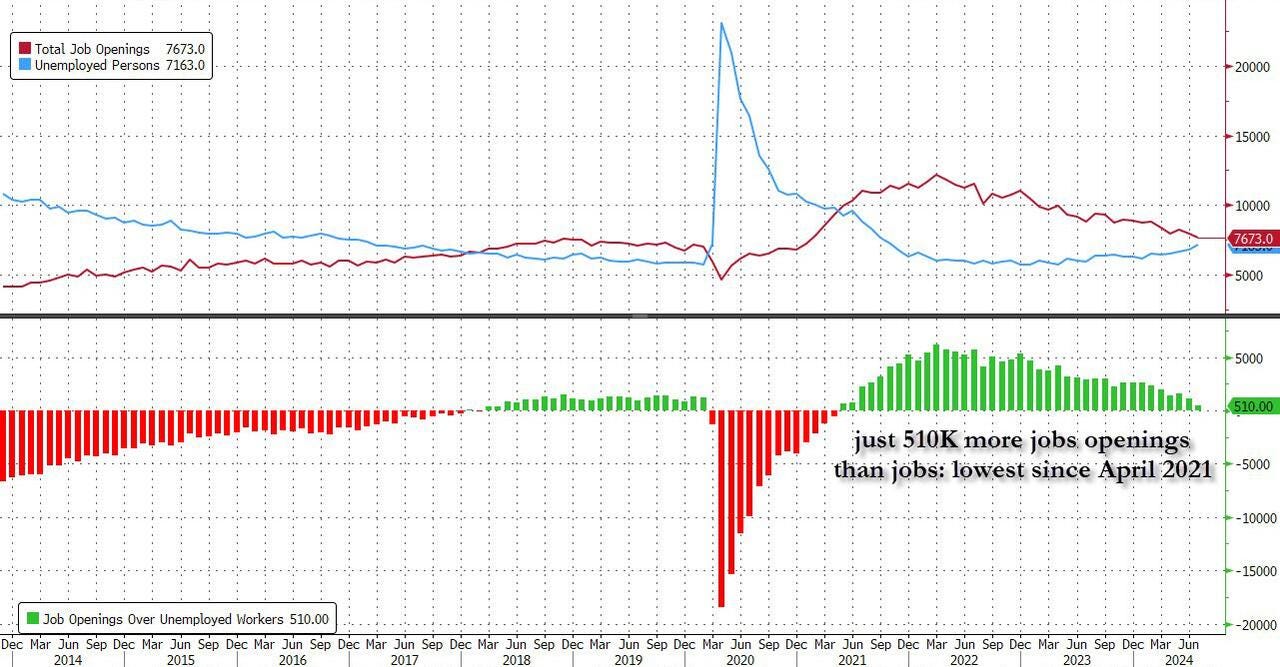
… Ignoring the data manipulation, in the context of the broader jobs report, in June the number of job openings was just 510K more than the number of unemployed workers (which the BLS reported was 7.163 million), down from last month's 1.373 million and the lowest since April 2021.
Said otherwise, in July the number of job openings to unemployed dropped to just 1.07, a plunge from the June print of 1.16, the lowest level since May 2021 and now officially below pre-covid levels.
While the job openings data set was a disaster no matter how one looks at it, there was silver lining as hiring finally staged a modest rebound after last month's collapse...
… and so, JOLTS … openings … ‘catastrophically’ bad news really then IS … REALLY good news? Dunno.
To the Bloomberg …
Bloomberg: 5 Things You Need to Know to Start Your Day
… A key job market gauge has reached an inflection point that may lead to a faster rise in the unemployment rate, based on Federal Reserve Governor Chris Waller’s research. That adds to the market’s perception that the bar for a 50-basis-point rate cut has been lowered.
Over the past two years, Waller has been arguing that the Fed could curb inflation without a recession. His main thesis is that the Fed’s tightening can rebalance the labor market by reducing job openings without a significant rise in the unemployment rate. So far, he’s been right, defying many who considered such an outcome is unlikely.
But his research paper with Andrew Figura, published in 2022, also showed that once the job vacancy rate falls to the pre-pandemic level of 4.6%, the unemployment rate would rise to 4.5%. (The jobless rate was 4.3% in July.)That line was crossed on Wednesday, when the JOLTS report showed the vacancy rate declining to 4.56% in July, from a peak of 7.4% in March 2022.
At Jackson Hole, Fed Chair Jerome Powell said further cooling of the labor market would be “unwelcome,” suggesting the central bank’s focus has now shifted to keeping a lid on the unemployment rate. All that has prompted traders to add a few more basis points to their bets for a September rate cut, as Kristine Aquino notes above.
Waller will speak about the economic outlook on Sept. 6, just after the payrolls report. That may offer him a chance to set market expectations for the size of the cut before the Fed’s blackout period ahead of the September policy decision.
… ok SO date was no bueno and bad is good… Lets turn TO … the Beige Book …
ZH: Ugly Beige Book Reveals Economic Activity "Flat Or Declining", Consumer Spending Slowing In Most Districts …
… Catastrophic? More on BEIGE below but I’d note an Oxford Eco chart (from Authers OpED below) as things are not good BUT not yet recessionary (them not me)
… oh forget it…by days end, well…
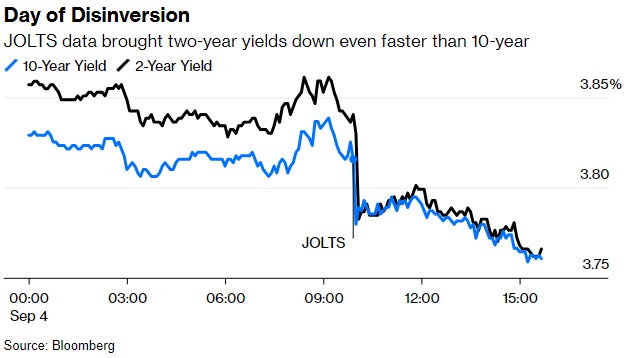
ZH: Hard-Landing Panic Leads To First Yield Curve Disinversion In Two Years, As Nvidia Plunge Continues
…The continued barrage of bad news also means that what until yesterday was a 35% probability of a 50bps rate cut in the September FOMC (with one rate cut now guaranteed), rose as high as 50% just after the JOLTS shock, before easing back to 44%. In other words, ahead of Friday's payroll, it is effectively a coin toss if the Fed cuts rates 25bps or 50bps in two weeks.
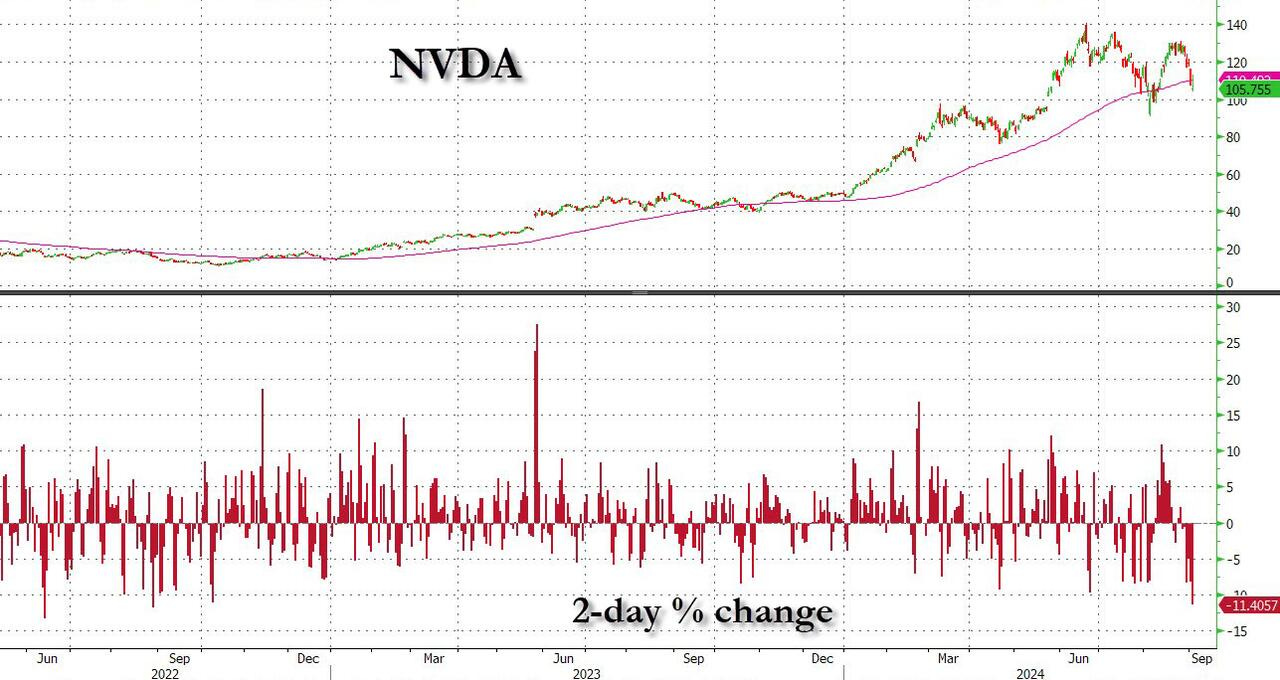
…But while previous cases of hard-landing fears at least saw rotation out of everything and into AI, today the love was sorely lacking, and yesterday's record plunge in NVDA only became bigger, as the stock lost another 2%, pushing it below both 100DMA (after it tripped the 50DMA yesterday) and bringing the two-day drop to 11.4%, or a massive $333 billion loss in market cap in two days. Yes, Nvidia has lost a third of a trillion in the past two days.
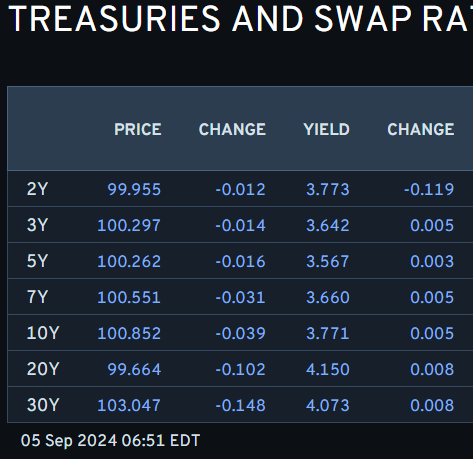
… here is a snapshot OF USTs as of 651a:
… and for some MORE of the news you might be able to use…
NEWSQUAWK: US Market Open: Tentative price action ahead of today's US data deluge including ADP Employment & ISM Services … USTs are flat ahead of today’s US data deluge, Bunds edge lower … USTs are flat ahead of a packed and potentially pivotal afternoon agenda. From which, the labour market data points will take centre stage and be scrutinised in the context of Friday’s Payrolls. USTs are just off Wednesday’s JOLTS-driven highs at 114-18.
Moving from some of the news to some of THE VIEWS you might be able to use… here’s SOME of what Global Wall St is sayin’ … about JOLTS and other stuff …
Argus Daily Spotlight (another scary Sept writeup…but from a source with a history and about 44yrs of context…)
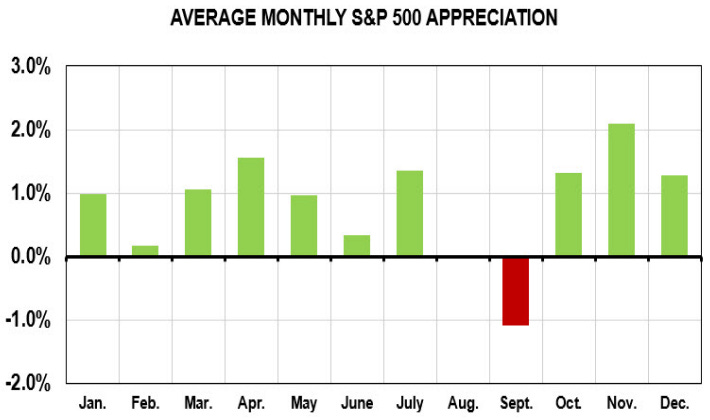
Beware September The U.S. stock market tends to rise, notwithstanding a pullback or correction from time to time. The long-term upward trajectory has a foundation in the country's democratic political system and its market-based, capitalist economic system that is relatively transparent and rewards innovation. In theory, the stock market efficiently allocates the nation's capital, generating solid returns over economic cycles. And then there is September. Indeed, our analysis of monthly S&P 500 returns going back to 1980 indicates that September is now the only month with an average loss. Now not every September is negative. The month has a "win percentage" of 46%. But there have been some bombs, including 2022 (-9.3%), 1986 (-8.5%), 2001 (-8.2%), 2002 (-11%), 2008 (-14%) and 2011 (-7.2%). Last year, the S&P 500 fell 5.0% in the month, and 2022 was a 4.8% loser. September is a transition month: the August doldrums are over and corporations get back into gear after Labor Day. The IPO market typically picks up. The Federal Reserve meets, which can add to volatility. And, sometimes ominously, the third-quarter earnings season approaches. By the end of 3Q, companies are pretty sure if they are (or are not) on track to meet their financial targets. If they are not and they pre-warn about disappointing results, investors can be quick to sell not just a company but an entire sector.
BARCAP July JOLTS: Hints of deterioration intensify employment spotlight
July's JOLTS estimates show a further downtrend in job openings, hinting at labor market deterioration and putting a 50bp cut in play for September. However, with measurement issues and hurricane distortions clouding the July data and some encouraging signs in today's details, the FOMC's focus will be on Friday's empsit.
We retain our carry-oriented trades initiated amid last month’s market turmoil. We add carry through selling out-of-the-money naked puts on US natural gas, reflecting our more bullish outlook for 2025 and diversification benefits to carry curve trades. We add protection in equities this month through equity low beta (L/S) strategies and Thalia. Upside right-tail risks could be best covered by forward rates volatility trades, in our view, particularly in Japan. In this edition, we introduce a new set of strategic health metrics that offer valuable measures of performance robustness (in-sample/out-of-sample) and a larger set of portfolio analytics.
… Rates: We continue to favour notionally-weighted Japanese forward rates volatility as offering attractive protection against a reversal higher in Japanese (global) long-dated yields. Cheap volatility is attractive to own, while the notional-weighted could offer better carry, thanks to re-pricing higher in short-dated implied volatility. We continue to like carry exposure through a US 10y TIER receiver (BNPITR10). Any further rally is likely to be driven by the front end, in our view, while positioning has clearly shifted long duration, with lesser marginal buying unless the US enters a full-fledged recession ...
DATATREK: JOLTS Warning Sign, Oil Prices and Recession, Fund Flows
…Topic #1: Today’s Job Openings and Labor Turnover Survey (JOLTS) report, focusing on the Openings data. Fed Chair Powell often mentions this slice of the survey when discussing demand in the labor market and it clearly informs his view of appropriate monetary policy.
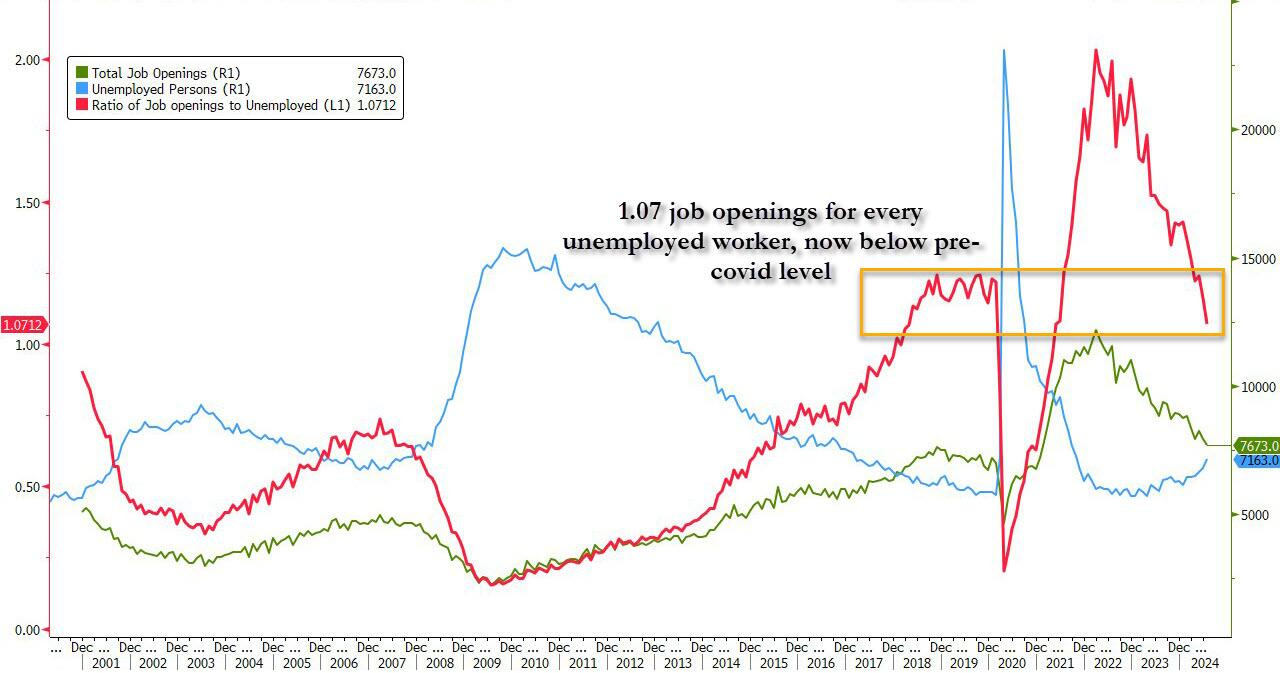
The following chart shows the ratio of Openings to the number of Unemployed Workers from 2001 to the present, the metric Powell most commonly cites when discussing this data:
Three points here:
First: Since 2001, the Openings/Unemployed Workers ratio has usually run below 1.0x, which is what you’d expect to see, but there have been 2 notable exceptions:
In 2018 – 2019, the average ratio was 1.16x. At the end of the last economic expansion there was unusually strong demand for labor, especially in the service sector.
The ratio broke through 1.0x to the upside in May 2021 (1.07x), peaked in March 2022 (2.03x), and has been declining since but is not yet back to below 1.0x (July 2024 1.07). Pandemic-related fiscal and monetary stimulus caused a surge in demand for labor just as many workers chose to either retire or take an employment break.
Second: Since the entire 2018 – present period is unusual, to say the least, let’s focus on the Openings/Unemployed Workers ratio from 2001 – 2017:
Over this period, the average ratio was 0.49x, literally half the 1.0x ratio so common since 2018 excluding Pandemic – related disruptions in 2020 and early 2021.
During the early 2000s economic expansion, the ratio topped out at 0.74x in March 2007.
In the 2010s, the ratio topped out around 0.80x in 2016 before climbing to 1.0x in January 2017 and running hotter than that through 2019.
Third: The Openings/Unemployed ratio has been declining very quickly this year, but its recent history is so anomalous that it is unclear if this momentum signals an imminent and dramatic increase in the unemployment rate:
As noted, prior to 2017 demand/supply of labor (Openings/Unemployed) trended around 0.5x, well below even the most recent 1.07x reading.
Even still, rate of change matters. The mere fact that demand (Openings) is coming down so quickly relative to supply (Unemployed) is troubling. Momentum is a powerful force in economics, just as it is in capital markets.
Also worth considering: how much of the ratio’s exaggerated readings over the last few years was due to employers 1) posting for positions in anticipation of quits and/or 2) casting a wider than usual net hoping to upgrade their workforce after a period of suboptimal hiring practices?
Takeaway: Capital markets chose to read today’s JOLTS report very differently, essentially picking sides in the debate we outlined in the third point:
US 2-year Treasuries rallied to fresh 52-week low yields (3.77 percent), since the drop in Openings points to rapidly rising unemployment and therefore more aggressive Fed rate cuts over the next 12 – 24 months.
Stocks were much less affected (S&P 500 and Russell 2000 -0.2 percent), suggesting a belief that the labor market is not about to fall off a cliff and/or Fed rate reductions will avert an outright recession even if unemployment continues to increase.
Our own belief, based on the long run history of Openings/Unemployed Workers, is that the US labor market is cooling but not yet on the brink of signaling that a recession is nigh. We acknowledge, however, that a reasonable person could read the data more bearishly. All we know for sure is that this Friday’s Jobs Report just became even more important for near term market direction…
In an election year of firsts, the race has changed dramatically since sitting President Biden dropped out of the race on July 21 and Vice President Kamala Harris ascended to the top of Democratic ticket on August 2. Polling averages show that a wave of Democrat enthusiasm has propelled Harris from a 3-percentage point underdog to former President Trump at the national level at the start of her campaign to around a 3-percentage point favorite. However, swing state polling results are more mixed, with Harris pulling even in some states while former president Trump maintains a slight lead in others. As a reminder, there have been five Presidential elections in which the popular vote winner did not win the electoral college (1824, 1876, 1888, 2000, 2016)…
…In summary, with two months to go before the November 5 US election, the race for the Presidency appears to be neck and neck as we head into the homestretch. With respect to Congress, the probability that both chambers flip to the opposing party has meaningfully risen – a rarity in Presidential election years. Indeed, as we outline at the end of our chartbook, should there be an electoral college tie, the House of Representatives would then choose the President – a non-zero probability in an election year that has already seen historically uncharted territory.
… Fed has held rates steady in recent decades during election years but consistent with economic conditions
RBC: Bank of Canada cuts interest rate, hones in on downside risk
… Bottom line: The third straight interest rate cut in September from the BoC still leaves the overnight rate at relatively high (‘restrictive’) levels – particularly compared to a softening economic growth backdrop that's expected to keep inflation on a downward trajectory. Despite some pockets of sticky price growth (shelter and “some” other services), the tone from the BoC has clearly shifted to worrying about a gradually but persistently weakening economic. Already, growth in the third quarter is looking to undershoot the BoC’s July forecast of 2.8%. We continue to expect the BoC to follow with another rate cut in October.
Summary Job openings data for July showed few signs of the ongoing cooling in the labor market coming to an end. Job openings fell to 7.67 million from a downwardly revised 7.91 million in June, translating into a plummeting in the ratio of job openings per unemployed worker to 1.07. This often cited measure by Fed officials now joins a slew of other labor market data that indicate the jobs market is now softer than it was prior to the pandemic.
For those hoping that softening demand for new workers would stabilize at a "Goldilocks" level, the July JOLTS report is at least one data point in the wrong direction. For the Fed, today's data reaffirm that the labor market is no longer a source of inflationary pressure to the U.S. economy. With job openings and turnover showing few signs of the past year's weakening trend in labor market conditions starting to stabilize, all eyes will be turned to Friday's August employment report to see if July's rapid deterioration was merely noise or a signal that the jobs market is struggling to maintain traction.
… And from Global Wall Street inbox TO the WWW,
Bloomberg: Rate Options Show Rising Bets on a Half-Point Fed Cut This Month
… Options tied to the Secured Overnight Financing Rate show that open interest, or the amount of positions owned by traders, has surged across a number of call contracts that expire on Sept. 13, five days before the central bank’s post-meeting announcement.
The positions would pay off if Friday’s employment report and next week’s consumer price index reading show the labor market and inflation are cooling enough to justify a more rapid approach to easing policy. Right now, swaps contracts put about a one-third chance on the Fed cutting its key rate by a half percentage point this month.
“The labor market has slowed down, and it is now getting the Fed’s attention,” said Priya Misra, portfolio manager at JPMorgan Asset Management. “I see a very strong case for cutting rates initially in 50 basis point increments, given that the funds rate is 5.25-5.5%, the economy is slowing down and the lags between monetary policy and the economy are famously long and variable.”
Bloomberg: Cheering the Yield Curve? Not So Fast (Authers’ OpED)
It could imply we’re on the cusp of recession. But the right jobs report Friday might turn around the latest market slide.
… the moment of disinversion came on the publication of a data point that many thought recessionary, the latest numbers on the Jobs Openings and Labor Turnover Statistics (JOLTS), of which more later. This is how the two benchmark yields moved through Wednesday:
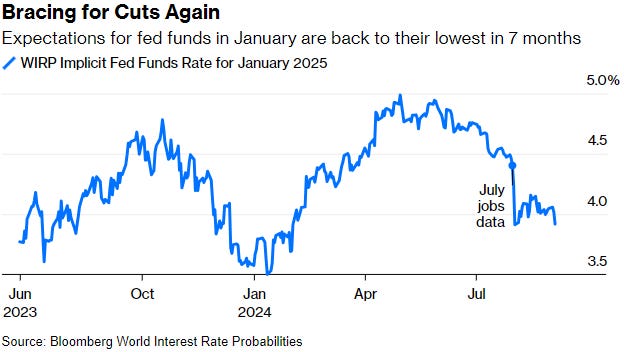
… Bets on the Fed to cut rates aggressively grew in confidence. The projected fed funds rate for its January meeting is now back to its lowest since February, according to Bloomberg’s World Interest Rate Probabilities function, which derives projected rates from the futures market. A month ago, the July non-farm payrolls number sparked a wave of bets that the Fed would have to cut repeatedly. Those bets have been reined in somewhat since, but the market is back to full confidence that fed funds will be below 4.0% next January:
…That confidence in imminent cuts means that another, less closely watched yield curve is now very deeply inverted. If we subtract the two-year Treasury yield, driven by Fed expectations more than anything else, from the effective fed funds rate, giving a spread from one day to two years, we find the curve is its most deeply inverted since the beginning of the crisis year of 2008. Back then, traders accurately thought that the deepening credit crisis would force the Fed into cutting many times. That’s a very uncomfortable precedent:
… Meanwhile, Wednesday’s publication of the Beige Book, in which the Fed’s regional branches offer an anecdotal picture of the economy, was in line with a soft landing rather than the kind of five-alarm fire that would necessitate the nine cuts that are currently priced in. This is Oxford Economics’ regular gauge of the level of activity demonstrated in the book, derived from counting a number of cue words in the report. It suggests negativity (not for the first time in the last two years), but not a recession:
…A Crude Silver Lining … The silver lining in oil’s fall is the additional confidence addedto expectations of monetary easing by the Fed. This is one less inflationary pressure to worry about. For consumers, the joy is almost instant, with gasoline futures in New York falling even faster than crude, and likely to translate into lower pump prices:
LPL: Is September Seasonality a Headwind for Stocks?
…S&P 500 Index Average Monthly Returns (1950–2024)
…Summary September seasonality is generally not favorable to stocks, with poor performance typically backloaded, but there may be some slightly mitigating factors at play in the year. Much of the likely trajectory for stocks will depend on the path that the Fed decides to take at the FOMC meeting that takes place right at the start of the historically weak period for stocks in September. LPL’s Strategic and Tactical Asset Allocation Committee (STAAC) maintains its tactical neutral stance on equities, though we don’t rule out the possibility of short-term weakness as markets could readjust having gotten slightly over their skis on the pace and number of rate cuts that the Fed will deliver. Scanning out further, both post-election and fourth quarter seasonality become more favorable stocks.
Topdown Charts: 12 Charts to Watch in 2024 [Q3 Update] Key charts and issues to keep track of in Q4 and beyond...
…6. Bond Bargain: Bonds are cheap, stocks are not. Prefer bonds to stocks in asset allocations — especially if the 3 wise lines of the previous chart prove correct on their recession prognosis.
“As such, and while things have moved a lot since the brief 5% reading for the US 10-year treasury yield in October last year, government bond valuations are still cheap, and the macro downside risk scenario I outline here is bond bullish. It won’t be a straight line, but bonds likely see further upside in the coming year following one of their worst bear markets in recent history.
Buried deep inside today's JOLTs report was some data that is simply stunning, and suggests that Friday's jobs report - now that the data goalseeking and manipulation is largely over with the near-record downward jobs revision in the books - could be a disaster.
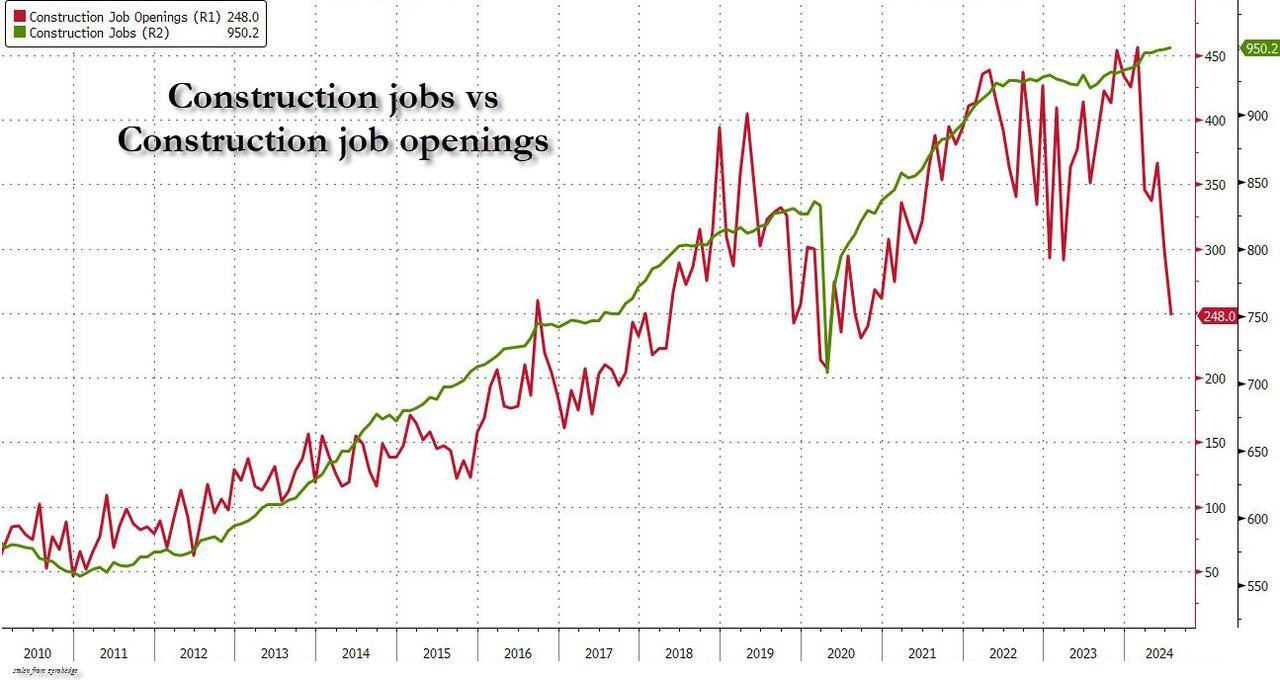
We are referring to the historic collapse in construction job openings, which have tumbled from an all time high of 456K in February to a four year low of 248K in July, a plunge of nearly 50% in just 6 months, and a level which the US economy first reach back in 2016!
And yet... in the same period, the Department of Labor's "other hand" which clearly was unaware of what is going in the realm of job openings, reports that when it comes to actual Construction jobs, the number has never been higher: indeed, at 950K, the number of residential building construction jobs is the highest on record.
Needless to say, there has never been a disconnect as gaping as the one shown below!
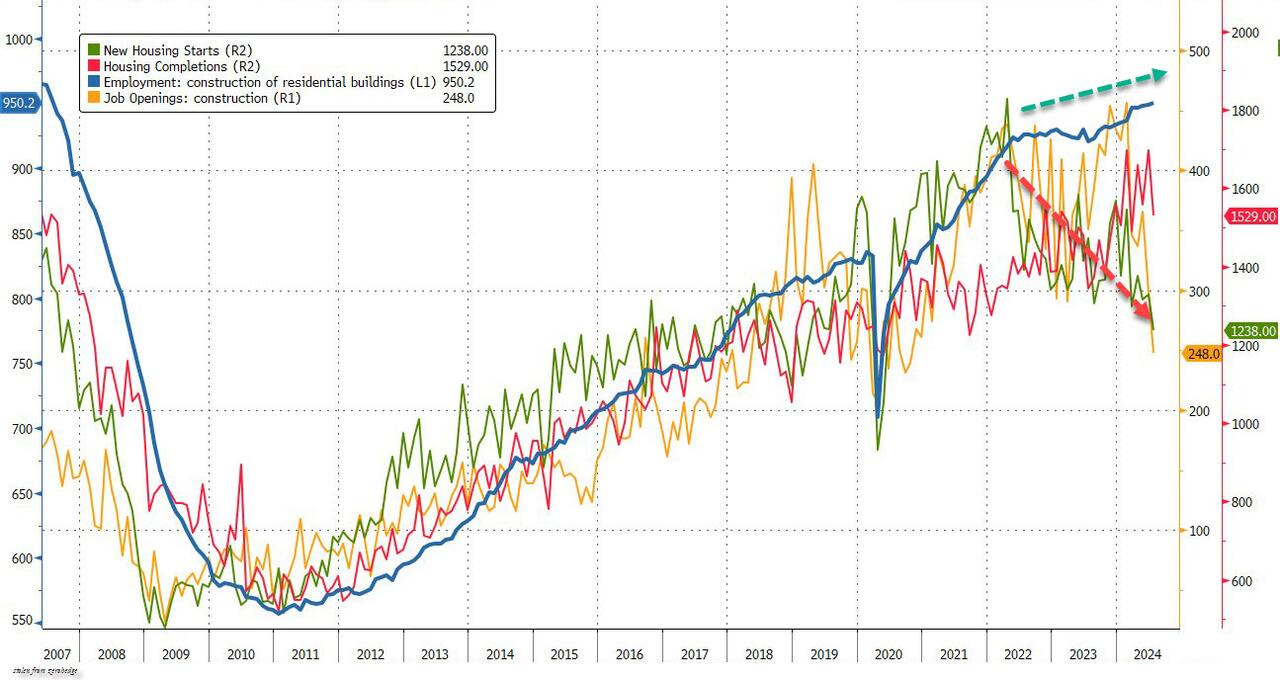
Which data set is right? To answer that question you don't even have to look at where interest rates are (nor know what the highest rates in 40 years do to housing demand), but merely take a look at the other key metrics of the US housing market such as new Housing Starts which are in freefall, or the lagging Housing Completions which are unchanged in two years...