Good morning … I’m watchin 10yy vs 4.20 and then 4.15 as ‘resistance’ and here’s why…
I’ll have a look towards some longer term (weekly) charts over the weekend, weather permitting (and with a complete washout tomorrow, am guessing I’m gonna have time) …
With that in mind, I’m going to switch up gears and offer a visual / quick thought on LEI — out yesterday and positive for the 1st time since end of 2021. See Wells Fargo just below for somewhat more / deeper dive but here’s something from X …
… The idea here being to illustrate the fact that LEI turned POSITIVE and how it confirms a ‘recession that never happened’ is in rear view mirror. NOW, it may be presumed that the yield curve can begin to (BEARISHLY) steepen on rising growth expectations…
Lots of funTERtaining things one can and will stumble upon on the intertubes … personally I was NEVER a fan of LEI (there was one subcomponent I’d follow for goofs but again, that was way back when I was armed and dangerous with a Bloomberg…trying to make something UP which sounded semi - intelligent) …
… and moving on then to a couple of inputs from yesterday where there was some (un/welcomed — depending on your positions) funDUHmentals …
ZH: US PMIs Signal "Unwelcome Upward Pressure On Consumer Prices In The Coming Months"
ZH: Existing Home Sales Unexpectedly Exploded Higher In February... And So Did Prices
… Ruh Roh … I’ll quit while I’m behind and here is a snapshot OF USTs as of 705a:
… HEREis what this shop says be behind the price action overnight…
… WHILE YOU SLEPT Treasuries are drifting higher but still underperforming bunds/gilts with volumes (~80% 30d ave) light amid an empty economic calendar domestically. USDCNH stole the limelight overnight (much on that below) after breaking above key resistance (7.20). The continued rally has caused ripple effects: DXY +0.4%, commodity currencies underperforming, Copper -1%, Eurostoxx -0.4%. S&P e-minis are +4pts here at 7:15am, the UST 5s30s curve 0.5bp steeper, franchise flows light and variable save for some bank buying in the 10y sector.
… and for some MORE of the news you might be able to use…
NEWSQUAWK: US Market Open: Equities modestly firmer, DXY lifted by broader G10 weakness and Bonds higher; ECB & Fed speak due … Bonds continue their dovish price action, and little changed following positive German Ifo …
Reuters Morning Bid: Dollar surges after central bank barrage, Apple bruised (important visual, at least IMO, as far as it relates to JPOWs dovish pivot this past week…)
Finviz (for everything else I might have overlooked …)
Moving from some of the news to some of THE VIEWS you might be able to use… here’s SOME of what Global Wall St is sayin’ …
Value narrowed its YTD underperformance vs. Growth in recent weeks amid choppy inflation and uncertainty around the policy outlook, but we think this is unlikely to last. Resilient macro data and the Fed staying its course should be incrementally constructive for Growth stocks going forward.
BARCAP (EZ)Equity Market Review - Party like it's 1995
Dovish central banks are further improving the growth/policy trade-off. Mid-cycle rate cuts amid a resilient economic activity is a positive environment for risk assets. Although still soft PMIs in Europe keep the short cycle trade in check, policy easing should help a broadening of the rally. Small caps may benefit.
The Fed has a range of compatible options to reduce the average duration of its UST holdings in the long-term, including MBS runoff, MBS sales and altering its UST reinvestment structure.
Our analysis suggests that an increase in Fed SOMA holdings at shorter maturities is consistent with lower short-term funding costs. Additionally, an increased allocation to a given maturity sector supports swap spreads at that part of the curve.
How Treasury adjusts its issuance profile will be key to the market impact. We think Treasury may offset open market purchases of T-bills from the Fed and keep supply to the market comparatively stable to avoid distortions.
DB CoTD: Longest inversion ever... (written and sent YESTERDAY … mark it down as the ‘landmark day’ … AND for somewhat more color and SNARK, see ZH copying / pasting of this CoTD along with some added ‘flavor’ )
Today is a landmark day as last night we passed the longest continuous US 2s10s inversion in history. Although the 2s10s first inverted at the end of March 2022, it has now been continuously inverted for 625 days since July 5th 2022. That exceeds the 624 day inversion from August 1978, which previously held the record.
Regular readers will know that I think that an inverted yield curve has been the best predictor of a US downturn of any variable through history.
But has it failed in this cycle? Possibly, but in many ways the yield curve has already accurately predicted many of the drivers that would normally lead to a recession. However, these variables haven't then created recessionary conditions as they normally would have done.
It led, as it always does, the very sharp deterioration in bank lending standards, and led the declines in bank credit and money supply that are almost unique to this cycle. It was also at the heart of why we had some of the largest bank failures on record with SVB, Signature Bank and First Republic collapsing. A significant part of their failure was a big carry trade that went wrong when the curve inverted.
However, even with the above, a recession hasn't materialised. This is perhaps because of the following.
When lending standards were at their tightest, the borrowing needs of the economy were low relative to previous cycles.
Excess savings have been unusually high in this cycle (and were revised higher with the GDP revisions last September), so consumers haven't been as exposed to tight credit as they normally are.
The Fed unveiled a huge series of measures to ensure the regional bank crisis didn't naturally unravel as it would have done in a free market or perhaps in many previous cycles.
Whilst the Fed’s tightening has been reducing demand, the supply-side of the economy has bounced back strongly from the pandemic disruption, which has further supported growth and made this cycle unique.
So far so good. However, an inverted yield curve should ultimately be a significant headwind for an economy, as capitalism works best when there is a positive return for taking more risk with lending and investments further out the curve. As such, the rational investor should be prepared to keep more of their money at the front end, or not lend long-term when the curve is inverted. You are not giving up yield for being able to sleep at night.
So the economy has not succumbed to the inverted yield curve to date, but while it remains inverted you are encouraging more defensive behaviour at some point if sentiment changes. As such, the quicker we get back to a normal sloping yield curve the safer the system is, all other things being equal.
Goldilocks: Existing Home Sales Surge in February; Boosting Q1 GDP Tracking to +1.9% (so, GDP boosted = JUNE RATE CUTS)
BOTTOM LINE: Existing home sales increased by 9.5% to a seasonally adjusted annualized rate of 4.38 million units in the February report, significantly above expectations. The median sales price of all existing homes increased 0.5% month-over-month, and the imbalance between housing supply and demand worsened somewhat. We boosted our Q1 GDP tracking estimate by 0.2pp to +1.9% (qoq ar). Our Q1 domestic final sales growth forecast now stands at +2.2% (qoq ar).
UBS (Donovan): Rising certainty about reducing rates
This week has increased certainty about interest rate reductions in the world’s main economies. That certainty was absolute in Switzerland, where rates were cut. The uber hawks of the Bank of England had their wings clipped, and the Federal Reserve may start to believe that US trend growth is higher.
There are three reasons central banks may be certain about cuts. Inflation is not precise, and so inflation targets are best thought of as a range—with a 2% target, cutting at 3% (or raising at 1% is reasonable). Disinflation forces are clear in the detail of data—increasingly, inflation rates are propped up by quirks and administered prices.
Rate increases may have had less impact on inflation than is supposed. Rate increases did little to resolve transitory inflation (that was inevitable), and have almost no impact on energy prices. Profit-led inflation is in retreat as consumers rebel, not as interest rates rise. This may blunt the inflation impacts of further rate moves…
Wells Fargo: LEI Couldn't Get Any Further Away Before It Started Coming Back (if the ‘tide is turning’ then are JUNE RATE CUTS really needed?? askin’ for a friend)
Summary The Leading Economic Index (LEI) notched its first positive monthly gain in 23 months. The overall signal is still historically consistent with recession, but the tide may be beginning to turn.
Wells Fargo: Existing Home Sales Surged in February (so, strongest in a year means … i know i know …JUNE RATE CUTS)
Summary Existing Home Sales Hit Strongest Pace in a Year Existing home sales easily bested expectations and rose 9.5% during February. Although still relatively slow, the 4.38 million-unit pace marks the strongest pace since February 2023. The surprising strength is likely explained by the dip down in mortgage rates which occurred at the start of the year. Affordability is still a major headwind, but even a slight decline in financing costs looks like it was enough to pull buyers off of the sidelines. Inventory remains tight, but a small swell of new supply hitting the market was another factor driving the faster sales pace.
February's upturn is an encouraging sign that the resales recovery is underway. That noted, mortgage rates have ticked higher in recent weeks, which means further progress in the near term will likely be limited by affordability constraints. Looking further ahead, however, existing home sales should gradually trend higher this year alongside less restrictive monetary policy and slightly lower mortgage rates. For more on our housing outlook, please see Housing Market 2024: An Early Spring or Longer Winter?
… And from Global Wall Street inbox TO the WWW,
AllStarCharts: Ice Cold Bonds Stoke the Stock Market Rally
Bespoke: A Flock of Doves (fun breakdown of data, workbenched as they do, to highlight stark differences and similarities…)
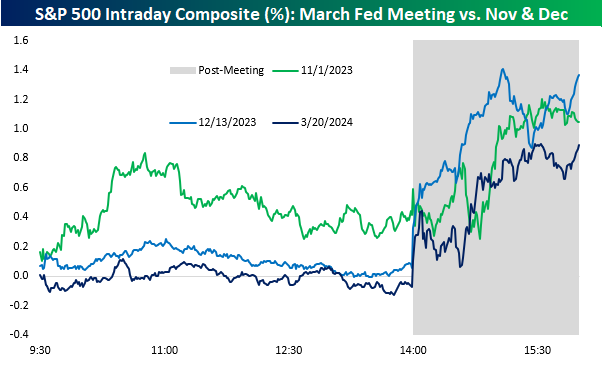
…Jerome Powell has now presided over 48 FOMC meetings since he became Fed Chair back in 2018. Compared to the average pattern that the stock market has taken on Fed Days under Powell, yesterday's action was much different. Below is a chart showing yesterday's intraday market action (blue line) versus the average intraday action across all Powell Fed Days (red line).
While the market's action following the last Fed Day in January was decidedly lower, we've now seen an upside reaction from the market on three of the last four Powell Fed Days dating back to last November. This has occurred as the Fed has shifted its stance from aggressive tightening to contemplating cuts in the future. Investors sure seem to love the thought of lower interest rates.
The S&P 500 (SPY) closed at an all-time high with its 0.9% gain yesterday
Bloomberg(via ZH): Did You Spot The Gorilla In The Fed's Meeting Room?
… A famous experiment asks volunteers to watch a video of a basketball game and count the passes. Half way through, a gorilla strolls through the action. Almost no-one spots it, so focused they are on the game. As we count the dots and parse the language at this week’s Fed meeting, it’s easy miss the fact that policy overall remains very loose despite over 500 bps of rate hikes. The gorilla has gone by largely unnoticed…
… The gorilla can be spotted in a number of different ways. Inflation has fallen, but it has done so largely despite the actions of the central bank, not because of them.
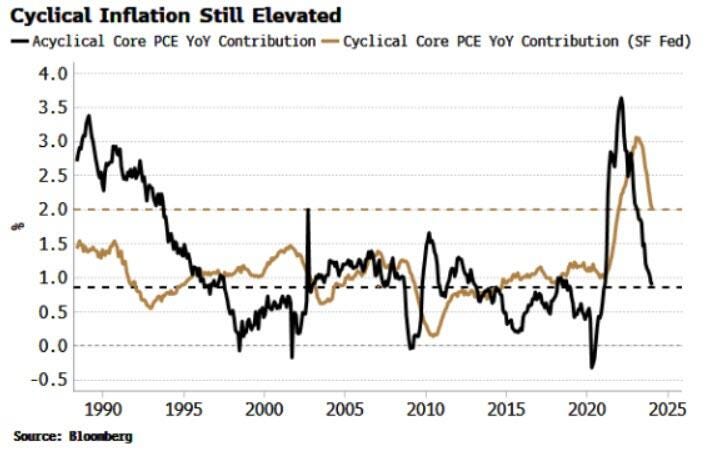
The San Francisco Fed splits core PCE inflation into a cyclical and an acyclical component. Cyclical inflation is made up of the PCE sub-components most sensitive to Fed interest rates, and acyclical is compiled from what’s left over, i.e. inflation that’s more influenced by non-Fed factors.
While acyclical inflation has fallen all the way back to its pre-pandemic average, cyclical PCE remains at its 40-year highs. The Wizard of the Fed has been pulling the rate-hiking levers, but they have done little to directly quell inflation.
… Gorillas playing basketball is a very odd thing; the Fed cutting rates before the last quarter of this year would be even odder. Before then, though, markets are likely to try to re-impose some sobriety by reducing or eliminating the number of rate cuts priced in.