while WE slept: USTs cheaper/steeper; '“Bond fund” received more US search than “tech stock”' (DataTREK); bond vol (MOVE) 3y low! Oh Canada! Stablecoin = UST demand; XL slurpee demand (JPOW)
Good morning … Equity futures fall and bond yields rise as Global Wall continues to try and price in latest on (Canadian) tariffs as well as yet another shot ‘cross the Fed independence bow …
Updated Thu, Jul 10 20256:01 PM EDT CNBC: White House accuses Powell of mismanaging Federal Reserve, citing headquarters renovation
… for somewhat more and perhaps needed ‘other side’ of the story, have a look thru latest from Jim Bianco (on LinkedIN, HERE and HERE) …
It all makes sense and at the same time, well, it absolutely does not. It is all described below by UBSs Paul Donovan as a paradox (a seemingly absurd or self-contradictory statement or proposition that when investigated or explained may prove to be well founded or true.) of retreat …
The disconnects described by Apollo’s Slok (HERE and HERE) continue to grow and we’re about to enter period of time (earnings) where maybe, just maybe some clarity will be delivered. For more on them, see latest note from across the pond (below)
Maybe some further clarity offered by HIMCOs latest quarterly (still not yet out / avail for consumption) but that day is not today …
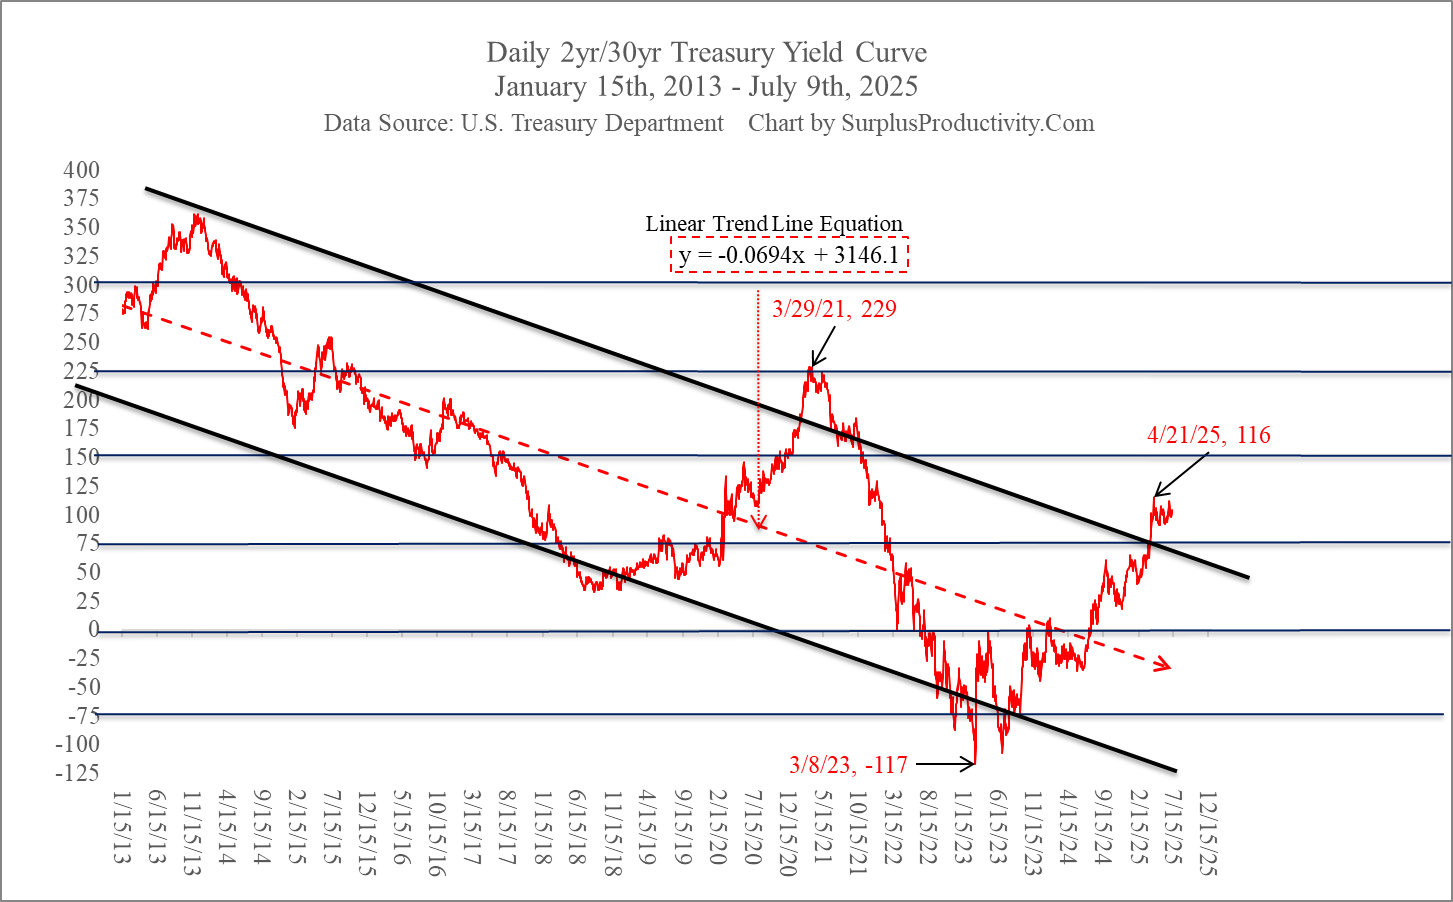
That in mind, a look at the front end, in some longer-term (not 5000yrs) context, as it appears to be one security continuing along within triangulated RANGE …
2yy WEEKLY: watching triangulated levels of 4.00, 3.75% and 3.50% …
… in range, momentum adjusted from overBOUGHT in March to more overSOLD, bullishly crossing in June and now awaiting further clarity from DC … both 1600 and the Eccles building …
… perhaps not the Rosie Range but still, worth watching, nonetheless.
I’d say more IF I had something but I don’t. Almost weekend but first, supply has come and gone
ZH: 30Y Auction Stops Through Thanks To Near-Record Direct Bid
… and as the day came to a close and the dust settled, prior to Canadian tariff announcement …
ZH: Bitcoin Surges To New Record High, Momo Meltdown Continues As 'Uncertainty' Soars Again
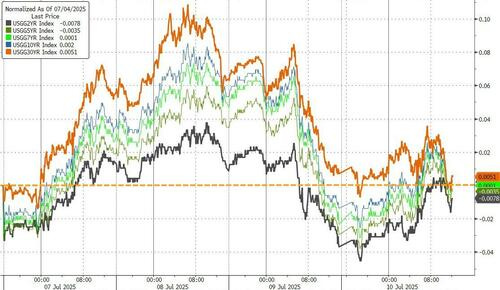
…Treasury yields were slightly higher on the day, but are all basically unchanged on the week now...
AND … here is a snapshot OF USTs as of 705a:
… HEREis what this shop says be behind the price action overnight…
… WHILE YOU SLEPT USTs experienced a see-saw Asia session reaction to tariff headlines, with a risk-off response to the 35% Canada threat, following by a directional reversal in duration on the headline that the WH will be “keeping USMCA tariff exemptions in place”. During the ups and downs, our Tokyo desk reported client activity was unexpectedly muted despite some interest in 30y. Into the LDN handoff, better buyers were seen in 10s from a wide variety of RM accounts, and good two-way flow in 5s with volumes ~75% vs the recent average. In LDN, curve steepening interest was cited from fast money types, but overall activity remained subdued with the market largely range-bound and awaiting next week’s inflation data. SPX futures are marked -0.7% here at 7am, DAX -1.2%, and Crude +0.5%. Gold is +0.6%, XBT +4% to new ATHs, and the DXY slightly bid +0.1%.
… for somewhat MORE of the news you might be able to use … a few more curated links for your dining and dancing pleasure …
NEWSQUAWK US Market Open: Stocks subdued and DXY firm ahead of potential US/EU trade letter … Benchmarks derived support from overnight Trump updates on Canada and a potential 20% tariff for those who do not have a deal. Thereafter, gradually faded from highs in the European morning awaiting a fresh catalyst before extending to lows in the period after a hawkish text from Schnabel … Specifically, USTs notched a 111-08 peak which was a few ticks shy of Monday’s 111-12+ best and the WTD high at 111-13+. While under pressure since and falling into the red the move remains relatively minimal in nature and comfortably in existing 110-21+ to 111-13+ WTD parameters.
Following the June labour market report, Stephen Miran, head of the Council of Economic Advisors, stated somewhat proudly that native-born Americans have been driving job growth since Trump took office, rather than foreign-born workers under Biden. The combination of a crackdown on illegal immigration, ICE raids (who’s funding just increased from roughly $8 billion to about $75 billion in the OBBBA), and a voluntary reduction in immigration by the rest of the world, has drastically changed the labour market outlook. This has implications for the Fed’s employment mandate as well as potential GDP growth.
… sorry, but now if I’ve gotta have that song (ICE, ICE baby) in my head all day long, you do too …
What are they thinking about inbetween sets over there across the pond? Next weeks CPI of course …
10 July 2025 Barclays: US CPI Inflation Preview (June 2025): Core inflation expected tolooksoft, again
Following May's downside surprise, we expect core inflation accelerated 10bp, to 0.23% m/m (2.9% y/y), still a soft print by any standard amid a modest run-up in core goods and core services inflation. We estimate headline CPI rounded up to 0.3% m/m (2.6% y/y), and the NSA index was at 322.401…
…We continue to expect core inflation to accelerate in coming months, peaking in early autumn amid tariff pass-through to consumer prices. We expect core CPI to end the year at 3.7% y/y (Figures 7, 8 and 9), about 0.1pp higher than our previous baseline, accounting for the dollar depreciation, although the effects we incorporate are somewhat weaker than what traditional estimates would indicate, as we wait to see if this weakness persists. We think risks to our CPI forecasts are skewed to the upside amid evolving tariff announcements. The tariff changes indicated in Trump's recent letters would bring the US trade-weighted tariff rate to 17.5%, 2.5pp higher than our working baseline assumption.
… soft is, um … good, in this case … right? Anyways, a few words on stonks from this very same shop as we enter that period of time where the MBAs or the PhDs will be proven right …
Margin pressure is likely in 2Q25 from a combo of tariffs, waning pricing power and a wary consumer. Can Big Tech come to the rescue yet again? Can 2Q25 deliver upside surprise vs bleak expectations like 1Q25 did? A lot is riding on 2Q25.
…The Treasury market cheapened on Thursday but managed to retain the range with 10-year yields tethered to the 200-day moving-average at 4.335%. Our bias to see the US rates market hold a narrow range for several weeks remains intact, particularly as many of the key bond-bearish risks having receded while the real economy remains strong enough to prevent a more material rally in duration. The prospects for a bearish breakout next week hinge on the potential for an upside surprise in core-CPI that reveals a significant pass-through of tariffs to consumer prices. This isn’t our base case scenario; it is simply the most conceivable way to envision a sharp cheapening in Treasuries. The logic would follow that if the impact was already evident in June – before the latest round of tariffs hit on August 1, then we’re poised for a summer of reflation.
On the flipside, a benign inflation update (which is our base case) would leave the longer end of the curve in consolidation mode. Admittedly, it is not the most exciting call. That said, a sideways shuffle in rates at current levels as the market awaits the next durable shift in the macro narrative is the path of least resistance – our favored route, to be sure. Assuming we see more of the same on the inflation front next week, we suspect that the theme of downplaying Trump’s tariff letters will continue. The trade war is no longer defining the trend in US rates, or at least the current iteration hasn’t been linked to any dramatic price action. It isn’t wasted on us that the bulk of the more ‘sticker shock’ tariffs are being levied (pun intended) against minor trading partners. Japan and South Korea are the obvious exceptions; although our sense is that an improved outcome will be reached with these two nations before the August 1 deadline.
This week’s auction results have further reinforced the notion that we’re not overdue for a bearish correction. The stop-through for the long-bond was an encouraging development and, once again, showed no indication of the feared buyers’ strike for the duration-heavy 30-year sector. The one nuance for 10s and 30s this week has been an apparent rotation from indirects into directs. It’s challenging to interpret this particular set of tea leaves given the breadth of the category of direct bidders. Once the Treasury Department publishes the allotment data on July 22, the market will have a better sense of shifting appetite between domestic and overseas buyers. That said, the long bond is not typically a go-to issue for overseas participants.
Studying for the test? Next weeks CPI, that is … this shop over in France is …
Effective tariff rates jumped in June after remaining subdued in April–May, aligning with survey signals that firms intend to pass higher tariff costs through to consumers in the coming months.
We expect firmer core goods and non-shelter services to drive 0.30% m/m core and headline prints. Risks look balanced, with another month of delayed pass-through and weakness in discretionary spending bringing downside risks to core goods, airfares and hotel prices, while larger-than-expected snapbacks pose upside risks to non-shelter services, rent of primary residence, and used vehicle prices.
June CPI is the first of three reports before the September FOMC that will inform the committee’s judgment of tariff pass-through and strongly influence its interest rate policy decisions. We think visible tariff pass-through over the summer and associated risks keep the Fed on hold through year-end.
Bond funds garnering more searches than tech stocks? No way …
July 10, 2025 DataTREK: Retail Investors Love BTC, NVDA... Bond Funds?
…Today we have an update on Google Trends search volumes related to retail investor sentiment. For many years we’ve found Google Trends to be a useful, crowdsourced indictor of broad social attention on a slew of topics.
Five points here:
#1: Worldwide Google search volumes for the largest virtual currency are historically low despite the digital asset making new highs…
…#2: Gold peaked at $3,453/oz on June 13th and global/US search volumes for popular gold ETF “GLD” are structurally higher than pre-pandemic…
…#3: US retail investors have paid NVDA more attention than TSLA over the last 1 ½ years as the former stock has made investors a lot more money than the latter (+232 vs +25 pct since YE 2023)…
…#4: Despite growth stocks consistently delivering superior returns, value stocks have received double the search volumes over the last 5 years…
…#5: “Bond fund” has generally received more US search interest than “tech stock” throughout the current bull equity market.
Takeaway: This comparison helps explain the consistency of bond fund inflows. The peak in “tech stock” was in February 2021 at the top of the Pandemic-fueled speculative bubble. There was a spike for this same search in late January 2025 ahead of the pullback that ensued this past February. There was also one in mid-June, however, right before US equities took off again but it has settled down since. Ultimately, bursts in performance to the downside or upside drive attention.
Bottom line: Social attention on various investments has waned of late amid record high prices, a feature of a bull market given that selloffs are more likely to drive interest unless there’s a speculative bubble. The fact that interest has trended lower means the latter isn’t the case, and that the current rally has yet to drive animal spirits to unsustainable levels.
… welp, … way !!!
Upside risks to manufacturing means what, again, to rate CUT(s) expectations?
10 July 2025 DB: Chart Of The Day - Upside risks to global manufacturing
Leading indicators suggest upside risks to global manufacturing.
The (tech-heavy) set of leading indicators is consistent with the global manufacturing PMI close to its all-time highs, approximately 5pt higher than current levels.
The relationship between these leading indicators and global manufacturing has weakened in recent years, most likely due to the combined impact of (1) Covid distortions, (2) the decoupling of AI-driven technology investments from the wider manufacturing sector, and more recently (3) the potential impact of tariffs.
… After a quiet day on the trade front, the White House made some big announcements overnight. First, there were reports that President Trump had told NBC News that he plans to implement a 15-20% tariff rate on most trading partners, saying “we’re just going to say all of the remaining countries are going to pay, whether it’s 20% or 15%. We’ll work that out now.” This was followed by news that President Trump was going to place a 35% tariff rate on Canada effective August 1st, though it does seem this is only for goods not covered by the USMCA trade deal, so its scope would be more limited. So the bark is probably stronger than the bite here and this probably reflects why S&P futures are only down a couple of tenths so far this morning.
There was also further clarification on copper goods overnight, with Bloomberg reporting that the administration plans on including semi-finished products – which includes wires, sheets, and tubes – whereas the initial expectation was that the levy would be on refined copper. Away from explicit tariff news, the President announced that he expects the Senate to pass a bill on Russian sanctions and that he would be making a “major statement” on Russia on Monday…
…That US 30yr Treasury auction saw $22bn of bonds issued at a 4.899% yield relative to the bonds trading at 4.890%. 30yr yields were already about +2bps higher at the time of the auction, but following the auction long end yields drifted lower before finally finishing just 0.1bp higher at 4.869%. Meanwhile, the short-end sold off more with 2yr US Treasury yields +2.9bps higher to 3.87% and 10yr yields rose 1.8bps to 4.350%. This morning in Asia, 10 and 30yr US yields are around +1.2bps higher…
…On the balance sheet, Waller mentioned that the central bank should reduce reserves to near $2.7tr from the current $3.26tr and consider shifting the composition of the balance sheet toward T-bills. Later, Federal Reserve Bank of San Francisco President Daly struck a dovish tone herself, saying she expected two rate cuts this y ear. She also noted that consumer prices have not been as affected by tariffs as companies are absorbing the price hikes in their margins. So yesterday demonstrated the range of views evident in the Fed minutes from earlier in the week. Otherwise, there were also fresh calls from President Trump for lower rates, as he posted about several positive metrics, and said that “FED SHOULD RAPIDLY LOWER RATE TO REFLECT THIS STRENGTH. ” Our take would be that most of the positive argument are reasons why the Fed Funds rate is in the right place currently if you take what he said at face value.
Another catalyst for the small global bond sell-off was growing optimism about the US economy, as the weekly initial jobless claims fell for a 4th consecutive week. That series had generated growing concern, as it’s a high-frequency indicator we get in near real time, and in mid-June the 4-week moving average had risen to its highest since August 2023. So that fed into the speculation about a July rate cut, particularly with inflation also staying subdued. But recent weeks have seen a notable improvement, with claims down to 227k in the week ending July 5 (vs. 235k expected). So coupled with the resilience in last week’s jobs report, where payrolls were stronger than expected, that’s helped to ease fears about how the US economy rounded out Q2….
Fiscal follies here, there and everywhere … are still ‘in the air’ …
10 July 2025 ING Rates Spark: A sniff of positive US fiscal data in the air
Eurozone yields have decided to chime in with the rising trend as we progress towards the end of week. US yields are more conflicted. The 10yr and 30yr auctions were fine, and there is a sniff of a positive "surprise" from the June fiscal deficit data due on Friday afternoon, helped in part by tarif income (but and also from timing issues)
The US deficit number for June is shaping up to be better than expected The 30yr auction went well enough. It was helped by a cheapening process into the auction event, and in the end got done at a slight price premium to secondary. It was also rewarded by a positive market in the wake of that auction, as yields drifted back down toward the lows of the day. The 10yr has settled back in the 4.35% area. It's been a quiet data week, and Friday serves up a release that typically does not garner huge attention, but it is a key one to monitor as we progress through the coming months - the monthly budget balance. Friday's release is for June.
The market survey is braced for a $30bn fiscal deficit on the month. But it's a volatile series. There was a $316bn deficit for May. A useful reference was the $71bn deficit recorded for June last year. The CBO, however, estimates that June will see a moderate surplus of $24bn. This partly reflects timing issues on the spending side, and large reductions in Department of Education and FDIC costs. It also reflects higher revenues from tariffs, with customs duties projected at up some 90% for fiscal year 2025 compared with 2024 (in cash terms, up $50bn on the year).
If realised these data will be supportive for Treasuries. One thing is true, the revenue benefits from tariffs and the cost cutting from Department of Government Efficiency should act up front to calm the deficit data. It's in 2026 when the tax cutting bill hits revenues. The market should of course be taking both into account as a basic discount, but the better news does come first…
What a relief … auctions (here, there and everywhere) now behind us and a global MACRO recap …
UST curve bear-flattens as better-than-expected labor data weighs on the front-end, while solid 30y UST auction supports the long end; smooth 20y JGB auction; BoK and CBE on hold; oil futures drop; AxJ currencies mostly gain; DXY at 97.60 (+0.0%); US 10y at 4.350% (+1.8bp).
…Major Moves and Catalysts
Better-than-feared auctions support long-end UST and JGBs, while US risk sentiment remains supported despite recent tariff announcements.
UST curve bear-flattens after a better-than-expected 30y auction supports the long-end (30y: +0.1bp). The auction comes 0.1bp through the when-issued yield, led by strong demand from direct participants whose allotment grows to 27% (P: 23%; 1y Average: 21%), offsetting a drop in indirect allotment to 60% (P: 65%; 1y Average: 65%).
Front-end USTs cheapen (2y: +3bp) after an unexpected drop in US Initial Jobless Claims and as the rise in Continuing Claims continues to stall, easing some labor market fears. The UST curve is little impacted by fedspeak with Fed Governor Waller and San Francisco President Daly continuing to point to rate cuts this year. Market pricing implies ~67% probability of a rate cut in September.
A better-than-feared 20y JGB auction, supports a belly-led JGB rally. The auction has a cut-off price of 100.05 (C: 100.10), but the tail of 18c was smaller than the prior two months and close to the 2024 average. TONA-OIS curve twist flattens, outperforming super long-end JGBs, while XCCY basis tightens in the super-long end and widens in less than 2y sectors…
While it would seem to ME to be premature, there continues to be no shortage of CPI precaps and so, here’s another …
July 10, 2025 MS: CPI Preview: Firmer with a mild tariff push
Core CPI at 0.28% m/m (2.96% y/y), higher than May but with mixed evidence of a tariff-induced push. Core goods inflation comes positive, but new cars remains weak. We see stronger services inflation after the downward surprise last month. Headline at 0.31% m/m, 2.7% y/y, NSA Index: 322.627.
… and same shop with another look ahead, economically speaking …
July 11, 2025 MS US Economics Weekly: Fiscal impulse insufficient to offset drags from tariffs and immigration
Higher tariffs are back. Or are they? Either way, we do not see them as offset by a coming fiscal impulse. The One Big Beautiful Bill is expected to bring a fiscal impulse of about 0.4pp to real GDP in 2026 and 0.2% in 2027, modestly more than we had penciled in.
Key takeaways
If the new tariffs go into effect on August 1, the effective tariff rate will climb to 17-18%.
Those looking for a significant fiscal impulse to growth from the OBBB are likely to be disappointed. We add only 0.2pp to our growth projection in 2026.
Attention turns to June CPI where we expect a mild tariff push that leaves core CPI inflation up 0.28% m/m and 3.0% y/y.
…High-frequency container traffic We expect the de-escalation in tariffs between th:e US and China lessens the risk of a prolonged stop in trade, though current tariff rates are still high relative to any period in recent history. We continue to provide a weekly update of data on container traffic. The number of vessels and used capacity fell again this week. Capacity YTD is still up versus 2024. We will continue to monitor the incoming data for signs of abrupt changes in trade patterns between the US and China.
The latest US tax increases were a 35% tax on products from Canada—in spite of Canadian concessions over digital taxes. It is not clear if the tax applies to all Canadian products, or just products not covered by the revised NAFTA (currently taxed at 25%), or to oil (currently 10%). US President Trump signaled that when they were tired of the lost art of letter writing, all remaining countries would be taxed at 15% to 20% (the penguins of the Heard and McDonald Islands thus know their fate).
Most of Trump’s tax burden hits US consumers with a delay of several months. Potential food and fuel trade taxes would be rapidly more visible. Investors are inclined to assume that Trump will retreat as Trump has done so often. However, Trump yesterday suggested equity strength was a sign financial markets like tariffs. Thus, the paradox—markets are strong on the assumption Trump will retreat; markets being strong reduces the incentive for Trump to retreat…
… learn something new every day!!
… And from the Global Wall Street inbox TO the intertubes, a few curated links …
Fake money to be a source of demand for USTs, you say? Really? Yes, really …
July 11, 2025 Apollo: Stablecoins as a New Source of Demand for Treasuries
With the use of stablecoins growing rapidly for payments, cross-border transactions, and remittances, the global US dollar stablecoin market could grow significantly over the coming years.
This also means that US dollar stablecoins could be used more widely as a means of payment in Europe, Japan, Canada, Australia, and emerging markets.
As a result, the global growth in demand for stablecoins could become a significant new source of demand for short-term US government debt.
Academic papers find that large inflows into stablecoins lower three-month T-bill yields by 2 basis points within 10 days.
The bottom line is that stablecoin demand for T-bills could grow into trillions, and the likely result is a steeper curve with significant new demand in the front end.
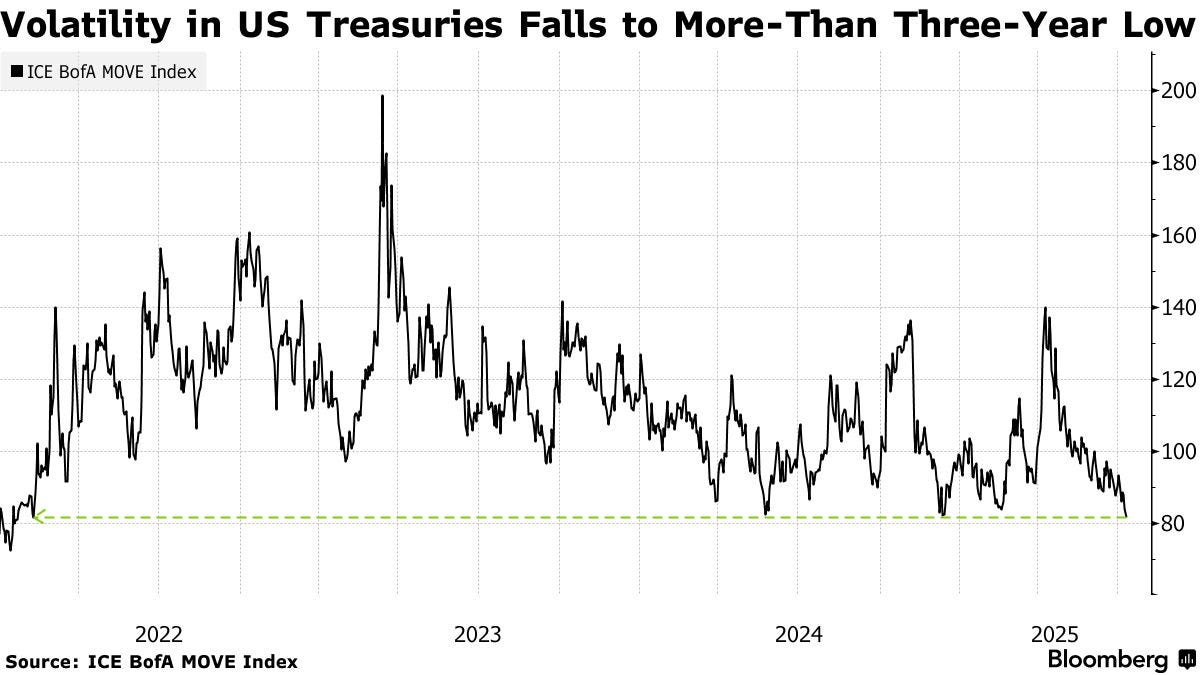
July 11, 2025 at 9:28 AM UTC Bloomberg: US Treasuries Volatility Gauge Falls to More Than Three-Year Low
…A gauge of volatility in US Treasuries fell to its lowest level in nearly three-and-a-half years, adding to evidence the market is stabilizing after months of turmoil.
The ICE BofA MOVE Index, a measure of expected fluctuations in yields, closed at its lowest level since early 2022 on Thursday. In another sign of optimism, auctions this week for US 10-year and 30-year government bonds received ample demand.
Government bonds have been pummeled this year by President Donald Trump’s trade tariff threats and concerns that increased fiscal spending will widen the budget deficit to unsustainable levels. Those headwinds haven’t entirely gone away though, and 10-year yields still inched higher on Friday, putting the bonds on track to fall for a second consecutive week.
Thursday’s auction of 30-year Treasuries was “well received, easing some concern,” Mohit Kumar, the chief European strategist at Jefferies International, wrote in a note. He added that he’s still “staying away from the long end” in the US, Europe and the UK given fiscal concerns.
Later on Friday, the US government will release its budget balance for June, and send out its primary dealer questionnaire to companies. Investors will be looking for “clues” in the latter that the Treasury could be considering shifts in its debt management strategy, a team of strategists at JP Morgan Chase & Co. led by Jay Barry said…
… it is summertime and so, it makes SOME sense but then, this too can / will change.
As the wait for Lacy Hunt’s latest continues, here’s something to read from someone I view to be as thoughtful and detailed / knowledgeable …
Jul 10, 2025 EPB: Crowding Out The Private Sector Unchecked government spending growth is smothering the private sector, eroding productivity and blurring the economic picture for policymakers.
The size of the US government has been growing for decades, but that trend accelerated after the major pandemic spending binge. As government spending increases, the less productive public sector absorbs more labor and resources, starving the more productive private sector of these critical inputs.
This year, private sector job creation has slowed dramatically, comparable to periods of near recession, while government job creation remains robust. This growing imbalance is not only undermining long-term productivity but also complicating the Federal Reserve’s ability to read the true strength of the cycle and tailor interest rate policy to the economy as a whole…
…Complicating Monetary Policy Decisions This bifurcated labor market presents challenges for the Federal Reserve, which is responsible for setting monetary policy that supports the economy as a whole.
As government size grows, sectors of the economy linked to the that government spending will be less sensitive to monetary policy.
However, as the productive private sector weakens, it will become more sensitive to interest rates and less vibrant.
Aggregate labor market statistics are not painting a picture for the Fed that would justify material interest rate cuts. However, lower interest rates are needed in many parts of the private sector, residential construction, and manufacturing in particular.
The distortionary effects of crowding out are likely to result in interest rate relief being implemented more slowly for these sectors in need.
Over the long run, as these trends continue unabated, the economy will suffer worse productivity and real growth outcomes.
If you don’t read Paul Wing-O-Metrics Winghart’s work, you should. Here’s an example of why …
Jul 10, 2025 SuprlusProductivity.Com: A Most Dangerous Path For Policy Frightening Journey Can Only Lead To Nightmare Results
There’s no middle in the Fed’s job
10yr Treasury auction results point to liquidity grab
Inflation expectations more than anchored
“Participants noted that the Committee might face difficult tradeoffs if elevated inflation proved to be more persistent while the outlook for employment weakened. If that were to occur, participants agreed that they would consider how far the economy is from each goal and the potentially different time horizons over which those respective gaps would be anticipated to close.” - June 17th-18th FOMC meeting minutes released July 9th, 2025 (emphasis added)
Its a dangerous thought, but still fortunately just a thought. At the same time, it is becoming pervasive which is all the more troubling. Of course, the thought we are alluding to, and pulled out in the above quote from the FOMC’s latest meeting minutes, is the notion that, somehow, policymakers can achieve one of their Congressionally goals without the other. That, however, is an economic impossibility due to the fact that both goals are either achieved or missed concurrently due to the shape of the output gap at any given point in time. As such, it is concerning to say the least, that policymakers are continuing to ponder a situation where a time exists that one goal is met and the other isn’t.
The Fed can either attain stable prices and full employment at the same time or they can’t achieve either as both are simultaneously controlled by the state of the output gap which is measured mostly by the shape of the U.S. Treasury yield curves.
Time is and isn’t on the Fed’s side when it comes to managing monetary policy as they have adequate resolve in the longer-term to set thing right but significant consequences in the nearer term the further they are from the correct course…
… AND on THAT note, not only is it Friday AND payday, it’s also July 11, aka 7-11, which can mean only one thing … gotta go out and get yers, JPOW did …