while WE slept: USTs cheaper/steeper (concession?)on above avg volumes; RIKS cuts, Earl SKIDS and USTs in a "Dead Zone"
Good morning … apparently supply created it’s own demand …
ZH: Stellar 3Y Auction Stops-Through Thanks To Jump In Foreign Demand
… at least on the (Fed sensitive)front end … barring any further commentary from non voting FOMC member Ka$hkari, a quiet day ahead so an opportune time to ask IF you #Got10s (or want some) as they are sure to put the FUN in reFUNding …
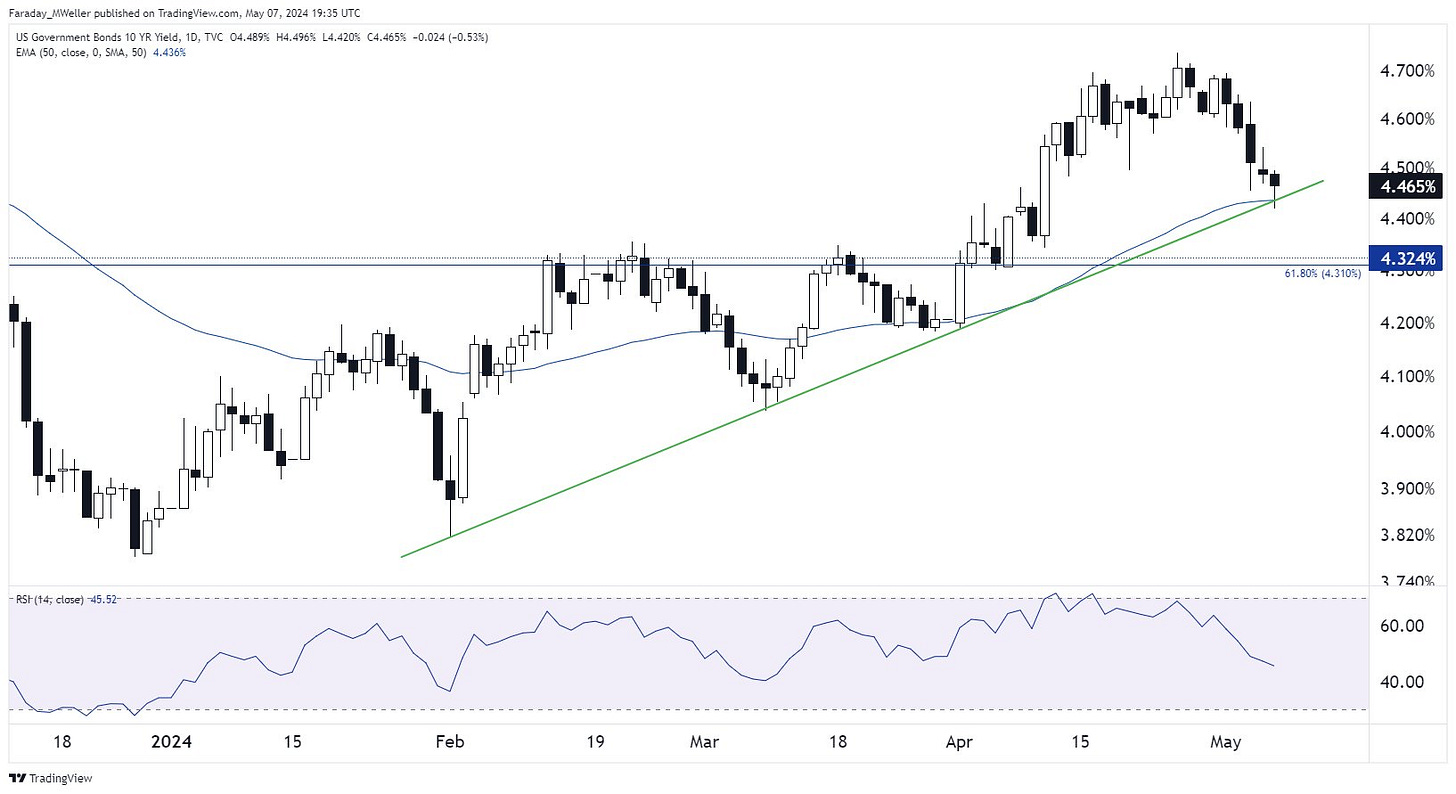
10yy: bottom of 2024 trend (which clues from 2s have broken) as momentum overBOUGHT …
… channel is a guide, not a hard and fast rule as we know, trends are our friends until they bends and everyone is quick to then redraw the lines, move the goalposts, not unlike Lucy snaggin’ away the football …
… and there’s another saying out there on Global Wall and it is to NEVER sell a quiet markets. I’ll deal with that (actually a large German institution alluded to it) in just a moment, but for now in some other news (using that term loosely) …
ZH: Shocking Collapse In Credit Card Debt Growth Just As Card APRs Hit All Time High
… and all in, the Ka$hkari comments mattered even though he’s not a voter until 2026?
ZH: Kashkari & Consumer Credit Curtail Stock & Bond Gains
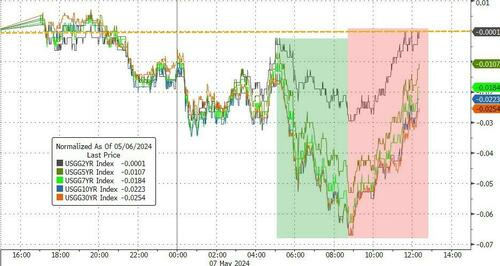
… Treasury bonds also reversed on Kashkari's comments (yields reversing higher to almost erase earlier declines)...
… here is a snapshot OF USTs as of 705a:
… HERE is what this shop says be behind the price action overnight…
… WHILE YOU SLEPT
Treasuries are cheaper and modestly steeper, seeing some concession emerge for the 42bn 10y auction today. Flows out the curve have been subdued after some evidence of capitulation yesterday, our desk reporting flows skewed towards better selling from fast$ and systematic accounts in the front end. Belly mean-reversion forces also at work with 2s5s10s +0.6bps this morning, led by real yields. Overnight weakness across energy (XB -1.8%, CL -0.8%) has translated to some weakness in commod-FX (AUD -0.4%, RUB -0.5%), while equity futures are indicating a softer open (S&Ps -6pts, Nasdaq -20pts) with the FTSE a tad weaker here (-0.2%) after losses were seen in APAC (NKY -1.6%, ChiNxt -1.4%) on hawkish rhetoric from the BoJ’s Ueda (linked above). There were 2 clips of TYs selling block in Asian (190k/01 each). UST volumes are running ~110% the 30d average.
… and for some MORE of the news you might be able to use…
IGMs Press Picks: May 08 2024
NEWSQUAWK: US Market Open: Stateside equity futures flat, Dollar firmer vs G10 peers & Bonds pressured ahead of supply and Fed speak … Bonds pressured, taking a breather from this week’s advances … USTs are a touch softer, in-fitting with the narrative outlined for Bunds above but with USTs yet to meaningfully or lastingly deviate from the unchanged mark in narrow 108-28+ to 109-03 bounds. 10yr supply and Fed speak from Cook, Collins and Jefferson scheduled.
Reuters Morning Bid: Stocks buoyant as Sweden cuts, oil skids
Finviz (for everything else I might have overlooked …)
Moving from some of the news to some of THE VIEWS you might be able to use… here’s SOME of what Global Wall St is sayin’ …
BNP US rates: Risks of a regime shift in longer-end yields
Higher-for-longer Fed policy and a potential shift higher in the nominal growth anchor/term premia risks a clearer regime shift to higher intermediate and longer-term yields.
While payer skew on longer tenors reflects some of this risk, we believe it is still worth owning in various formats.
… Last fall, intermediate and longer-end yields shifted slightly through the top end of the lower-for-longer regime in the aftermath of the 2022-2023 rate-hiking cycle, increased UST supply and above-trend growth (Figure 1).
… Meaningful deviations from the anchor appear to occur when the trailing average of short-term rates (18m average of 3m T-bill yield) persistently exceeds or undershoots the growth anchor (Figure 2).
… Stronger relationship with higher short-term yields: Our fed funds forecast (one 25bp cut this year, four 25bp cuts in 2025) implies that the 18m trailing 3m T-bill yield will reach 5.25% by Q3 2024 and will raise the premium versus the current growth anchor to 75bp (Figure 3).
CitiFX: Oil: At the precipice
Brent is finding support at its 55w MA (currently at 82.75). This is the only major level supporting both WTI and Brent futures. A weekly break lower in Brent would be the 'nail in the coffin' for techs, with several other indicators suggesting imminent downside of >4% in both.
What we are watching: IF Brent also closes below the 55w MA on a weekly basis, it would open the door to a 4% move lower in both WTI and Brent. This is supported by waning momentum, and a head and shoulder formation in techs. Our CTA buzzers are also close to flip short levels.
Go deeper with technical indicators:
WTI has already closed marginally below its 55w MA (78.40) last week. However, Brent is finding support at its 55w MA at 82.75 at the moment, limiting downside for both.
Weekly slow stochastics for both WTI and Brent have crossed lower from overbought territory, signalling a turn in momentum. Furthermore, this happens off deeply overbought levels which have signaled a major turn in the last four similar instances.
Head and shoulders formation in WTI supports the case for a move lower. Go deeper in our piece here.
Our CTA tracker has already pared its WTI 'max long' signal to 'long'. More importantly, it is just 0.7% away from the 'flip short' level at 77.70. Markets have already briefly traded below this level on Tuesday.
200w MA is a strong support level that has held through 2023.
DB: Dead zone
It’s a very quiet week in US data.
Following yesterday’s SLOOS, the rest of the week brings consumer credit, mortgage applications, wholesale inventories, unemployment claims, and preliminary UMich readings. Not exactly top tier. In FOMC communications, the broad message should be in line with the Chair’s press conference last week, with the most notable element being a shift away from calendar-based forward guidance (such as “later this year”).
Given the dead zone, US yields should trade relatively range bound.
For some perspective on that, today’s chart shows the average absolute weekly change in the 10y UST yield over the past year, split into two sub-samples: (1) weeks with top tier data, which we define as CPI, PCE, NFP, JOLTS, retail sales, ISM, and FOMC meetings, and (2) weeks without. Unsurprisingly, we see much smaller moves in this second set, with an average weekly change of 3bp, vs. 12bp in others.
In the absence of material data, we expect a slight downward drift to yields, in line with the momentum coming into the week and the notion that it will take hot inflation data to drive the next leg up. We generally see activity and labor market data as imparting a downward bias to yields at this point, in line with the Fed’s 2020 framework which embeds an asymmetric labor market response (with monetary policy responding to “shortfalls” rather than “deviations” from full employment). The one material upside risk this week comes from UST auctions, with $125bn in coupon supply hitting the market over the next three days.
DB: Trend inflation: Bent but not broken
The March PCE inflation readings remained as elevated as they were in February, resulting in a pause in the disinflation trend seen last year. Year-over-year headline PCE inflation increased 20bps to 2.7% while core PCE inflation fell only 2 bps to 2.82%. That said, our updated suite of statistical models indicated that our monthly mean and median estimates for trend inflation both declined by about 9bps to 2.7% and 3.0%, respectively. While the declines in trend inflation painted a more optimistic picture regarding the overall disinflation trend, both measures remained at elevated level.
As Chair Powell emphasized in the May FOMC meeting, these inflation readings confirmed a lack of further progress towards price stability and did not provide the greater confidence required to begin cutting rates (See May FOMC recap: Hold the line, cuts aren't always on time). Given that Fed officials likely will now need to see several more months of positive inflation data to affirm that inflation remains on the right track, removal of any calendar-based guidance on rate reductions makes sense – particularly, in light of a still strong labor market (See April jobs: Government hiring on spring break). We continue to expect one rate cut this year in December followed by the completion of a mid-cycle adjustment by mid-2025 (See (Pushed) Back to December).
JPM — The J.P. Morgan View: Consensus earnings expectations for this year look too optimistic
… Consensus earnings expectations for this year look too optimistic: Analysts’ projections imply that S&P 500 EPS will rise 17% from Q1 to Q4 2024; to achieve this, one needs to assume very high topline growth or a very strong expansion in profit margins. We are skeptical of both…
… Bonds
Bonds rallied with the US outperforming amid the softerthan-expected labor market data. While the FOMC statement contained some hawkish changes in language, Chair Powell’s Q&A took a less hawkish tone. Though the softer data and somewhat less hawkish tone by Powell is supportive for duration, there is still event risk given supply and approaching CPI data. We stay neutral duration outright and prefer 5s/30s steepeners to position for eventual easing as well as higher term premia.MS: US Economics: Three Fed Cuts, But A September Start (another UPDATED CALL)
We remain bullish on our call for three 25bp rate cuts this year, but are pushing out the start to September. A reversal in key components points to disinflation ahead, but given the lack of progress in recent months it will take a bit longer for the FOMC to gain confidence to take the first step.
Key takeaways
We were early to warn of a reacceleration in inflation in 1Q, but the data came in hotter than even we were anticipating.
Despite the data surprises, our recently updated forecasts support the view that reacceleration in 1Q was temporary and disinflation lies ahead.
Last week Chair Powell also reiterated his view that inflation will come down, and that policy is sufficiently restrictive.
The lack of progress since the start of the year means it will take longer for the FOMC to gain confidence that inflation is on a sustainable path toward 2%.
We shift the first cut from Jul to Sep to balance risks, remaining bullish on our call for three 25bp rate cuts this year and four 25bp cuts through mid-25.
PIMCO: Macro Signposts | Is Opportunistic Disinflation Back?
Is Fed Policy Returning to Opportunistic Disinflation?
The Federal Reserve’s view on interest rate risks has fundamentally changed since last year, when Fed Chair Jerome Powell indicated some pain in labor markets would likely be needed to tame inflation. At the press conference following last week’s Fed meeting, Powell acknowledged that sticky inflation means rate cuts will come later than previously expected, but with policy still restrictive, officials did not seriously consider additional hikes.
Instead, officials seem attentive to downside risks, such as rising unemployment, and appear ready to cut rates were the U.S. economy to deteriorate. With inflation having fallen dramatically from its peak, the Fed now appears comfortable to let it hang above the 2% target for a while.
Fed officials may not admit it, but this new approach feels akin to its opportunistic disinflation strategy of the 1990s.
Back to the 1990s?
Over the last few years, amid the inflation surge, Powell appeared determined to follow the approach of former Fed Chair Paul Volcker as Powell sought to moderate elevated inflation and “not stop until the job is done.” Indeed, Powell has presided over one of the fastest disinflations in U.S. history, with remarkably little pain in labor markets. Still, inflation isn’t yet fully back to target, and now seems stuck in 2.5% to 3.5% range, depending on the measure.
Interestingly, the Volcker-led Fed also didn’t sustainably return inflation to 2% – what is now the Fed’s long-term inflation target. But it did reduce inflation from 14.5% to 4% through a lengthy recession in the early 1980s. It took 20 years and two more recessions before the U.S. economy experienced a five-year period of 2% average inflation.
Why did inflation in the 1990s remain stubbornly above the level that officials considered consistent with the price stability mandate? In our view, it was due at least in part to a deliberate policy choice: the Greenspan-era monetary policy strategy of “opportunistic disinflation.”
In their seminal 1997 paper, “The Opportunistic Approach to Disinflation,” Athanasios Orphanides and David W. Wilcox describe the strategy through monetary-policy-type rules that say when inflation is elevated, the central bank should set policy at a sufficiently restrictive level so as to push inflation back down toward target. However, once inflation moderates below a threshold – in the 1990s, it appeared to be between 3% and 4% – the Fed should behave asymmetrically, attempting to guard against reacceleration, but avoiding tightening policy to the point that it creates further downward pressure on real economic activity or employment. The hope was that eventually a recession (or productivity boom) would come along and bring inflation back to target.
Potential benefits in today’s macro cycle
As we discussed in Macro Signposts back on 12 October 2022, there are potential economic benefits to tolerating some above-target inflation, and there are arguments in favor of employing this type of strategy now.
First, policy stability can reduce business uncertainty, leading to periods of capital deepening and rising productivity. By many accounts, the Fed’s conduct of monetary policy during the 1990s was a success. Constructing counterfactuals relies on uncertain assumptions, but it is hard to see how the economic outcomes of the late 1980s and 1990s could have been improved by an alternate monetary policy approach. Through the second half of the 1980s, the U.S. economy achieved sustained 4% real GDP growth and a sizable drop in the unemployment rate. This set the stage for further disinflation at a lower fed funds rate in the mid-1990s – a period characterized by significant macroeconomic (and interest rate) stability that, in turn, fostered heightened private tech investment that contributed to the productivity boom in the late 1990s. There are parallels to today: The increased spending needed to transition the global economy toward increased digitalization, renewable energy, and more resilient supply chains would almost certainly benefit from steady central bank policies.
Second, there isn’t necessarily some special magic in the number “2.” Indeed, the numeric 2% inflation target was introduced in 1988 by the Reserve Bank of New Zealand (RBNZ) when it committed to a 0%–2% range as a medium-term target, acknowledging a known roughly 2% upward bias in the official inflation statistics.1 The relative success of the RBNZ strategy ushered in a wave of other central banks formalizing numeric 2% targets. However, 2% just as easily could have been 3% or even 4%. Larry Ball has argued for a 4% target,2 and more recently, Jason Furman has advocated for 3%.3 Assessments of the real neutral rate may inform inflation targets as well – low neutral rate environments might benefit from somewhat higher central bank inflation targets. In principle, the Fed should be able to achieve stable inflation at whatever target it chooses.
Third, the so-called sacrifice ratio – i.e., the amount that unemployment must rise to reduce inflation by 1 percentage point – is probably nonlinear, and definitely uncertain. In the current cycle, high levels of job openings have meant only a small rise in the unemployment rate has coincided with the current disinflation. However, with the ratio of job openings to unemployed now getting closer to pre-pandemic levels, the unemployment rate may need to go higher for inflation to drop to and sustain 2%……Trading higher prices for macro stability?
After big moves in interest rates over the last few years, the U.S. may be poised for a period of elevated but relatively stable rates. Stable growth, low unemployment, and modestly above-target inflation is an economic mix that could keep the Fed from either aggressively cutting or aggressively hiking. Perhaps such a period would feel similar to the 1990s, and usher in a capital spending boom that fuels the economic transformations promoting future productivity. Or, we could be sowing the seeds for tomorrow’s financial stability risks.UBS: Rate cuts ahead?
…Developed economies’ central bankers need to ask themselves whether they want their policy stance to become ever more repressive toward economic growth. If the answer is “no”, then real interest rates should be stabilized (and a case may be made for them being reduced)—hence reacting to inflation. The problem is picking the inflation measure. Federal Reserve Chair Powell’s unnecessary elevation of the role of the consumer price index has probably delayed US rate cuts…
Yardeni: Monster Trucks With Monster Bills
…A big contributor to inflation remains owners' equivalent rent, a bizarre concept that is an estimate of how much rent homeowners would have to pay themselves if they were their own landlords. Without it, the inflation rate is already down almost to the Fed’s 2.0% target?
The Harmonized Index of Consumer Prices (HICP) is a measure of inflation in the Eurozone and the European Union. On its website, the Bureau of Labor Statistics (BLS) states: “The HICP differs from the U.S. Consumer Price Index (CPI) in two major respects. First, the HICP includes the rural population in its scope. Second, and probably more importantly, the HICP excludes owner-occupied housing. To construct the R-HICP, the CPI was narrowed to remove the owner-occupied housing costs that the HICP excludes from its scope. The CPI does not collect prices in rural areas, and the R-HICP uses price data collected for the CPI-U population, so this research index does not exactly match the population coverage of the HICP.”
The R-HICP measure of inflation has been closely tracking the headline CPI measure since the start of 2023 (chart). The former has been hovering between 2.1%-2.6% y/y since August 2023, while the latter has been hovering around 3.0%-3.7%.
Message to the Fed: Mission almost accomplished based on the HICP measure, which makes more sense than the CPI!
… And from Global Wall Street inbox TO the WWW,
Bloomberg: No, Jerome Powell Isn’t Playing Politics (Greenspan PUT had me at hello)
The Federal Reserve has demonstrated that it is relying on data to make interest-rate decisions.
… Some analysts interpreted the December pivot as a new “Fed put” — and thought Powell's latest press conference after the recent Federal Open Market Committee could be seen as the clincher. It is difficult to explain what a Fed put would look like without resorting to even more jargon. The Macro Compass’ Alfonso Peccatiello does a better job by summing it up as a situation where the monetary policy authority would “have the market’s back,” and investors would know that at any sign of market weakness, a big easing would be around the corner. But when the economy or inflation accelerated, the Fed wouldn’t react hawkishly but rather “let the economy run hot.” It was originally known as the “Greenspan Put” after the federal funds rate seemed to be rising and falling in response to the stock market during Alan Greenspan’s last decade as Fed chairman:
In the quarter century since people started talking about a Greenspan put, even more of Americans’ wealth is packed in pension funds, and indexes now ensure that everyone knows immediately when their holdings lose money. Hence any market downturn would incur voters’ displeasure. That, the cynical argument goes, prompts the Fed to bolster the stock market.
So far this year, the markets seem to be doing fine — nothing is broken yet, very much what the Fed wants. Many will read party politics into this, particularly when the challenger to the incumbent has plans to limit the Fed’s independence, which we can assume its governors want to avoid. But that’s not a sufficient basis for calling the credibility of the Fed into question. As Tom Porcelli, chief US economist at PGIM Fixed Income, argues, Powell’s team has demonstrated their reliance on data and isn’t swayed by anything that opens them to a political attack. After all, any misstep will prove not only costly to his legacy but to the Fed as an institution.
It’s very easy for people to want to go down the path of trying to make this about political development. But what if it’s worse? What if the Fed just really have a really bad angle on what's happening from an economic perspective? I always find it funny or interesting that it always comes down to politics.
It’s in the market’s interest that the Fed stay independent and its credibility intact. But there is very little it can do to prevent some of these aspersions, even if it wants to. The key focus through all this would be to keep to their word and be as proactive as possible. And in that regard, they have not done a bad job…
Bloomberg: 5 Things You Need to Know to Start Your Day: Americas (NO-FLATION, WTI edition!)
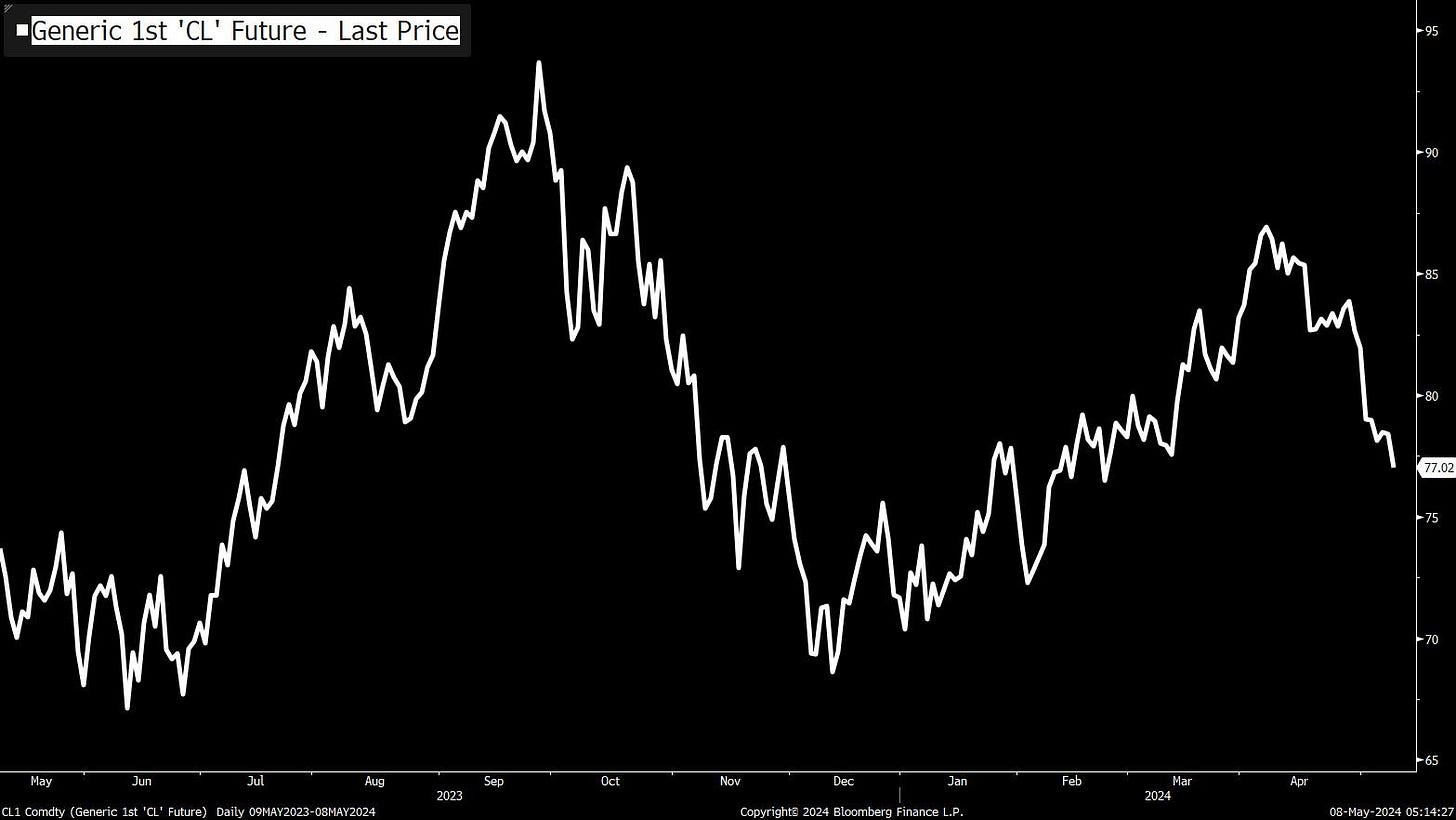
… Good morning. The price of a barrel of West Texas Intermediate crude is falling again today, and at least as of the time I'm typing this it's right around $77. Just a month ago, it was above $85.
Just from a simple macro standpoint, the line should help ease some of the "inflation overheating" narrative. Not only is this probably good news for gasoline costs, etc. but, since oil is an input into almost everything else one way or another, the decline should ease general pressures.
Also The White House's oil trading operation continues to look pretty good. Back on April 2, the US canceled a plan to buy oil to refill the Strategic Petroleum Reserve. Then yesterday, the administration said it planned to buy the dip, seeking as much as 3.3 million barrels…Game of Trades (via LinkedIN)
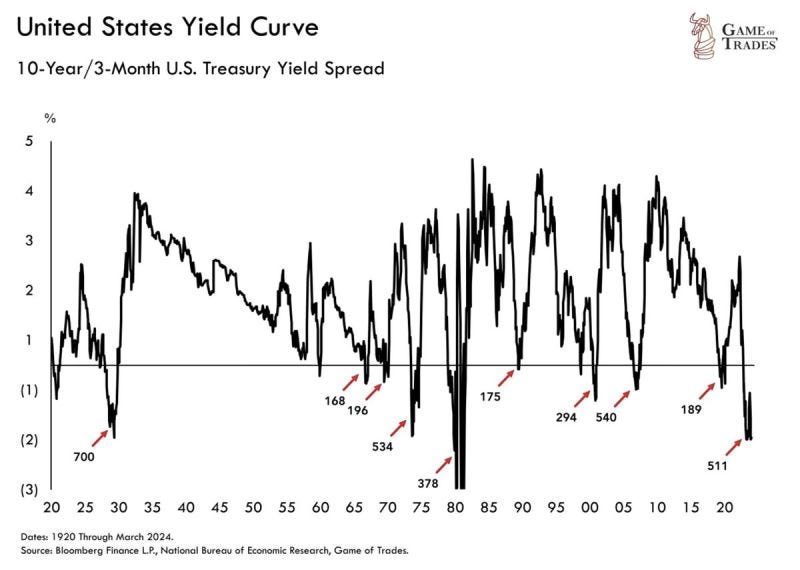
The yield curve has been inverted for +500 days
This has only happened 3 times since 1920:
1. 2008
2. 1929
3. 1974
All 3 saw more than 50% market declines
We expect a final rally to occur before recessionary concerns finally kick in later in 2024Activate to view larger image,
at MWellerFX (3:37 PM · May 7, 2024 … an FX guy? telling me what level to watch on 10s? 50dMA … we’re ALL experts, I suppose…at least in our own minds!)
All eyes on the 4.44% level in the benchmark 10yr Treasury bond.
Watch the 10yr Bond Auction tomorrow at 1:00pm ET - in a quiet week for US data and earnings, it's one of the biggest US event risks this week.
… THAT is all for now. Off to the day job…


'Opportunistic Disinflation'?! So have all of the Asset bubbles since the 80's been 'Opportunistic Inflation'? Not necessarily for the Bag Holders....