while WE slept: USTs cheaper on strong volumes; 10s back to 1800 (look cheap relative TO MA); JPMs updated call ...
Good morning … IF yer not confused and questioning which way the narrative winds are blowing in wake of the storm of confusion which was NFP this past Friday (recaps and victory laps HERE), then your not paying attention?
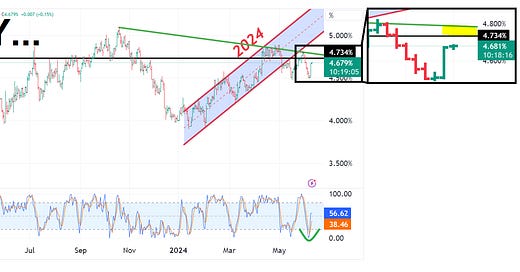
It is with this past weekends views fully in rear-view mirror (along with a couple WEEKLY visuals of issues up for sale this week) I wanted to lead with a look at 3yy DAILY given they will be on the auction block today AND given their sensitivity TO Fed Funds rate expectations …
3yy DAILY: 4.75% — an area (highlighted) of interest …
… get those bids in early and often?
… here is a snapshot OF USTs as of 705a:
… HERE is what this shop says be behind the price action overnight…
… WHILE YOU SLEPT
Treasuries are steeper and modestly cheaper after gapping on the Tokyo open (alongside weak JGBs). Desk flows there were rather quiet with some selling going through in intermediates, volumes ~120% the 30d ave. In London, our desk reports some light dip-buying demand in the belly from a few real$ client. Little in the way of notable selling out the curve has been seen, despite the steepening tone. Later today (1pm) we get the first leg of supply with 58bn 3s. USD-strength is seen across the board (EUR -0.6%, KRW -0.8%, MXN -0.3%), while commods are in slight positive territory (CL +0.2%, HG +0.6%, XAU +0.2%). The NYK was +0.9% overnight, the DAX -0.6% and S&P e-minis showing -0.1% here at 7am.
… and for some MORE of the news you might be able to use…
IGMs Press Picks: June 10 2024
NEWSQUAWK: US Market Open: European assets hit by EU election results, USD continues post-NFP gains … USTs are flat and resilient to the downbeat mood in European peers; OATs underperform after French President Macron calls for a snap election … USTs are currently immune to the downbeat mood in European fixed income markets; drivers this week for US paper include US CPI, FOMC alongside dot plots and a heavy supply slate. Sept'24 UST currently holding above the 109 mark, with the current low at 109.02.
Reuters Morning Bid: Europe jolted by Macron's snap election call
Finviz (for everything else I might have overlooked …)
Moving from some of the news to some of THE VIEWS you might be able to use… here’s SOME of what Global Wall St is sayin’ …
BARCAP UPDATE: June FOMC preview: Eyeing only one cut (when you see the word “UPDATE” you gotta slow down and read — often times more than once — as Global Wall moving goal posts …in THIS case, they are only updating / correcting a note out over weekend with minor tweak)
The focus of the June FOMC meeting will center on the statement, SEP, and press conference. We expect the dot plot to show a median of one rate cut in 2024 given upward revisions to inflation projections, and many dots indicating two cuts. Powell will likely stress this is not a promise, with the FOMC needing more confidence.
… We retain our baseline projection that the FOMC will cuts rates only once this year, at the earliest in September. Our baseline is predicated on inflation gradually moderating in the coming months on a sequential basis and the economy slowing. However, if inflation is stronger than in our baseline, we would expect the first rate cut to be postponed to December. We view this as almost as likely as our baseline scenario. For 2025, we expect the FOMC to cut rates four times.
BNP: Sunday Tea with BNPP: Payrolls and politics
KEY MESSAGES
Last week’s NFP print poured cold water on expectations of a more imminent deterioration of the US economy.
We expect to see a 0.3% m/m May core CPI print this week, alongside the FOMC’s median dot moving to two.
Volatility has been elevated on the back of political risk globally. To fade recent moves, we recently added a 5y rates spread receiver between MXN and USD.
… The stronger-than-expected NFP print pushed yields back into the range and the market will now need to digest both 3y and 10y UST supply ahead of key risk events midweek and 30y UST supply on Thursday. This leaves us feeling that yields can continue to rise into midweek, but the combination of supply, positioning and economic data has ultimately been range-reinforcing since Memorial Day. So while the price action of the past two weeks has increased realized volatility and interest in out-of-the-money options to play for a range break, our modal expectation is for a gradual economic slowdown with the first rate cut in December. This should keep prevailing yield ranges intact into the early summer months…
DB: Does CPI matter for the SEP? (short answer: NO)
CPI prints on the second day of this week’s FOMC meeting, raising questions about the extent to which the data might influence the SEP and in particular the fed funds rate projections. This note brings historical perspective to that question.
As we show, it isn’t that uncommon for CPI to print during the FOMC meeting. Focusing on the subset of SEP meetings when this has happened, we compare the initial fed funds rate projections – submitted ahead of the meeting and made public with other transcript materials with a five-year lag – to the final published dots. Across the sample of 14 meetings, not a single median dot has moved between the initial and final submissions and only one individual dot has been revised.
One interpretation of this is that Committee participants don’t factor the data into their projections until after the meeting. The alternative, which we find more compelling, is that while Committee participants are often data-dependent, they aren't data point-dependent, and their modal projections don’t turn on a single release. Regardless, the historical record argues against shifting expectations for this week's SEP based on Wednesday's CPI print.
DB: 2024: Structural headwinds, cyclical tailwinds? (10s back to 1800? yep …)
Welcome to the 26th annual default study where we look at the structural medium-term drivers of corporate defaults, how default rates are likely to evolve over the next 12 months, and how current credit spreads are priced with respect to this default risk. For much of the last decade or so, this study has explained why we believed in an ultra-low default world versus the past. However in 2022, we thought the risk was we'd see a structural change towards more normal levels of defaults going forward, and in 2023, thought we would see an elevated default cycle in 2024 due to a US recession. While we changed our view on the latter at the start of 2024 due to a more optimistic US growth outlook, does the argument of a structurally higher level for defaults still hold over the next few years, after 20 years of it being exceptionally low? We think it does.
Higher real rates will steadily increase the structural default trend, but at the moment, near 15-year highs in government real yields are being offset by BB/B credit spreads that are at the low end of their range over this period. So, credit real yields are being contained within their ultra-low default era (2004-) range for now.
Conditions may get steadily less favourable, as the record level 2–3-year HY maturity wall comes into view and a likely upward bias to term premia builds. For 40 years, virtually all fixed rate borrowers across the economy could refi at a lower rate than they’d previously achieved. This changed after 2022, but the full impact could still be slow to be felt. So there is perhaps a 'boiling frog' analogy here where the market doesn’t notice it, until it does. Borrowing costs will likely get progressively higher for corporates, with the risk being the weight of issuance at higher yields keeps defaults back at more historically normal levels after a 20-year ultra-low default world. This needn’t be a disaster and as this report always shows, spreads almost always compensate buy-and-hold diversified investors for average default risk.
Having said this, this years’ report shows that with spreads as low as they are, if you did go through a default cycle closer to that seen in the late 1980s/early 1990s, late 1990s/early 2000s or in the GFC, then buy-and-hold investors would currently likely lose money vs. the risk-free alternative in Single-Bs and below, with risks in BBs too.
The good news is that our models suggest that the risk of a cyclical spike in defaults has fallen over the last 12 months. So at the moment the base case is a cyclical dip in US defaults even if the medium-term view is for them to stay closer to average levels through history, rather than back to the ultra-low levels we’ve seen for most of the time since 2004.
… there is a catch to our argument. While government real yields have moved higher over this period, real credit yields have largely stayed within their post 2004- low default world range. As Figure 5 shows, 5yr US Treasury real yields are near their highest level since 2009, whether viewed against 5yr breakevens or headline CPI.
… A good way of looking at this structural refinancing risk is in Figure 7 where we show 10yr US yields and the 10yr moving average of this through time. In the 40 years to 2022, virtually everybody that needed to refinance in the US (and other major economies) were able to do so at a lower rate than they previously did regardless of when they last borrowed.
JPMs Global FI Weekly (a good ? NFP will do that … and by ‘that’ I mean force a(nother)moving of the goal posts — they’ve lost at ME personally at, ‘…to be fair’ …)
…Treasuries
Not going anywhere for a while?
Treasury yields dipped to a two-month low amid a weaker JOLTS report and a global bond rally, but reversed higher following a stronger-than-expected May payrolls report
Front-end yields remain significantly below their recent peaks, and pre-FOMC cyclicals suggest upside risk to yields in the coming days, especially as it may take a bigger concession to underwrite next week’s Treasury supply...
...However, it’s notable that Treasury yields have declined on FOMC days in each of the last 10 instances: should yields retrace back to their late-May highs we would look to add duration to tactically trade the ranges which have persisted in recent months
With the expected timing of the first cut getting pushed into the fall, we expect the Treasury curve to remain rangebound over the near term, with the probability of significant steepening likely to remain low until later this summer
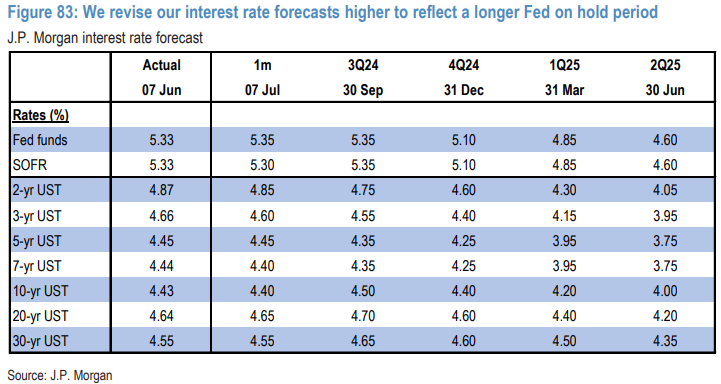
We raise our interest rate forecast to reflect a longer Fed on hold period. We expect rangebound yields in the coming months and raise our year-end targets for 10-year and 2-year Treasuries to 4.40% and 4.60%, respectively …
… Today’s data has pushed back on the narrative that the economy is slowing more aggressively, at least until the next round of first-tier data are out early in July. However, given the aggressive rise in yields today, it would be tempting to consider longs once again after taking profit on our equi-notional 2s/5s flatteners yesterday (see US Treasury Market Daily, 6/6/24). However, we prefer to be patient, for a number of reasons. First, front-end yields are significantly below last week’s local peak (Figure 79)…
… Separately, we make revisions to our interest rate forecast to reflect a longer Fed on hold (Figure 83). We expect yields to remain rangebound for the next 3 months: we raise our YE24 10-year yield forecast by 40bp to 4.40% and our year-end 2-year forecast by 45bp to 4.60%. This implies the long end displays a higher sensitivity to Fed expectations than we have observed recently. To be fair …
MS Weekly Warm-up: Mixed Data Supports Our Quality Bias
With macro data still mixed on both growth and inflation, a quality bias should continue to do well, in our view. We continue to fade small caps and lower quality stocks, which both underperformed late last week. EPS growth for the S&P 500 is beginning to pick up, in line with our base case view.
… The bad news is that this is also keeping inflation elevated which keeps the Fed's interest rate policy too tight for many economic participants. Some may disagree with that statement, but we think it's hard to argue with the yield curve which remains significantly inverted and still a valid indicator of interest rate policy, in our view (Exhibit 2).
Exhibit 2: Yield Curve Tells Us Rates Are Likely in Restrictive Territory
UBS: The importance of participation rates
… Friday’s strong US non-farm payrolls defied the consensus forecast, although the household survey signalled very weak employment. Markets blindly accepted the payroll data, but the survey on which it is based has a 25.2% response rate (down from around 75% a decade ago). In similar circumstances, the UK stopped publishing its employment data as being obviously unreliable …
… And from Global Wall Street inbox TO the WWW,
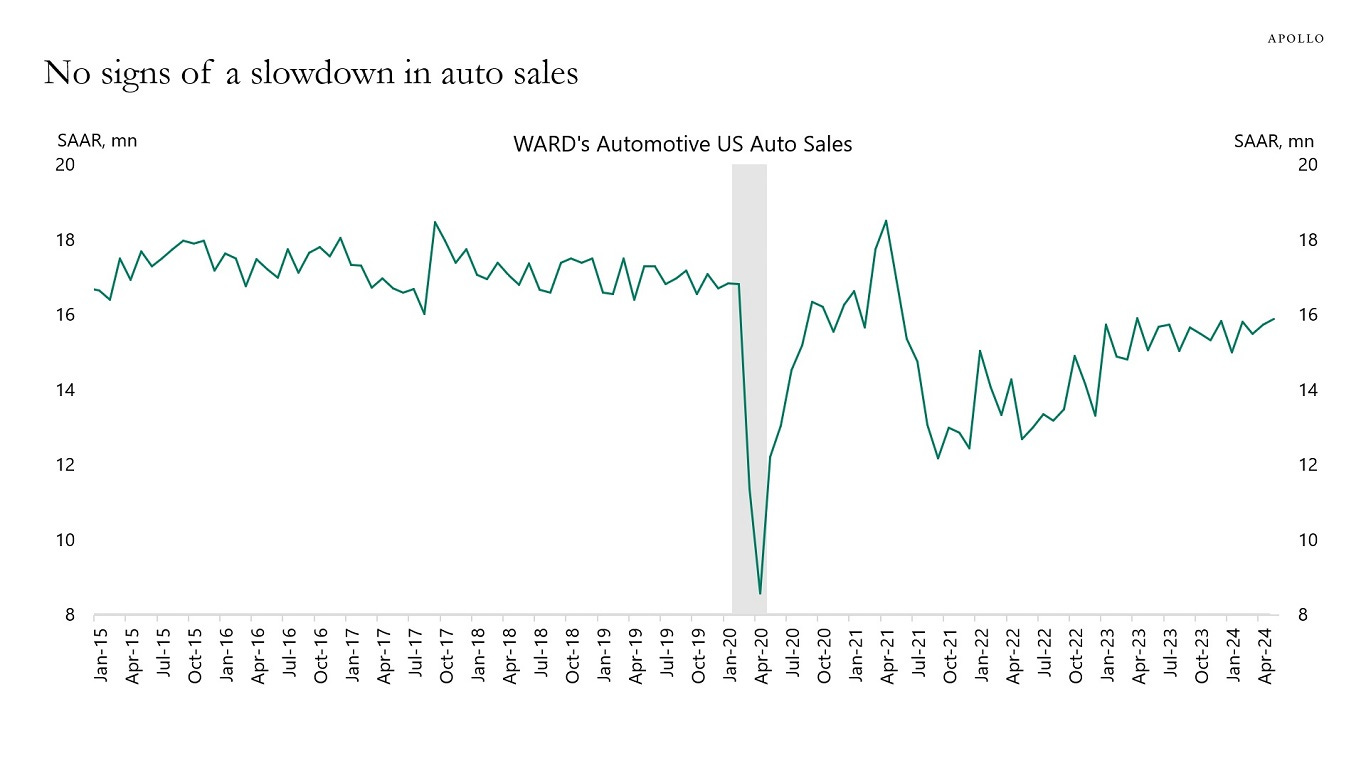
Apollo: Car Sales Very Strong (Team Rate CUT leans in, prepares retaliation …)
Although car sales are very sensitive to higher interest rates, the data for auto sales shows no signs of a slowdown. This suggests significant support for auto sales from wealth gains for households via higher stock prices, higher home prices, and higher cash flow from fixed income.
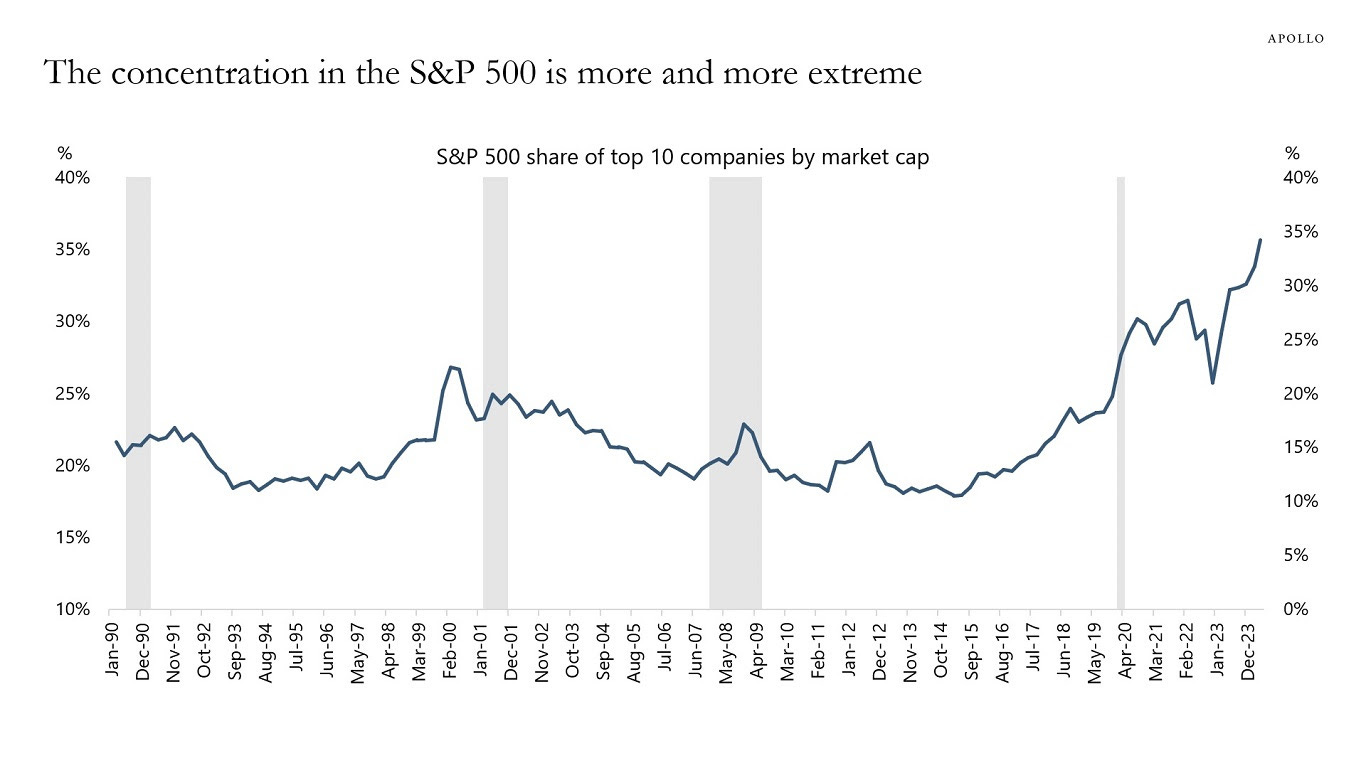
Apollo: Extreme Concentration in the S&P 500
The top 10 stocks in the S&P 500 now make up a record-high 35% of the index, see chart below.
Bloomberg: ‘Après moi, le déluge?’ Macron bets ‘oui’ (beyond France, Authers’ comments on bonds / data dependency — offering BOTH sides of the coin)
…Data-Dependency
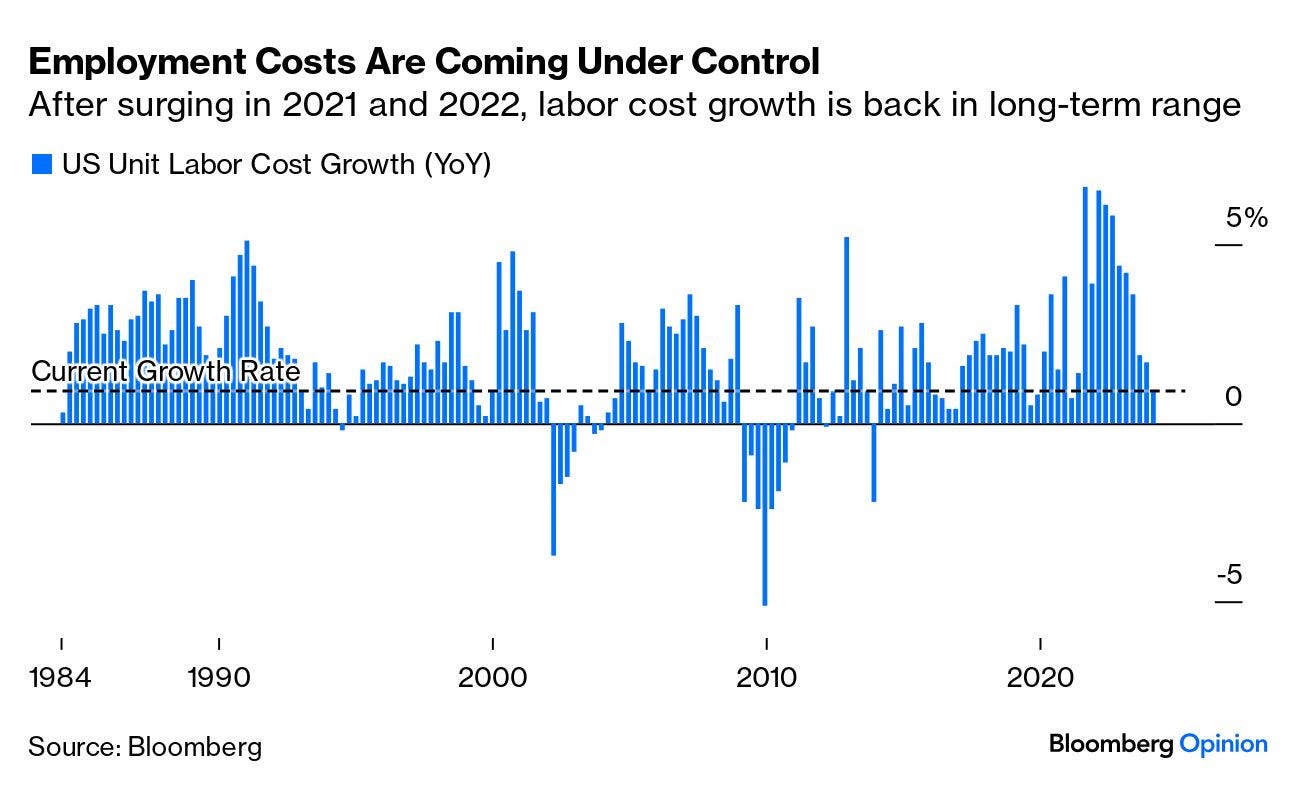
In the US, the central macroeconomic issue of the labor market refuses to clarify. Last week saw the standard data downloads to start the month. Numbers showing a weakening manufacturing sector, declining job vacancies and reduced increase in unit labor costs all were consistent with a narrative that the Fed’s higher interest rates are at last beginning to have an impact on employment. That should reduce inflationary pressure and is exactly what the Fed wants to see, especially the data on unit labor costs.Source: Bloomberg
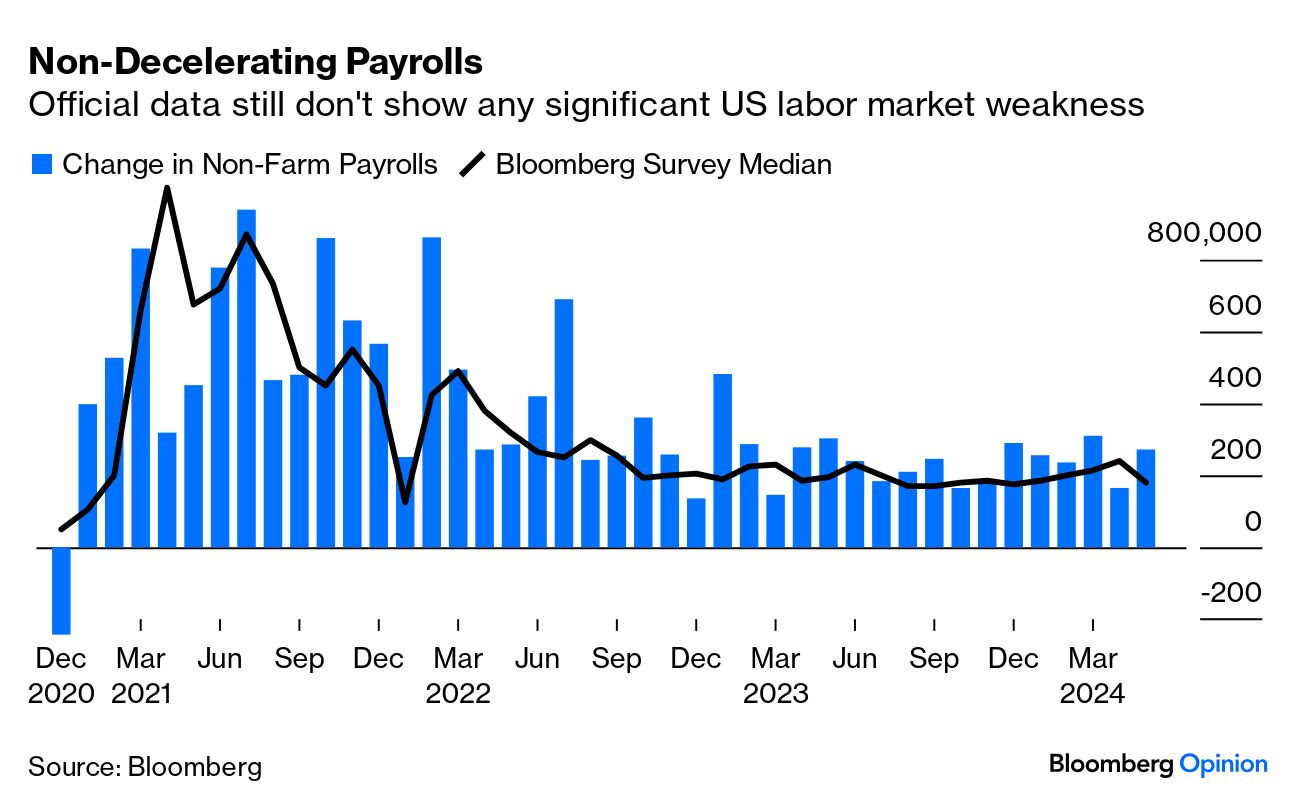
The estimate of private sector payrolls produced by the ADP payroll processing group also suggested the labor market was calming down. Then came Friday’s announcement of non-farm payrolls for May, revealing that the number of people in employment had increased by more than even the highest estimate:
Source: Bloomberg
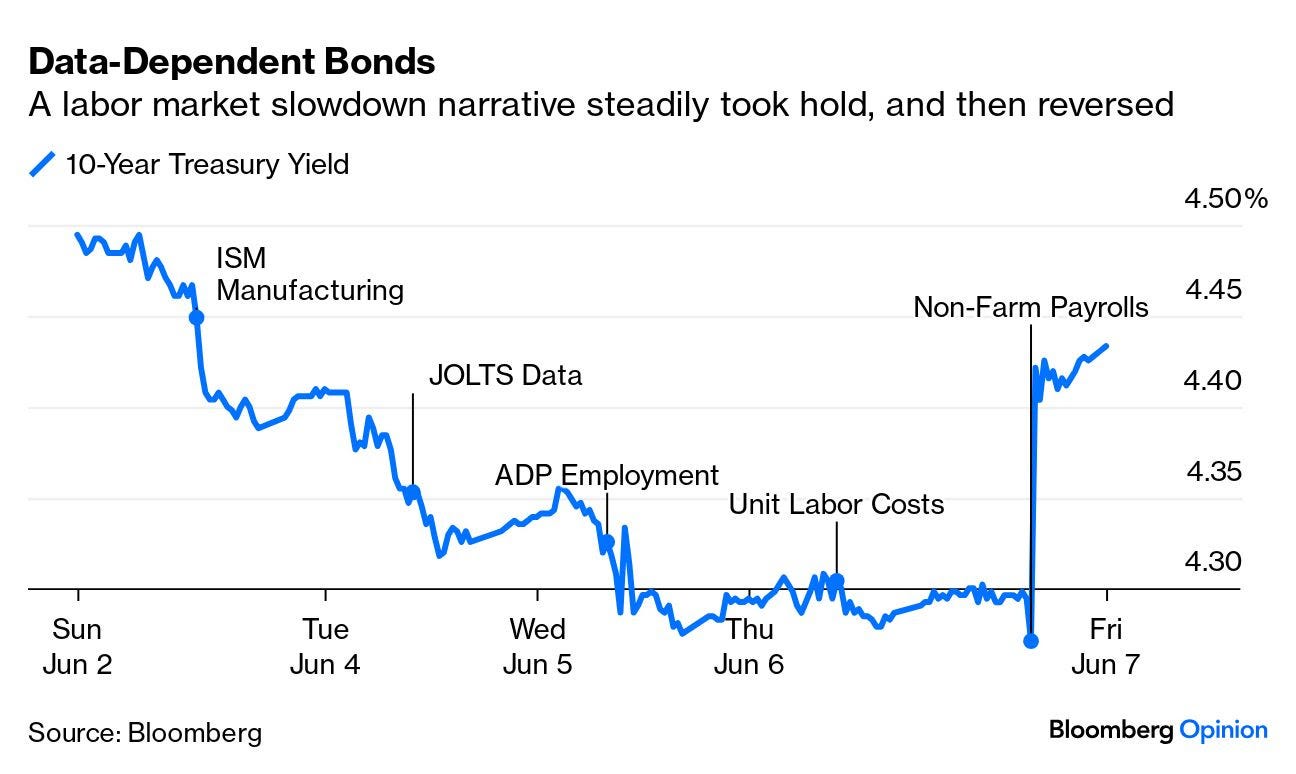
Further, the rate of increase in average weekly earnings picked up a little. The non-farm payroll data is notoriously subject to revision, as Jonathan Levin points out for Bloomberg Opinion, and the contrast with the official unemployment rate, which is compiled by a different process and rose to 4%, shows how murky the employment situation is. Meanwhile, this is what happened to the 10-year Treasury yield last week. The Fed may be data-dependent; so is the Treasury market;
Source: Bloomberg
Points of Return has used the analogy of descent from a mountain to describe the adjustment in rates and bond yields in the aftermath of the pandemic. We’ll be updating our project on that descent this week, ahead of what could be quite a Twilight of the Gods on Wednesday for bond traders, which will start with consumer price inflation numbers for May, and then continue with the Federal Open Market Committee meeting that will include a new “dot plot” estimating the future course of rates.
With actual cuts off the table, the focus will be on the dots, which may well be affected by the inflation data. If core inflation eased further in May, from its three-year low of 3.6% in April, that would give FOMC more confidence. If that happens, Mansoor Mohi-Uddin, chief economist at the Bank of Singapore, says he expects the FOMC “will still see rate cuts this year but trim their forecasts from three to two moves, the same as our own view for 2024.”
That’s roughly what’s embedded in the bond market heading into the week. But as last week demonstrates, it’s data-dependent …
ING Federal Reserve preview: More delays
The US Fed accepts monetary policy is restrictive, but lingering inflation and strong jobs numbers mean it will indicate it's prepared to wait longer before seriously considering interest rate cuts. The "dot plot" will be key. Having signalled three 25bp cuts in 2024 back in March, it could potentially go to just one; we're expecting two
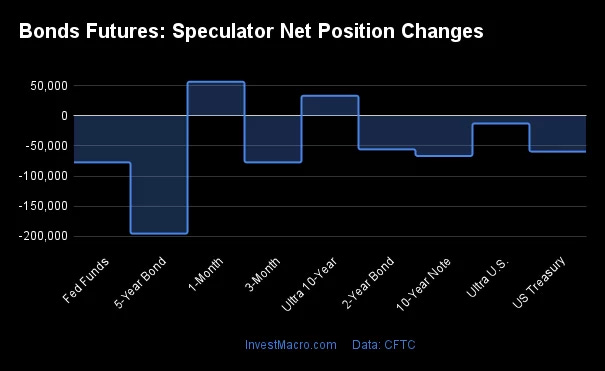
InvestMacro COT Bonds Charts: Speculator Bets led lower by 5-Year Bonds
… Bonds Net Speculators Leaderboard
Sam Ro from TKer: The simplest explanation isn't always the correct or complete one
Stocks rallied to new all-time highs, with the S&P 500 setting a record intraday high of 5,375.08 on Friday and a record closing high of 5,354.03 on Wednesday. For the week, the S&P gained 1.3% to end at 5,346.99. The index is now up 12.1% year to date and up 49.5% from its October 12, 2022 closing low of 3,577.03. For more on the stock market, read: 12 charts to consider with the stock market near record highs …
… Consider the impact of higher interest rates. Higher rates are bad, right?
… And for households, it’s not just cash in the bank. Record high stock prices and higher home prices have helped fuel household net worth to record highs.
If you’re sitting on a ton of wealth, do you really need to be putting away more money?
“Elevated net worth supports a low saving rate,” Deutsche Bank’s Matthew Luzzetti wrote on Monday.
TKer subscribers first read about this relationship last September when Renaissance Macro’s Neil Dutta explored this phenomenon.
“When you are ‘loaded,’ you have less reason to save,” Dutta wrote. “If my stock portfolio is rising and home prices are climbing, I don't feel like I need to be saving as much.“
ZH: Warren Buffett Controls 3% Of Treasury Bill Market, More Than "International Organizations, Stablecoin Issuers ..."
… Buffet's growing cash and or cash equivalents stockpiles intrigued fixed-income analysts at JPM, including a team led by Teresa Ho, who wrote in a recent note to clients that Berkshire Hathaway keeps excess cash primarily invested in T-bills.
"Over the years, their T-bill position has grown so large that, as of March-end, it owned $158bn in T-bills, comprising 3% of the market," Ho said.
She continued, "Berkshire Hathaway currently holds more T-bills than international organizations, stablecoin issuers, offshore MMFs, or LGIPs."
Berkshire Hathaway's current cash position is about 17.5%, which is in line with its long-term average when measured against the firm's total assets. Since 1997, the firm has kept cash on its balance sheet at an average of 13%.
Current figures from Bloomberg show Berkshire's cash and cash equivalents total $188 billion.
"We'd love to spend it, but we won't spend unless we think there's really something that has very little risk and can make us a lot of money," Buffett said at last month's annual meeting.
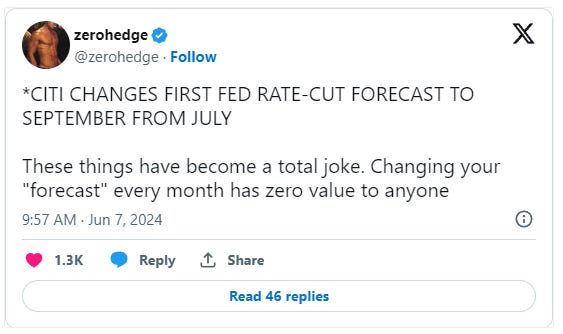
Buffett and his companies are cautious about finding deals as the high-for-longer interest rate environment unfolds, especially after Friday's screaming hot payrolls data forced Citi to shift its first rate cut forecast from July to September.
Fed swaps are only pricing in 1.58 cuts through the end of the year…
AND … THAT is all for now. Off to the day job…





Barchart: Food Costs are soaring to all-time highs
https://t.co/iGJiYYfbuz
https://www.newsmax.com/world/globaltalk/eu-election-right-migration-climate-polls-vote/2024/06/09/id/1168071/
Foreshadowing, of things to come ???