while WE slept: USTs cheaper as risk ON 'round the world (sponsored by China); "4 risks that markets are still concerned about" (DB); 'bout askin' better question (Hussman); FRBNY on UST liquidity
Good morning … Things have clearly deteriorated. The Fed making it’s bold move now China, overnight (again) recognizing things have turned and so are moving to ‘catch down’ in effort to stem the slide …
ZH: China Panics: Cuts Multiple Rates And Reserve Ratio Requirements, Goes All-In To Prop Up Stocks
… ahead of this afternoons 2yr auction kicking off the weeks $183bb coupon supply, I thought a good place to start might be …
2yy: SUPPORT up near 3.66% (where couple of TLINEs meet) …
… meanwhile, momentum — overBOUGHT — continues to suggest either an upward trajectory (BTFD in a rate CUTTING cycle) or, more than likely, some ‘time at a price’ needed to work off overBOUGHT conditions …
… for somewhat more and bit more static look at some key metrics to consider ahead of the weeks $183bb coupon supply … from someone with a Terminal and LOTS of time …
CHARTbeat: Fixed Income: Treasuries Weekly rotation of debt-based charts
… and the setup continued despite / because of some of what was the news yesterday and so …
ZH: US Manufacturing PMI Plunges To 15-Month Lows; Prices Are Soaring Again
… make of this whatever you will (or can) … Something for everyone? Oh forget it. I’ll move on and right TO a snapshot OF USTs as of 652a:
… and for some MORE of the news you might be able to use…
NEWSQUAWK: Sentiment lifted after China’s flurry of stimulus efforts … USTs are weighed on by the broader risk tone and down to a 114-13+ base. Support comes in at Monday’s 114-11+ trough before the figure. Fed's Bowman and US 2yr supply.
Finviz (for everything else I might have overlooked …)
Moving from some of the news to some of THE VIEWS you might be able to use… here’s SOME of what Global Wall St is sayin’ …
…. for those wanting a note on front end and QT (or if you prefer, a BTFD note and / or an update on China), well … here you go …
BNP Front-end center: Distribution of risks for the end of QT
KEY MESSAGES
Our baseline remains for the Fed to end quantitative tightening in March 2025 as officials continue to emphasize that balance sheet runoff can continue with rate cuts.
Risks are more skewed to an earlier end to QT rather than a later end should a hard landing or spike in repo volatility occur.
Debt ceiling reinstatement in January 2025 may also complicate the Fed’s transition to ample reserves, as a divided government might see a prolonged debt ceiling episode that drains TGA and artificially props up reserves.
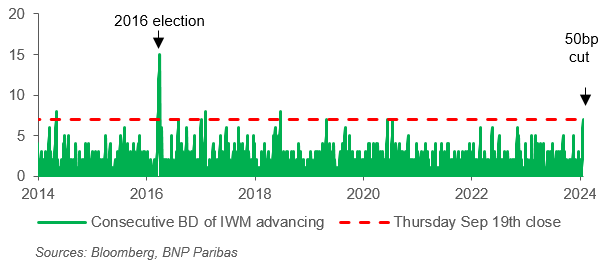
BNP US equities: BTD – in ETF sector and stock optionality
…Fig 2: IWM advanced for seven consecutive sessions around the Fed rate cut. These type of “non-random walks” pose risks to short unhedged optionality positions, e.g. underwriting or selling covered calls
Germany chiming in with a public service announcement and reminder, if you will … there are a few things (ie RISKS) ‘markets’ (folks IN the markets putting their money where their mouths are) still concerned ‘bout
DB: Mapping Markets: 4 risks that markets are still concerned about
Things are going very well in markets right now. The S&P 500 hit another record last Thursday, and in total return terms, Treasuries are on track for a 5th consecutive monthly gain for the first time since 2010. This time last week, we wrote about why we’re fundamentally optimistic.
But even as many headline assets are doing well, market pricing shows that investors haven’t fully shaken off their pessimism. For instance, ongoing geopolitical tensions mean that we just had the biggest weekly rise in Brent crude oil prices since April. Recession fears haven’t gone away either, hence futures are still pricing in faster rate cuts than the Fed indicated in their dot plot. Inflation risks are lingering, which helped push gold up to an all-time high on Friday. And traditional valuation metrics remain elevated as well.
So what are the risks concerning investors right now?
1. Inflation: After a lengthy period above target, investors are clearly alert to the risk of a rebound.
With the major central banks like the Fed and the ECB cutting rates, this has historically been a point when inflationary risks are high. After all, policy is becoming less restrictive, and we can see that money supply growth is picking up as well, so this isn’t just an abstract concern.
For markets, this lingering caution can be seen most notably in gold prices, which are a classic inflation hedge. On Friday, they closed at an all-time high in nominal terms of $2,622/oz. In the meantime, the US 2yr inflation swap is up +23bps over the last two weeks, putting it back in line with its levels just before the market turmoil in early August.
2. Recession: Investors still aren’t convinced that a soft landing is a done deal.
3. Geopolitics: Investors are conscious that an unexpected shock could lead to a big shift in asset prices.
4. Valuations: Given the market rally, traditional valuation metrics remain elevated right now.
What the Fed and markets SHOULD do vs what WILL actually happen doesn’t always have to match but yet, we continue to get views offered and so …
ING: The early cutting cycle – what the US 10yr should do
The Fed has started its rate-cutting process, so what does that mean for longer dated rates? So far the reaction is up for market rates. That's not unusual. It likely persists for a bit. But history also shows that the 10yr yield ultimately hits a level lower than seen at the first cut. A material sub-optimal payrolls number can spark that move. Till then it's up
…And here's why the 10yr yield should in the end take out its pre-rate-cut low Previous cycles show that a month to a quarter after the first cut there tends to be confirmation from the data that things are not great, and if anything is getting worse. That tends to expose the upside move in yields to the new reality that the Federal Reserve still has considerable work to do. It results in a leg lower in yields, and leads to the basic truism of most previous cycles – even if yields initially back up, they ultimately fall back down again, and typically to much lower levels to where they were at the moment the Fed initiated their cuts, as can be gleaned from the chart above. That’s the strongest argument against the notion that a material break above 4% is likely.
That said, we still need the excuse to break the back-up trend in yields. We’d suggest that the most likely excuse is to come from the employment report. Sure we’ll watch GDP and retail sales and production and the weekly claims among others. But in the end, we assert it’s all about payrolls.
The key level there is 150k – the replacement level. Once we go below that (and we have already) the unemployment rate tends to rise. In fact, four of the last five readings have been below 150k. The key issue here is how far below 150k is impactful enough for the 10yr yield to about turn. A negative print would be enough. But a reading in the zero to 50k area could also be enough, being statistical-error-wise close enough to zero.
Something like that can spark the next move lower in the 10yr yield. And then we are on a journey back down towards the 3.5% area, taking out the prior low in the 3.6% area. That would be enough to complete the narrative that the 10yr yield tends to get to a new low post the first cut, even if it pops higher for a bit initially. This remains our central thesis for the remaining months of 2024.
The idea is a soft landing … right. Got it (but will China ALSO got it?)…
China’s central bank cut interest rates and reserve requirements, eased home ownership regulation, and proposed support for equity markets. The measures were announced with considerable dramatic effect, presumably aiming to ensure China’s officially reported GDP data meets the official GDP target.
A challenge of having been a Japanese economist in the early 1990s is seeing parallels to Japan’s policy errors from that time. China’s moves will give more money to mortgage holders, and by supporting asset prices may create a positive wealth effect. However, the policy measures also seem to mimic what worked in the past rather than adapting to today’s very different economic circumstances. Economists are skeptical about whether these policies are best suited to changing an economy with a high precautionary savings rate and declining population.
The German ifo poll of business confidence is due, following yesterday’s assorted business sentiment polls. Needing to find content for a daily podcast, it is sometimes tempting to look into these surveys simply to have something to say. It is a temptation best resisted.
The US has the Conference Board consumer confidence poll. The improvement in the Michigan sentiment poll was entirely due to Democrats’ optimism. Democrats might be uniquely living in a better economy; more likely it represents political polling.
… And from Global Wall Street inbox TO the WWW,
Hedgopia (the source of POSITIONS data) offering a picture of 10yy hiding in an equity note …
Hedgopia: S&P Rallies To New High A Day After FOMC Decision; Last 3 Daily Candles Raise More Questions Than Answers
…. Last Tuesday, the 10-year ticked 3.6 percent intraday before reversing higher, ending the week up eight basis points to 3.73 percent. There is lateral resistance just under 3.8 percent. Once this gets taken out in the sessions/weeks ahead, trendline resistance from April last year rests at 4.3 percent, which also coincides with horizontal resistance (Chart 1).
Hussman SAYS we should all be asking better questions and an excerpt leaning on Herb Greenberg tweet and chart caught MY attention (largely because it was a a very important period of time, personally and just days before Fed started to RAISE RATES ) …
…Taken together, here’s where we stand. Our 2021 adaptations primarily shifted our response to favorable internals. In data since 1940, our present investment discipline, as adapted, suggests a constructive or aggressive investment outlook in about two-thirds of those periods, with the majority either unhedged or leveraged. Only about a quarter of periods since 1940 are classified as bearish. This breakdown may seem inconsistent with the misapplied “permabear” label on my paw, but then, my inclination to adopt a constructive or bullish outlook is far greater than investors may recognize. We do, however, require market conditions that justify that.
Herb Greenberg, who’s still writing, and has an interesting and useful column On The Street on Substack, shared this note a few weeks before the January 2022 peak:
Since mid-2021, because of persistently elevated valuations and unfavorable market internals, our discipline has encouraged a bearish outlook about 70% of the time, with a fairly neutral outlook otherwise. The new bit applies to these bearish market conditions. When prevailing market conditions encourage a bearish outlook, the “moderate” hedge I’ve described above has applied in about 25% of bearish periods since 1940, about 50% of bearish periods since 2021, and about 75% of bearish periods year-to-date (though not at the moment). The S&P 500 has actually lost value in the remaining periods year-to-date.
That’s the research update. My hope and expectation is that you’ll see the impact of this particular enhancement within weeks or months, rather than quarters or years. As usual, we’ll respond to observable conditions as they change. No forecasts are required…
…One of the striking aspects of the yield curve here is the extent to which investors have priced in a recession. As Ian Harnett of ASR London has observed, the 2-year Treasury yield has never been this far below the prevailing Fed funds rate (essentially anticipating aggressive rate cuts) except just before or during recessions. Given that the level of unemployment has modestly increased, and a broad range of leading measures are still hovering at the threshold of recession, an economic downturn shouldn’t be ruled out. It’s just that investors have already priced it in, along with rather aggressive rate cuts. Fixed income investors now require a recession for longer-term rates to make sense.
For our part, we continue to view longer-term interest rates as acceptable but somewhat inadequate. The chart below shows the 10-year Treasury bond yield relative to simple but useful benchmarks we’ve developed and monitor.
The chart below shows the cumulative total return of 10-year Treasury bonds, over-and-above Treasury bill yields, depending on whether or not prevailing yields were adequate based on the benchmarks above…
Officials are writing / thinking / asking good questions and so, we should likely be pausing to READ what they think they think …
Standard metrics point to an improvement in Treasury market liquidity in 2024 to levels last seen before the start of the current monetary policy tightening cycle. Volatility has also trended down, consistent with the improved liquidity. While at least one market functioning metric has worsened in recent months, that measure is an indirect gauge of market liquidity and suggests a level of current functioning that is far better than at the peak seen during the global financial crisis (GFC)…
…A Conflicting Measure? While the measures discussed so far point to liquidity that is improving and far better than it was in March 2020, this is not true for all measures. So-called yield curve “noise” measures, which gauge the dispersion of individual Treasury security yields around a smoothed yield curve, have recently risen, suggesting decreased liquidity. While dispersion does not measure liquidity directly, it is thought to reflect the amount of arbitrage capital in the market and hence serve as a proxy for liquidity (as explained in this paper). The chart below plots one such version of the measure, the Bloomberg U.S. Government Securities Liquidity Index, against our price impact measure since 2007.
Different Measures Evolve Differently
Sources: Author’s calculations, based on data from Bloomberg and BrokerTec. Notes: The chart plots five-day moving averages of the Bloomberg U.S. Government Securities Liquidity Index and average price impact for the on-the-run two-, five-, ten-, and thirty-year securities. Price impact is calculated for each security as described in the preceding chart’s note, with each security’s price impact then weighted by the inverse of its standard deviation in calculating the cross-security average. The sample period is August 7, 2007 to August 31, 2024.
While the Bloomberg measure has recently risen, it remains far below its peak during the GFC. Moreover, it remained far below its GFC peak in March 2020 even when direct liquidity measures approached GFC levels and the Fed unleashed massive asset purchases to address the dysfunction then roiling the market (described in this paper). It follows that the recent behavior of the Bloomberg index seems less notable when examined in a longer historical context. The reasons behind the disparate performances of the different measures are an interesting area for future research.
Continued Watchfulness While Treasury market liquidity continues to improve, continued watchfulness remains prudent. The market’s capacity to smoothly handle large trading flows has been of ongoing concern since March 2020 (as discussed in this paper), debt outstanding continues to grow, and recent empirical work shows how constraints on intermediation capacity can worsen illiquidity. Close monitoring of Treasury market liquidity, and continued efforts to improve the market’s resilience, remain appropriate.
Stocks for the longrun you want (refer to the French note above about BTD) then here you go …
WisdomTree: Prof. Siegel: Fed's Big Rate Cut Sparks Recalibration
…The word of the week was recalibration. As new data comes in, the Fed will likely keep recalibrating rates lower towards a neutral stance, even if there is a month when inflation data is a little hotter.
I still argue that the Fed should act faster in getting rates down to neutral and let us call neutral level 3.5% versus the 2.9% the Fed claims in their September Dot Plot. But this first cut, and expected future cuts, will get to neutral relatively quickly. Being more aggressive does not fit in with the current modus operandi of the Powell led Fed…
…For stocks, yes valuations across many sectors appear stretched by historical standards, particularly in the technology sector and AI-driven companies. This reflects a broader market anticipation of substantial growth driven by technological advancements…
… finally from the wolf of Wall on flash PMIs …
WolfST: Days after Rate Cut, S&P’s Flash PMI Sees Rising Inflation and Exhorts the Fed to “Move Cautiously” with “Further Rate Cuts”
“The “reacceleration of inflation” suggests “the Fed cannot totally shift its focus away from its inflation target.”
AND truer words never been spoken …
ah, gettin old … sucks BUT as Pops always reminds me, it’s better than ‘the alternative’ and so … THAT is all for now. Off to the day job…


")
")
 in basis points against estimated price impact in 32nds of a point per $100 million (red), from 2007 through 2024”")
