while WE slept: USTs bid / steeper on LIGHT volumes; "...reducing inflation can be the hardest..."; are cuts needed?
Good morning … I realize that today, its safe to say many / most are watching NVDA as Bloomberg notes …
… Nvidia investors may have almost $200 billion in market value riding on this week’s earnings report, according to options positioning. Prices for short-term calls and puts imply a 10.6% move in the chipmaker’s shares on Thursday, the session after its earnings report, according to data compiled by Bloomberg. That would sway Nvidia’s market capitalization by some $180 billion, one of the largest single-session moves on record…
… but bond geeks are likely going to be watching this afternoons liquidity event (aka 20yr auction) and so …
20yy DAILY: watching momentum (on verge of bullish cross) and 4.66% supp
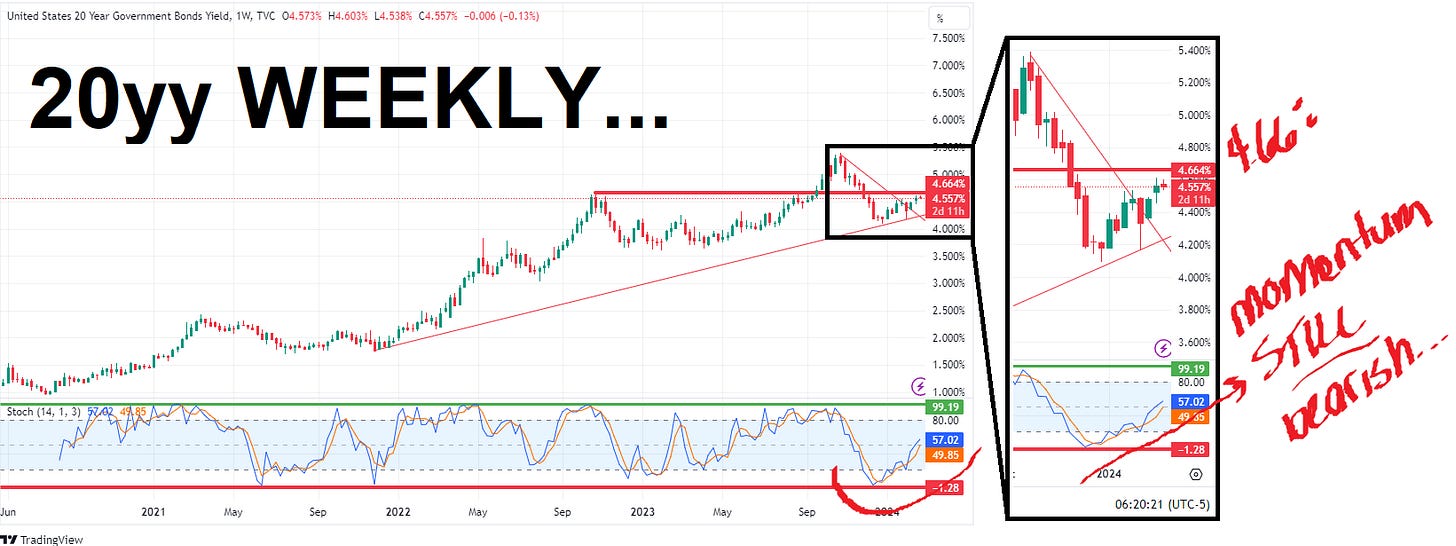
20yy WEEKLY: longer-term remains more bearish
… YOUR timeframe and view is, as always, far more important than any of my (or others) markings on a chart … Make as much / little of the above as you wish but there is one thing for certain — something for most EVERYONE.
And now back to pre NVDA vigil (where high flyin’ tech stocks may very well be considered longest of long duration assets out there and in my current capacity, I do NOT have access to compare / contrast NVDA to 20s or 30s via BBG … wait long enough and i’m sure someone out there will provide … For now, though, here is a snapshot OF USTs as of 710a:
… HERE is what this shop says be behind the price action overnight…
… WHILE YOU SLEPT
Treasuries are modestly higher and the curve is a touch steeper ahead of today's 20-year Treasury auction and this afternoon's hotly anticipated chipmaker's earnings. DXY is little changed (+0.06%) while front WTI futures are lower (-0.75%). Asian stocks saw Chinese share markets higher but other exchanges mostly lower, EU and UK share markets are mixed while ES futures are showing -0.23% here at 6:40. Our overnight US rates flows saw a downtick in prices during Asian hours that was met by dip-buying and a 4k TY block buy during London's hours. Overnight Treasury volume was weak at ~65% of average across the curve.…Is the crowd that loves to hate bonds too unwieldy now? Let's have a look... Our first attachment checks in with the daily chart of Treasury 2-year yields. The more recent price action is similar in pattern and level to that seeing in the first week of December. But also note that after daily momentum (lower panel) has gone from extremely 'overbought' at the start of this year, it is now deeply 'oversold' and potentially on the cusp of a bull turn. Simply, the heavy selling pressure in recent weeks is either abating or being matched by opposing buyers. We could get a confirmed bull momentum turn at today's close, from the looks of it.
NOTED … timeframe important … and for some MORE of the news you might be able to use…
IGMs Press Picks (February 21 2024)
NEWSQUAWK: US Market Open: US futures are lower ahead of NVDA earnings, NZD bid & Crude softer; FOMC Minutes due … Bonds are mixed but edging higher in recent trade post-supply; attention on US 20yr supply later today
Reuters Morning Bid: Nvidia chipped while Fed minutes pass
Finviz (for everything else I might have overlooked …)
Moving from some of the news to some of THE VIEWS you might be able to use… here’s SOME of what Global Wall St is sayin’ … and my how things have and are changing … from S&P targets (noted yesterday) TO pricing of <NO>landings …
BARCAP US Outlook: Sorry to ruin your plans, part deux
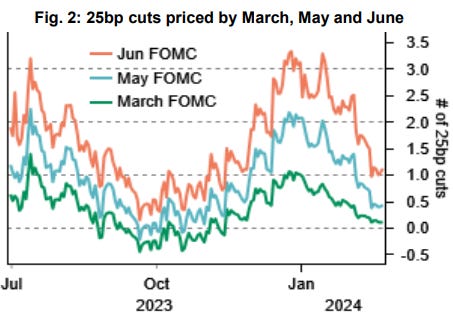
January data are sending mixed signals, with much firmer core price inflation coupled with weakening activity. With adverse weather the likely culprit for activity weakness, we expect the FOMC to focus on inflation, which will undermine confidence that inflation is in check. We downgraded our cut expectations accordingly.
UPDATE This publication is an update to 'US Outlook: Sorry to ruin your plans, part deux', originally published on 16 Feb 2024 at 21:36 GMT to correct the 2024 forecasts for core and headline PCE inflation, nominal GDP, the current account, the federal budget and government debt in the snapshot.
BNP US rates: Headwinds to a fall in upper-left vol
Erosion of confidence in falling inflation could support upper-left corner (ULC) vols as front-end yields rise.
Market pricing suggests an option-implied probability of about 20% that the Fed does not cut rates by year-end, similar to levels seen before the December 2023 FOMC meeting.
ATMF payer swaptions or payer spreads in the ULC remain a limited downside, positive carry hedge against the risk that rate cut pricing is further reduced.
DB Mapping Markets: Why the last phase of reducing inflation can be the hardest
Over the last week, upside inflation surprises have led to growing questions about how difficult it will be to get inflation back to target and keep it there sustainably.
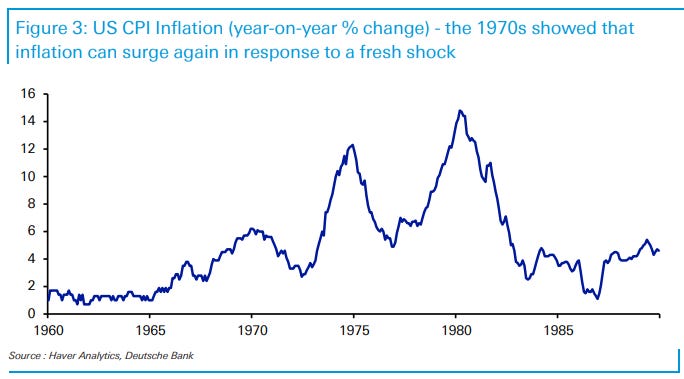
For instance, the US CPI and PPI prints for January both surprised on the upside, and yesterday there was a similar upside surprise in Sweden. And even though inflation has come down significantly from its peak, it remains above target levels in the US, the Euro Area and Japan.
That’s led to plenty of warnings from history, as the last stage of returning inflation to target is often the most difficult. If that’s true, that suggests we could be in for a difficult period ahead, with inflation proving sticky above the target.
In light of this, we look at why the last phase of returning inflation back to target has often proved to be the most difficult.
… But why is this last phase often the most difficult?
1. The closer inflation gets back to target, the more pressure there is to ease policy, which raises the risk of moving too early and inflation rising again.2. When inflation is caused by a temporary shock, the immediate effects normally fall away with time. But the second-round effects of the shock can prove more persistent, so the initial decline in inflation is often the easiest…
…3. The longer inflation is above target, the more likely it is that inflation expectations move higher as well. But that can work against attempts to bring inflation down, since higher expectations risk becoming a self-fulfilling prophecy.
DB: Market pricing of no-landing this year
With strong activity data and firmer inflation readings, pricing for the Fed policy rate path has shifted up significantly over recent weeks. Our colleagues in US economics recently explored what economic conditions could lead the Fed to hold rates unchanged this year using standard policy rules.
Today’s chart looks to provide perspective on the following related question: what probability is the market placing on a “no-landing” scenario that entails no cuts or even further Fed hikes this year?
To back into this, we treat Dec FOMC OIS as pricing through three paths: (1) soft-landing, (2) recession, and (3) no-landing/further hikes. We fix the soft-landing and recession paths based on our econ team’s recently revised and prior forecasts of 100bp and 175bp of cuts this year, respectively. Then, under different assumptions about the likelihood of recession, we can recover the implied probability of no-landing under various assumptions about the number of hikes in that scenario.
The chart shows the range of resulting probabilities associated with no-landing hikes this year of 0-75bp, given current Dec OIS pricing of ~4.40%. A recession probability of roughly 20-25% seems reasonable – that’s a bit above the historical unconditional probability and well below the last reading on perceived recession probabilities from the NY Fed’s surveys (which at this point are very dated). As shown by the red box, this gives a range of no-landing probabilities currently priced into the market of around 10-25%.
Goldilocks: Macro Conditions and Equity Returns in Cutting Cycles
… The upcoming easing cycle is likely to take place against a backdrop where GDP growth has been solid, the unemployment rate is low, there are no obvious imbalances in the economy, and inflation is near target levels. On the market side, equity valuations are high, the Dollar is also somewhat overvalued, and markets are priced for meaningful forward easing. Of the three previous normalization-driven cutting cycles, 1989 and 1995 look more similar than 1984 to the present day along these dimensions, and both saw quite positive equity returns in the year following the first cut.
Our macro return models that consider valuations and macro dynamics together still suggest that equity returns should be modestly positive on a one-year basis from here, consistent with our Portfolio Strategy team’s new 5200 year-end target for the S&P 500. The clearest positive environment for risk assets on our forecasts is in the next 3-6 months, where the decline in core inflation and in bond yields is most pronounced in our forecasts. After the summer, risks around the US election, the possibility that the Fed cuts less than the market expects if the economy responds well to initial easing, and even richer valuations may make for a more complicated risk asset outlook.
Both these simple macro models and historical comparisons bring us back to the same core tension that we have highlighted in recent months between high valuations and the friendly cyclical forces in our forecasts. Our core macro view still leaves us with a pro-risk bias, but we expect periodic pullbacks along the path higher given the benign outcomes the market has already priced. History also suggests that materially worse market outcomes may only be likely in the face of large new shocks. Investors looking for protection against those tails or to add hedges that make it easier to stay long may be able to take advantage of low levels of equity implied volatility for those purposes.
Goldilocks Commodity Insights: The Boost to Commodity Prices From Fed Cuts
Commodities have recently closely followed the swings in market pricing of Fed cuts. We estimate the impact on commodity prices of lower US interest rates driven by an easier Fed stance (rather than by lower GDP growth). Combining a structural model and market reactions around FOMC meetings, we make four findings.
Demand boost dominates
Metals move most
Gradual boost. The lift from policy easing to oil and industrial metals prices takes time to fully materialize, consistent with our long-held view that oil is mostly a spot asset. We estimate that the boost to oil prices from a 100bp policy-induced drop in US 2-year yields triples from 3% on the Fed meeting day to 9% after 1-2 years.
Growth backdrop of cuts matters…The case for commodities in 2024. These four findings support our selectively constructive commodities call. In our central “soft landing” scenario—the Fed cuts as core inflation slows but growth is solid—industrial metals, and especially copper should offer attractive returns. We also see value in oil and oil products in a no landing scenario (where financial demand for oil as an inflation hedge rises), and in oil and gold as hedges against geopolitical shocks (e.g., energy supply disruptions in Middle East or Russia) in a potential hard landing scenario.
MS From the Global Director of Research: Charts That Caught My Eye
… 3. US Equity Strategy: The bond market has unwound some rate cuts it had been pricing in...equities have not.
Our US Equity Strategy team hypothesizes that an unusual mix of loose fiscal policy and tight monetary policy with accommodative liquidity might help explain the narrowness of equity market performance. While breadth has been narrow, they acknowledge that the top 5 US stocks continue to drive the S&P 500 for the “right” reason — the top 5’s share of the index’s aggregate net income is near a historical high. Our team argues that for many businesses and consumers, rates remain too high, and the recent CPI and PPI reports and the Fed’s firm guidance may raise the question of whether the Fed can deliver rate cuts soon. They note that the bond market has started to unwind some of the Fed rate cuts it had been pricing in since late 2023. Yet equity valuations have not come down in response to the recent inflation data, creating a divergence from bonds that our US Equity Strategists believe could be reconciled via either lower rates or lower multiples. Our team continues to recommend investors focus on high-quality growth and operational efficiency factors.
Wells Fargo: Time to Give LEI the 23 Skidoo?
Summary
The Leading Economic Index (LEI) fell in January. Again. This makes 23 months that this composite of leading indicators warned of a downturn that has not come. We unpack the factors weighing on this month's dip while noting the trend improvement in the Coincident Index.Wells Fargo: The 2024 U.S. Elections Part II: Monetary Policy Implications
Summary
The FOMC continues to face a difficult economic environment. Inflation has yet to recede all the way back to the Committee's 2% target, while resilient economic growth has stoked concerns it may prove more challenging to fully rein in price growth. Yet, with monetary policy restrictive and the lagged impact on the economy a major source of uncertainty, the risk of recession remains unusually high in our view.
Amid these economic crosswinds looms the U.S. presidential election. Chair Powell has steadfastly declared that politics will not play a role in the FOMC's policy decisions.
We agree with Chair Powell's message that the election will not be a major factor in monetary policy setting this year. When looking at the history of Fed policy changes in presidential election and non-election years over the past 30 years, economic conditions overwhelmingly dominate policy decisions across the following dimensions:
Number of Policy Moves: The Fed has adjusted its policy rate nearly the same number of times in presidential election years as non-election years (an average of 2.7 and 2.9 times, respectively).
Direction of Policy Moves: The FOMC has cut the fed funds rate by 46 bps on average in presidential election years while raising it by 25 bps on average in non-election years. However, these differences effectively disappear when excluding years in which the economy was in a recession (2001, 2008, 2020).
Timing of Policy Moves: Looking across presidential election years shows the Fed has tended to maintain its charted course through the election, whether that be tightening (2004), cutting (2008) or remaining on hold (1996, 2012, 2020).
Even if monetary policymakers wanted to help one party over the other, which we do not believe is the case, it is not entirely clear which way they should lean. The delicate balancing act between reducing inflation—a prominent issue for voters this year—without causing untoward damage to the jobs market—a perennial issue for voters—remains. In the words of Chair Powell in his recent 60 Minutes interview: “it's not easy to get the economics of this right in the first place.”
This is not to say presidential elections have no implications for the monetary policy outlook. Changes in the composition of Congress and the White House, such as the Republican sweep in 2016, can lead to inflection points for federal fiscal policy, and, by extension, the outlook for the U.S. economy and monetary policy.
Furthermore, the president and Senate play a key role in determining the makeup of the Board of Governors. Jerome Powell's term as FOMC Chair ends in May 2026, while the four-year terms of Board of Governors Vice Chair Philip Jefferson and Vice Chair of Supervision Michael Barr will also expire during the next administration (in September 2027 and July 2026, respectively).
Our forecast for the federal funds rate in 2024 will be dictated primarily by our expectations for U.S. economic growth, employment and inflation and our view of the Fed's reaction to these developments. We do not think the election will play a major role in driving monetary policy decisions at the five FOMC meetings between now and Election Day. The Federal Reserve takes its independence very seriously, and the past 30 years of history suggests that macroeconomic conditions are the dominant force guiding monetary policy.
… And from Global Wall Street inbox TO the WWW,
AllStarCharts: Equally-weighted Indexes Back to 2021 Highs
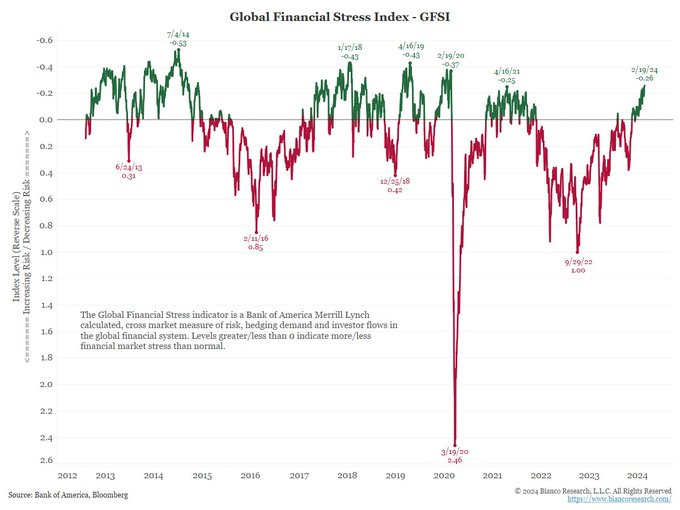
Below is the BofA Global Financial Stress Indicator. A description is on the chart.
It just exceeded its April 2021 extreme, showing the LEAST amount of financial stress since the Pandemic (February 2020).
If, as noted in the repost below, the Fed "has all but achieved its dual mandate of a full-employment economy and low and stable inflation" then the Fed did this with a 5.50% funds rate!
In other words, 5.50% is NOT a stressful rate. The Global Financial Stress Indicator above says markets are enjoying the least amount of stress at any time in the last four years.
--- Restated bluntly, a 5.5% funds rate is not restraining anything. So, cuts are not necessary.
Bloomberg 5 Things You Need to Know to Start Your Day: Asia (no place like home)
… Maybe supply does matter when it comes to the bond market, but only if the timing is also working to enhance the impact. Treasuries have struggled this year, but that’s been all about the evaporation of bets on swift interest-rate cuts from the Federal Reserve. The concerns about oversupply that emerged during the September-October meltdown that hit bonds have so far been absent this year even as the outlook for persistently large US deficits becomes clearer.
Looking at the dynamics within the Treasuries market does underscore that supply could well have been a key issue during the selloff, because of the way that absorbing a surge in issuance fell overwhelmingly on some of the more price-sensitive buyers. The Treasuries market expanded 3.5% in the third quarter, the biggest such jump since the three months through June 2020. At the same time, the Fed was reducing its holdings, while foreign buyers were reluctant to add to theirs.
That meant essentially US domestic investors were left to plug the gap, and they notably demanded higher yields in order to do so. Once those yields had surged to the highest since before the 2008 global financial crisis, international demand revived. With the pace of issuance slowing, that meant the other holders ended up reducing their stake in the market, coinciding with the steep rally that rounded out 2023.
Those dynamics haven’t altogether disappeared — the Fed is still winnowing down its holdings — so the potential remains for a supply-demand imbalance to set off further bond pain.
FRB Dallas: Inflation forecasts based on money growth proved accurate in 2021, though generally unreliable
Most forecasters and policymakers were surprised by the degree and persistence of high inflation in 2021 and 2022. These large misses in predicting inflation were preceded by an unprecedented level of money growth, bringing renewed attention to quantity-theoretic linkages between inflation and money growth (Chart 1).
… Over the full sample, from 2002 to 2023, money-based forecast performance is similar to or worse than the benchmarks.
The case is not at all clear that money growth measures are useful for forecasting inflation. That being said, these results should not be overextended. We have tested one specification for forecasting inflation with money growth. Other specifications may be more accurate over long samples.
These results also do not imply that money growth does not matter for inflation; as we noted, the quantity equation must hold. However, as money demand changes, and in particular as money velocity fluctuates with interest rates, this relationship can become unstable with money growth providing limited useful information for inflation forecasting.
FirstTRUST: Monday Morning Outlook - January Stagflation
A key economic mistake people make is thinking growth leads inflation. One reason they do that is because inflation is a monetary phenomenon. When money is too easy, first growth rises, and then inflation rises with a longer lag due to excess dollars in the system. This process reverses when money is tight, first growth slows, then with a longer lag inflation does too.
That makes 2023 an anomaly. The economy has remained resilient, but year-over-year consumer price inflation has moderated from a peak of 9.1% in mid-2022 to 3.4% in December 2023…
…we believe monetary policy played the key role. The M2 measure of the money supply soared 41% in 2020-21, the fastest since World War II. This measure of the money supply then declined 3.2% in 2022-23, the largest two-year drop since the Great Depression. These swings in M2, the relative sizes of the swings (larger up than down), and the long lags between shifts in M2 and inflation do a much better job explaining the inflation pattern of the past few years…
…Time will tell if the weakness in January becomes more widespread. On the surface, the job market still looks fine, with payrolls up more than 300,000 in both December and January. But the labor market can be a lagging indicator.
Unprecedented policies during COVID have created noise in the data. But underneath it all, we still believe Milton Friedman had it right. A decline in money will lead to recession, and then a decline in inflation.
LPL: Tactical Asset Allocation — Long Live the 60/40
… Fixed Income
Treasury yields were higher in January as interest rate cuts got priced out to the May Federal Reserve (Fed) meeting, at the earliest, due to the still resilient economy. The market got ahead of itself late last year in pricing in aggressive rate cuts, so a back-up in yields has been warranted, in our opinion. Still, starting yields for many fixed income markets are at levels last seen over a decade ago, so the return prospects for fixed income remain favorable, in our view. The TAA has been overweight bonds by 3% versus its benchmark since June of last year, funding this with an underweight to cash.
Within bond sectors, the STAAC favors mortgage-backed securities (MBS) and preferred securities over corporate bonds. MBS spreads (the difference in rates between the asset and a Treasury security of the same maturity) are at multi-year highs, while corporate credit spreads, particularly in lower-rated debt, are very tight. Preferred securities saw a sharp decline following last March’s sell-off in the banking sector. This provided an attractive entry point to buy, as the TAA launched a position in Q1 2023.
The chart below reflects the tactical asset allocation and benchmark weights in the GwI 60/40.
LPL Research Growth with Income (60/40) Tactical Asset Allocation
Summary
We believe the demise of the 60/40 was greatly exaggerated, and it is still an important portfolio construction tool into 2024 and beyond. This investment environment, as with most, is fast-moving and comes with its challenges, however, those challenges bring opportunity, and the 60/40 (GwI IO) Tactical Asset Allocation lends itself to capturing those opportunities in both the equity and fixed income markets.
The Observatory: Short-Form Views On Treasuries
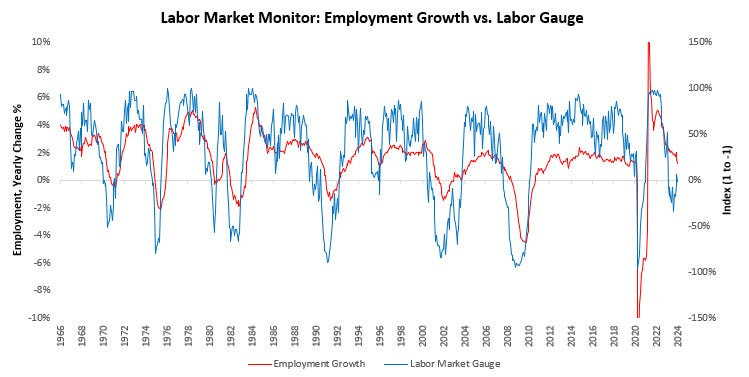
Labor market conditions remain largely positive, though cyclical drivers of slowing conditions continue to manifest. These dynamics create conditions that favor a decelerating expansion rather than further acceleration.
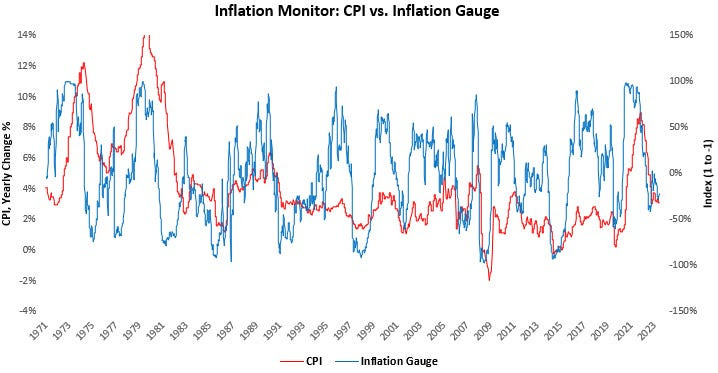
At the same time, inflationary pressures remain neutral, suggesting a continuation of the current trend.
…For now, neither labor markets nor inflationary conditions do not justify the cuts priced into short rates. This dynamic remains a headwind for fixed income.
AND … THAT is all for now. Off to the day job…









Long Live 60/40?! Now that's contrarian! Haven't seen that tentpole in awhile, I just Hope our CA senate candidates seeking $50 an hr min wage (Just do the MATH says the wise sista) remains contrarian too. $20 fast food worker min wage in April is already causing layoffs here....