while WE slept: USTs bid on strong vol; "Narrative fallacy" (HSBC) and stocks always better than bonds BUT ... valuations?
Good morning … First up a look at today’s item up for auction expanding on WEEKLY visual HERE …
10yy DAILY: at / near 4.50% and …
… it would appear that bearish momentum stalling about half way TO what might have been a more ideal level to BTFD (green TLINE) … any surprise this stalling happening in / around psychologically important 4.50%? I suppose not and I am not 100% sure how to interpret or what that means. A sign of bond market STRENGTH? Willingness to recognize concession and be buying ahead of supply?
Whatever the case, this comes on heels of a couple things shape-shifting the narrative yesterday (in addition TO the moving of the goalposts … )
ZH: Short-Term Inflation Expectations Decline As Stock Market Optimism Hits 3 Year High: NY Fed Consumer Survey
… which came before what turned out to be a less-than-optimal 3yr auction …
ZH: Treasury Yields Jump To One-Week High After Ugly 3Y Auction
… here is a snapshot OF USTs as of 705a:
… HERE is what this shop says be behind the price action overnight…
… WHILE YOU SLEPT
Treasuries are outperforming amid further risk-off px-action emanating from the spread-widening seen in EGBs (France-German 10y +9bps, Italy-German 10y +9.5bps, EURUSD -0.3%). Our desk is seeing demand in belly from real$, somewhat offset by fast$ sales in the long-end, as the 5s30s curve steepens +2bps. DAX futures are -0.6%, FTSE MIB -1.1%, and EU banks -2%. Commodities are mixed with crude slightly lower, while copper futures are 2% lower, and US Nat Gas has rallied above $3 with a >5% move this morning. S&P futures are lower, showing -20pts here at 7:15am. UST volumes are running ~135% the 30d average.
… and for some MORE of the news you might be able to use…
IGMs Press Picks: June 11 2024
NEWSQUAWK: US Market Open: Equities pressured, Gilts bid post-UK jobs & USD gains; ECB speak due … Bonds are in the green, attempting to recoup post-NFP losses, OATs remain pressured and Gilts outperform taking a bid after a record Gilt sale … USTs are firmer but ultimately unable to recoup much of the lost ground seen in the wake of Friday's NFP release; price action has been tentative as focus lies on the US CPI and FOMC on Wednesday. The Sep'24 UST contract continues to hold above the 109 mark and did catch a recent bid in tandem with news that French President Macron is said to be mulling potential resignations in the case of a possible right-wing victory in early parliamentary elections, according to News AZ - although this was later denied. A record Gilt sale also played a factor.
Reuters Morning Bid: Apple's AI push and the trouble with Europe
Finviz (for everything else I might have overlooked …)
Moving from some of the news to some of THE VIEWS you might be able to use… here’s SOME of what Global Wall St is sayin’ …
BARCAP: Long & Short of It: Back to the Grind (Higher)
Long-only equity positioning has room to run should the equity rally broaden; retail flows into equities returned in May; Tech overweight reaches record levels; systematic equity exposure seems elevated with asymmetry once again tilted to the downside; post-COVID lows in volatility are in sight with summer lull pending.
… Long bond futures positioning back to all-time highs
After unwinding some of their long 10Y Treasury futures positions in Q1, asset managers about-faced, pushing exposure to all-time highs in response to renewed uncertainty regarding the US macro outlook. Similarly, the outsized positioning in short speculative bond futures by macro hedge funds (reflecting a highly levered basis trade motivated by the vastly increased supply of Treasuries stemming from Fed QT and deficit financing) unwound through the end of March before leveling out last month.Figure 5. Asset managers increased their long Treasury futures position after some unwinding in Q1
DB Mapping Markets: Why higher rates aren't necessarily bad news for equities
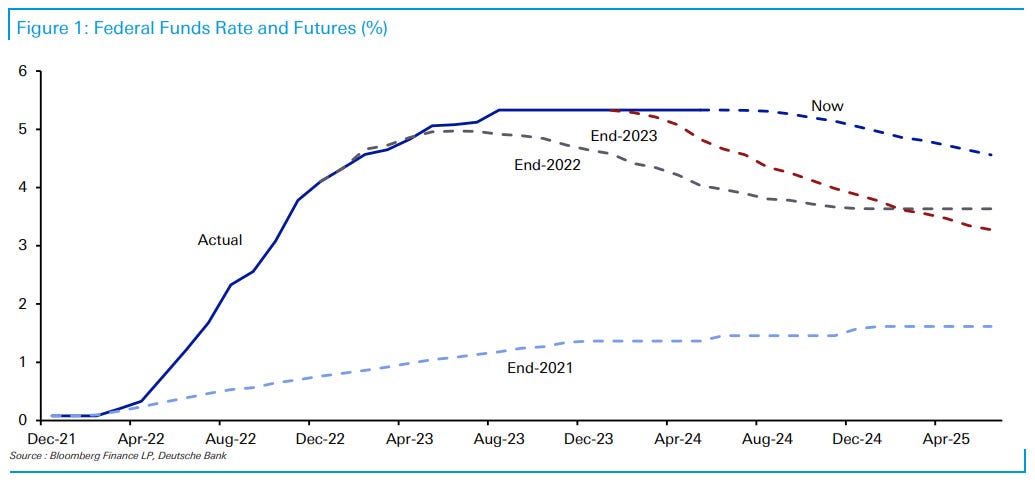
Throughout this cycle, a consistent theme has been that investors have underestimated rates staying “higher for longer”. There’s even been speculation that the Fed could hike again if inflation remained sticky, although Chair Powell said last month that “I think it’s unlikely that the next policy rate move will be a hike.”
But if the central banks did start hiking again, what would this mean for equities? Although there’s been plenty of concern, the experience of recent history suggests it wouldn’t necessarily be bad news.
In essence, it will depend on why rates are staying high. If it’s a stagflationary shock like 2022, then that combination has generally proved very bad for markets, as we found out that year. But if rates are staying high because growth is resilient and there isn’t the same need to cut, as happened in 2023, then equities have shown they can still rally in that sort of environment.
Case Study #1: In 2023, the Fed proved to be more hawkish than expected, yet the S&P 500 posted a strong recovery …
Case Study #2: In 2022, the Fed embarked on aggressive rate hikes, and equities underwent a sharp sell-off that saw the S&P 500 fall by -19.4% that year …
HSBCs The Major bond letter: #50. Narrative fallacy
Ever looked at the news and come away confused? Noticed how sometimes the headlines seem contradictory? You would certainly not be alone.
The title of this bond letter comes from Nassim Nicholas Taleb’s The Black Swan (2007)1 . Narrative fallacy is a cognitive bias in humans where, when trying to simplify a complex situation, we attach meaning or cause to something in error. It’s when we use a flawed story from the past to inform our view of the future. Taleb critiqued this bias with coverage over a key event in the Iraq war (2003); we come across it all of the time in the bond market, especially around data releases, key decisions, and bond auctions.
A hypothetical example in recent weeks would be “yields rise on US inflation upside surprise” followed shortly after by “rate cut probabilities increase as inflation miss not as bad as it could have been”. We have totally made this up but could point to countless examples in the news flow, which we are all consuming every day. The point is that yields could have moved for any number of reasons other than inflation.
We are not criticizing journalists, who are anyway fully aware2 , and unlike when Taleb made his observation, today some of the commentary may well have been written with the help of Artificial Intelligence (AI). When a machine produces text in response to a market move, it draws on a data release or event in justification. Errors will come if humans don’t spot them.
Investors are in any case better served by keeping a distance from the echo chamber of commentary solely based on the latest data release. There can be too much fuss over a 0.1% miss versus expectation on the latest inflation print. Much ado about nothing.
Our chart shows all key measures of inflation have been moving in the right direction. The reversal of the inflation surge has been symmetrical. True, not quite back to target, but focusing on the last few yards after running a mile means we might be missing the runner coming up fast on the outside.
Central banks do not base policy decisions on a single data release. Triggers and catalysts for a change in market direction anyway often come from exogenous events: a dramatic slowdown overseas, something geopolitical, a restructuring event, or something that exposes an imbalance in the system born out of previously excessive accommodation…
…When the narrative changes so will the direction of the market. But even with falling yields there will still be plenty of noise around each data release, as one comment contradicts another, even though it is based on the same information.
Yardeni: Bonds, Oil, Copper, Gold & The Dollar
On a regular basis, we like to check on the correlations between the fixed income, commodity, and foreign currency markets. Here are a few of our observations:
(1) Bonds. The 10-year US Treasury bond yield has normalized, fluctuating in a range roughly between 4.00% and 5.00% (chart). That's where it traded for a few years prior to the Great Financial Crisis. The same can be said about the 10-year TIPS yield. It has been fluctuating around 2.00% since late last year. It did the same for a few years prior to the GFC.
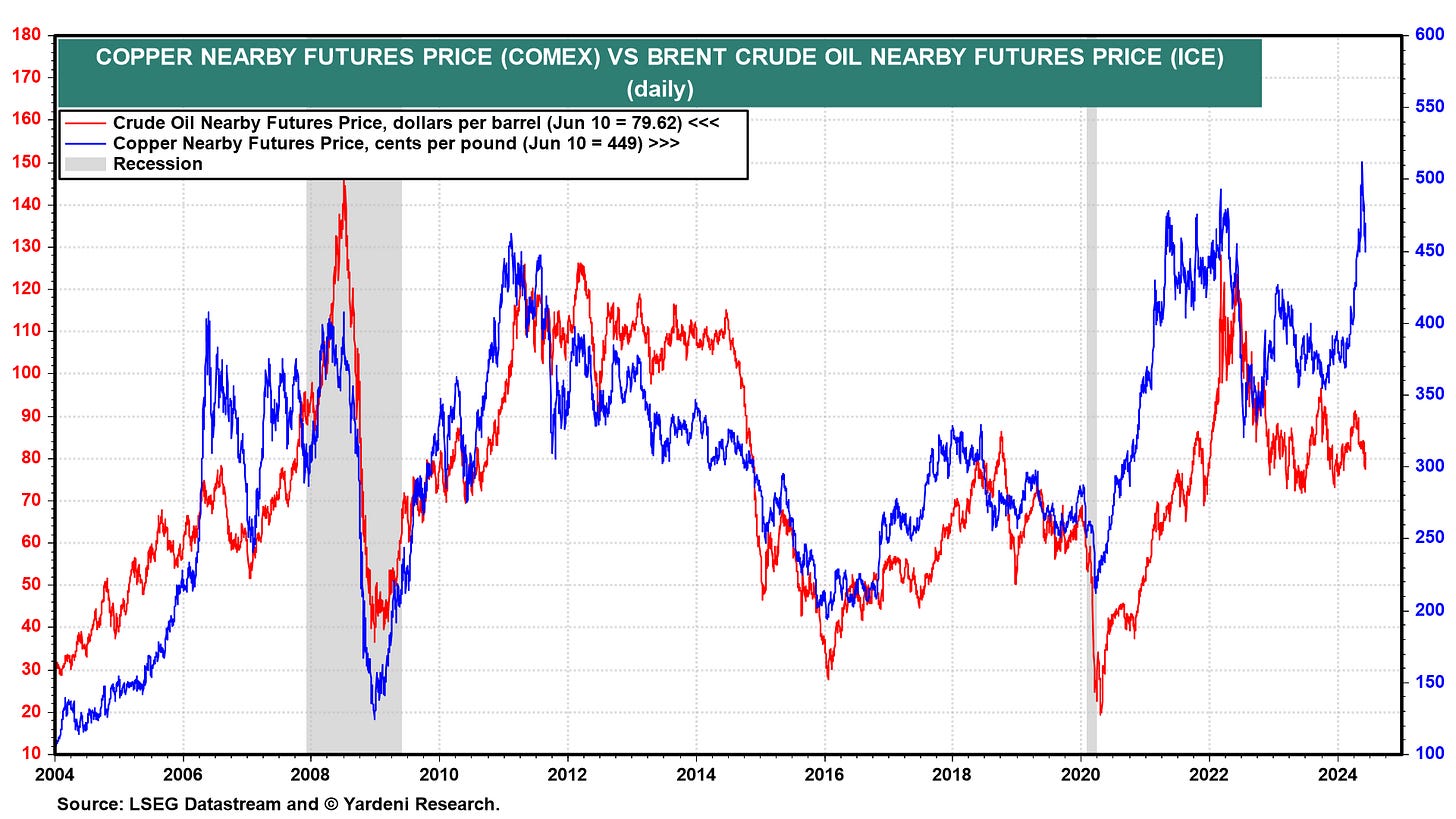
(2) Crude oil. The yield spread between the 10-year nominal and TIPS bonds is widely considered to be a proxy for the bond market's 10-year outlook for expected inflation. In fact, it is very highly correlated with the price of a barrel of Brent crude oil, which can have a significant impact on the inflation rate (chart).
If global economic activity remains lackluster, then the price of oil should remain subdued, and so should the expected inflation proxy. That would support our forecast that the nominal bond yield may remain in its current range for a while.
(3) Copper. The price of a barrel of Brent and a pound of copper have also been highly correlated (chart). The latter has a tendency to lead the former. Both prices reflect the strength or weakness of global economic activity. The recent surge in the price of copper didn't make much sense to us since it wasn't confirmed by the price of oil, which has been weak lately, consistent with our view that global economic activity is sluggish.
The recent jump in the price of copper was widely interpreted as a sign that the awesome demand for electricity by AI data centers would cause the demand for copper to soar. A simpler explanation is that there might have been a temporary short squeeze on the red metal.
… And from Global Wall Street inbox TO the WWW,
Bloomberg: For the descent, follow the dots (Authers’ OpED)
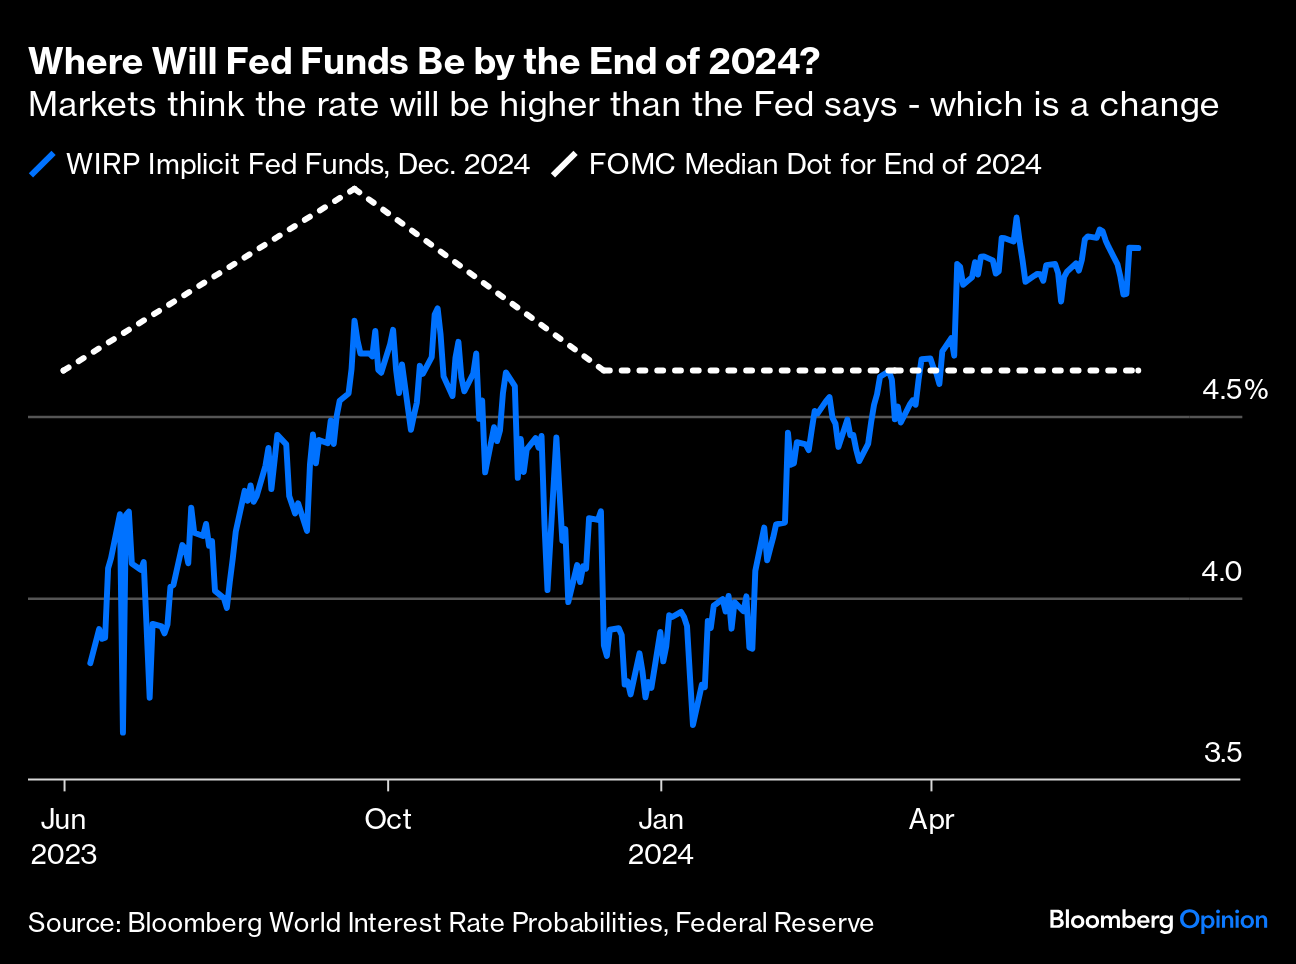
… The next move is about to come from the Fed. With employment data taking any chance of a summer rate cut off the table, the focus will be almost exclusively on the dot plot, issued quarterly, in which each FOMC member gives their prediction for the future course of fed funds, and for various economic measures. Last time, the median participant envisaged three cuts by the end of this year — although only one member would have needed to change their mind to move the median to imply only two cuts. It would be a major surprise if that doesn’t happen this week, with the fed funds futures market now implicitly predicting slightly less than two cuts by year-end. The key question now, with the Fed median currently 34 basis points below the market’s prediction, is whether the median member shifts to predict two cuts, or moves all the way to expecting only one:
Paulsen’s Perspectives: The Federal Reserve needs to take a BREADTH
The good news is when the Fed eventually does take a breath, stops obsessing about inflation and eases interest rates, this Bull should enjoy a further “delayed” run driven by expanding breadth!
… Higher bond yields have also impacted stock market breadth beyond just the S&P 500 Index. Chart 3 overlays the relative performance of the Russell 2000 index (small cap stocks) with the 10-year bond yield. Small caps have been chronically disappointing since about 2014 once bond yields began trending sideways or higher. Since at least 1990, the fate of small caps has been importantly impacted by the direction of the 10-year bond yield. And similar to the EW S&P 500 index, the relative price performance of the Russell 2000 index has been decimated since early-2021 as the 10-year bond yield surged higher.
Monetary tightening and higher bond yields have also restricted the participation of other key stock market sectors…
Topdown Charts: ChartStorm Perspectives Pack
… 6. Asset Allocation: Stocks vs Bonds
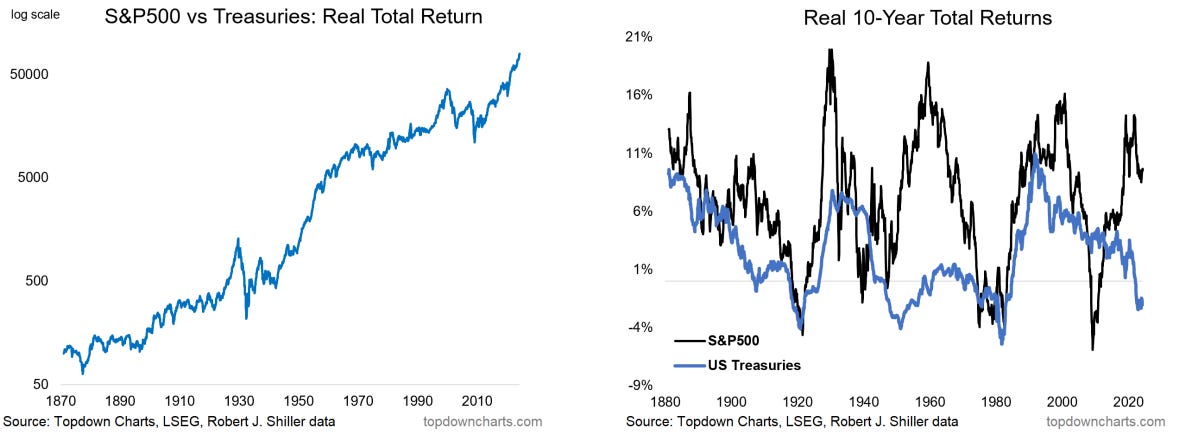
Over the Long-Term Stocks Beat Bonds: Including dividends and interest, stocks beat bonds over the long run, but the path has been treacherous – at times almost a vertical line, at others nearly horizontal, and sometimes taking a decade+ between new highs. So the answer simply can not be to own stocks, only stocks, and never bonds: there is scope for return boosting and path smoothing.… Bond Market Valuations: In the valuations section we saw how extremes in Stockmarket valuation indicators can help flag peaks and troughs in the Stockmarket, which can help investors recognize periods of increased downside vs upside risk. The same is true in the bond market, and as you might expect, the bond market is often cheap when the Stockmarket is expensive, and vice versa (albeit there are exceptions e.g. 2021 when both were expensive ( –just before both fell in 2022!)).
… meanwhile back at the FOMC ranch where the 2d meeting kicks off today, I’m wondering IF ‘The Beaver of Inflation’ will be in attendance …
… and IF JPOW & Co will be able to ignore it.
I’ll show myself out.
… THAT is all for now. Off to the day job…


The Yardeni section was especially interesting to me :)