Good morning … I’ve been harping on potential for market receiving ‘clues from 2s’ (Fri and 2024’s channel break noted over weekend) so it’s time to move on and think ahead … especially with duration supply (ie, Yellen puttin’ the FUN in reFUNding this week) and so, first up a look at a potential hiding place … the Belly which is NOT for sale this week …
5yy DAILY: 2024 UPtrend ‘bout to bend …?
… interesting to note it was more than just a single NFP print day where bonds had a bid … 2s up against 5.00% — line in the sand — one source of demand … perhaps supply upcoming this week will be another?
… #Got5s? asking as it is about the only thing NOT up for auction in the days just ahead. Janet Yellen intends to put the FUN in reFUNding in the days just ahead and that saying come to mind…
Supply creates it’s own demand (hope — not a strategy but…)
Given it looks to be a very slow news week ahead, at least in as far as rates markets goes AND in context of all the victory lapping and recapping (data as well as Buffet meeting, commentary this weekend), I’m going to hopefully be one of the first to wish you a happy Flash Crash-A-versary …
Wikipedia: The May 6, 2010, flash crash,[1][2] also known as the crash of 2:45 or simply the flash crash, was a United States trillion-dollar[3]stock market crash, which started at 2:32 p.m. EDT and lasted for approximately 36 minutes.[4]:1
One of the most historic market crashes ever took place 10 years ago today, with the Dow Jones Industrial Average Index plunging more than 1,000 points, or 9%, within minutes, only to regain most of the losses by the end of the day. And thus, the flash crash was born.
Originally, a fat finger trade for a large order to sell Proctor & Gamble stock was blamed as the first domino to set off a terrible chain reaction, but the CME Group quickly determined no evidence of this. They even went as far to say that high-frequency traders actually contributed to market stability, as stock prices quickly rebounded.
A large hedge fund buying S&P 500 Index put options and a large institution selling 75,000 E-Mini S&P 500 ($4 billion) have both been blamed, but many holes have been found in those claims as well.
Nearly five years later, a London-based trader was arrested for his role in the flash crash. Navinder Singh Sarao was indicted by the US Department of Justice on 22 criminal counts, including using spoofing algorithms. Spoofing is now banned and it is an automated program to generate large sell orders, thus pushing down prices, then cancelling the order to buy at a lower price. Could one person really cause a meltdown like we saw 10 years ago? Again, many think this is quite far-fetched, including the author of this article. Given Sarao was sentenced to one year of home confinement and no jail time, maybe the courts agreed.
So what really caused it? “Incredibly, here we are 10 years later, and we still can’t seem to agree on what exactly triggered the flash crash,” explained LPL Financial Senior Market Strategist Ryan Detrick. “Was it a fat finger trade, or high-frequency traders, or a technical glitch, or a rogue trader trying to spoof the market? All have been blamed for that historic drop 10 years ago, and yet no one really knows what the exact reason was even a decade later.”
In the end, as more and more computers are involved in trading, huge swings are quite possible. Don’t forget though, the very first flash crash actually took place on May 28, 1962, so these types of huge moves have happened before and will likely happen again.
at RaiseReport
On this day in 2010, the flash crash temporarily caused $1 trillion in market value to disappear in about 30 minutes
REUTERS: U.S. yields fall before non-farm payrolls report (included just for fun…) MAY 6, 2021 / 7:08 PM
… "I'd say positions are being squared or shorts covered, which is counter to the bearish narrative," said Steve Feiss, managing director, fixed income, at broker dealer Etico Partners.
"Inflation remains a near-term risk but so far, the word 'transitory' remains a key hope and a single 1 million jobs non-farm payrolls print is only just beginning," he added…
… here is a snapshot OF USTs as of 715a:
… HEREis what this shop says be behind the price action overnight…
… WHILE YOU SLEPT Treasuries are richer out of the gates in the US after cash closures in both Japan (Children’s Day) and the UK, FX interbank volumes -15% and USTS -30% vs 30d averages. USD-crosses are a touch higher, JPY (-0.5%) the notable exception, with USDCNH also up (+0.3%). Bund yields are -4bps richer with the 10y yield implied -3.5bps vs Friday’s NY close, EU PMIs in-line to slightly weaker in services, while risk-assets are buoyant. DAX futures are +0.9% currently, SPX futures showing +16ps here at 7:15am. The US 2s5s10s curve is modestly richer (-1.25bps) with 5y real rates (-3.5bps) leading the nominal rally.
… and for some MORE of the news you might be able to use…
NEWSQUAWK: US Market Open: Equities & Bonds bid, focus turns to advancements in Rafah which has lifted crude; Fed speak due … Bonds are modestly firmer, with initial upside in Bunds trimmed slightly by large upward revisions to EZ PMIs … USTs are a touch firmer, in-fitting with EGBs, but with magnitudes thin given the UK Bank Holiday and Japan's absence; docket ahead a touch busier with Fed's Barkin & Williams due after the latest Employment Trend numbers.
Finviz (for everything else I might have overlooked …)
Moving from some of the news to some of THE VIEWS you might be able to use (and in addition to THESE offered over the weekend HERE) … here’s SOME of what Global Wall St is sayin’ …
We view the April jobs report as aligned with necessary US labor market rebalancing, with the burden now on upcoming inflation data to confirm that Q1 firming was more noise than signal.
The high hurdle to Fed rate hikes reinvigorates the asymmetry around front-end yields while leaving us cautious about chasing this week’s rally in longer-term yields.
In FX, the combination of a dovish Fed, resilient global growth and falling FX vol may open a window of opportunity to re-engage in FX carry.
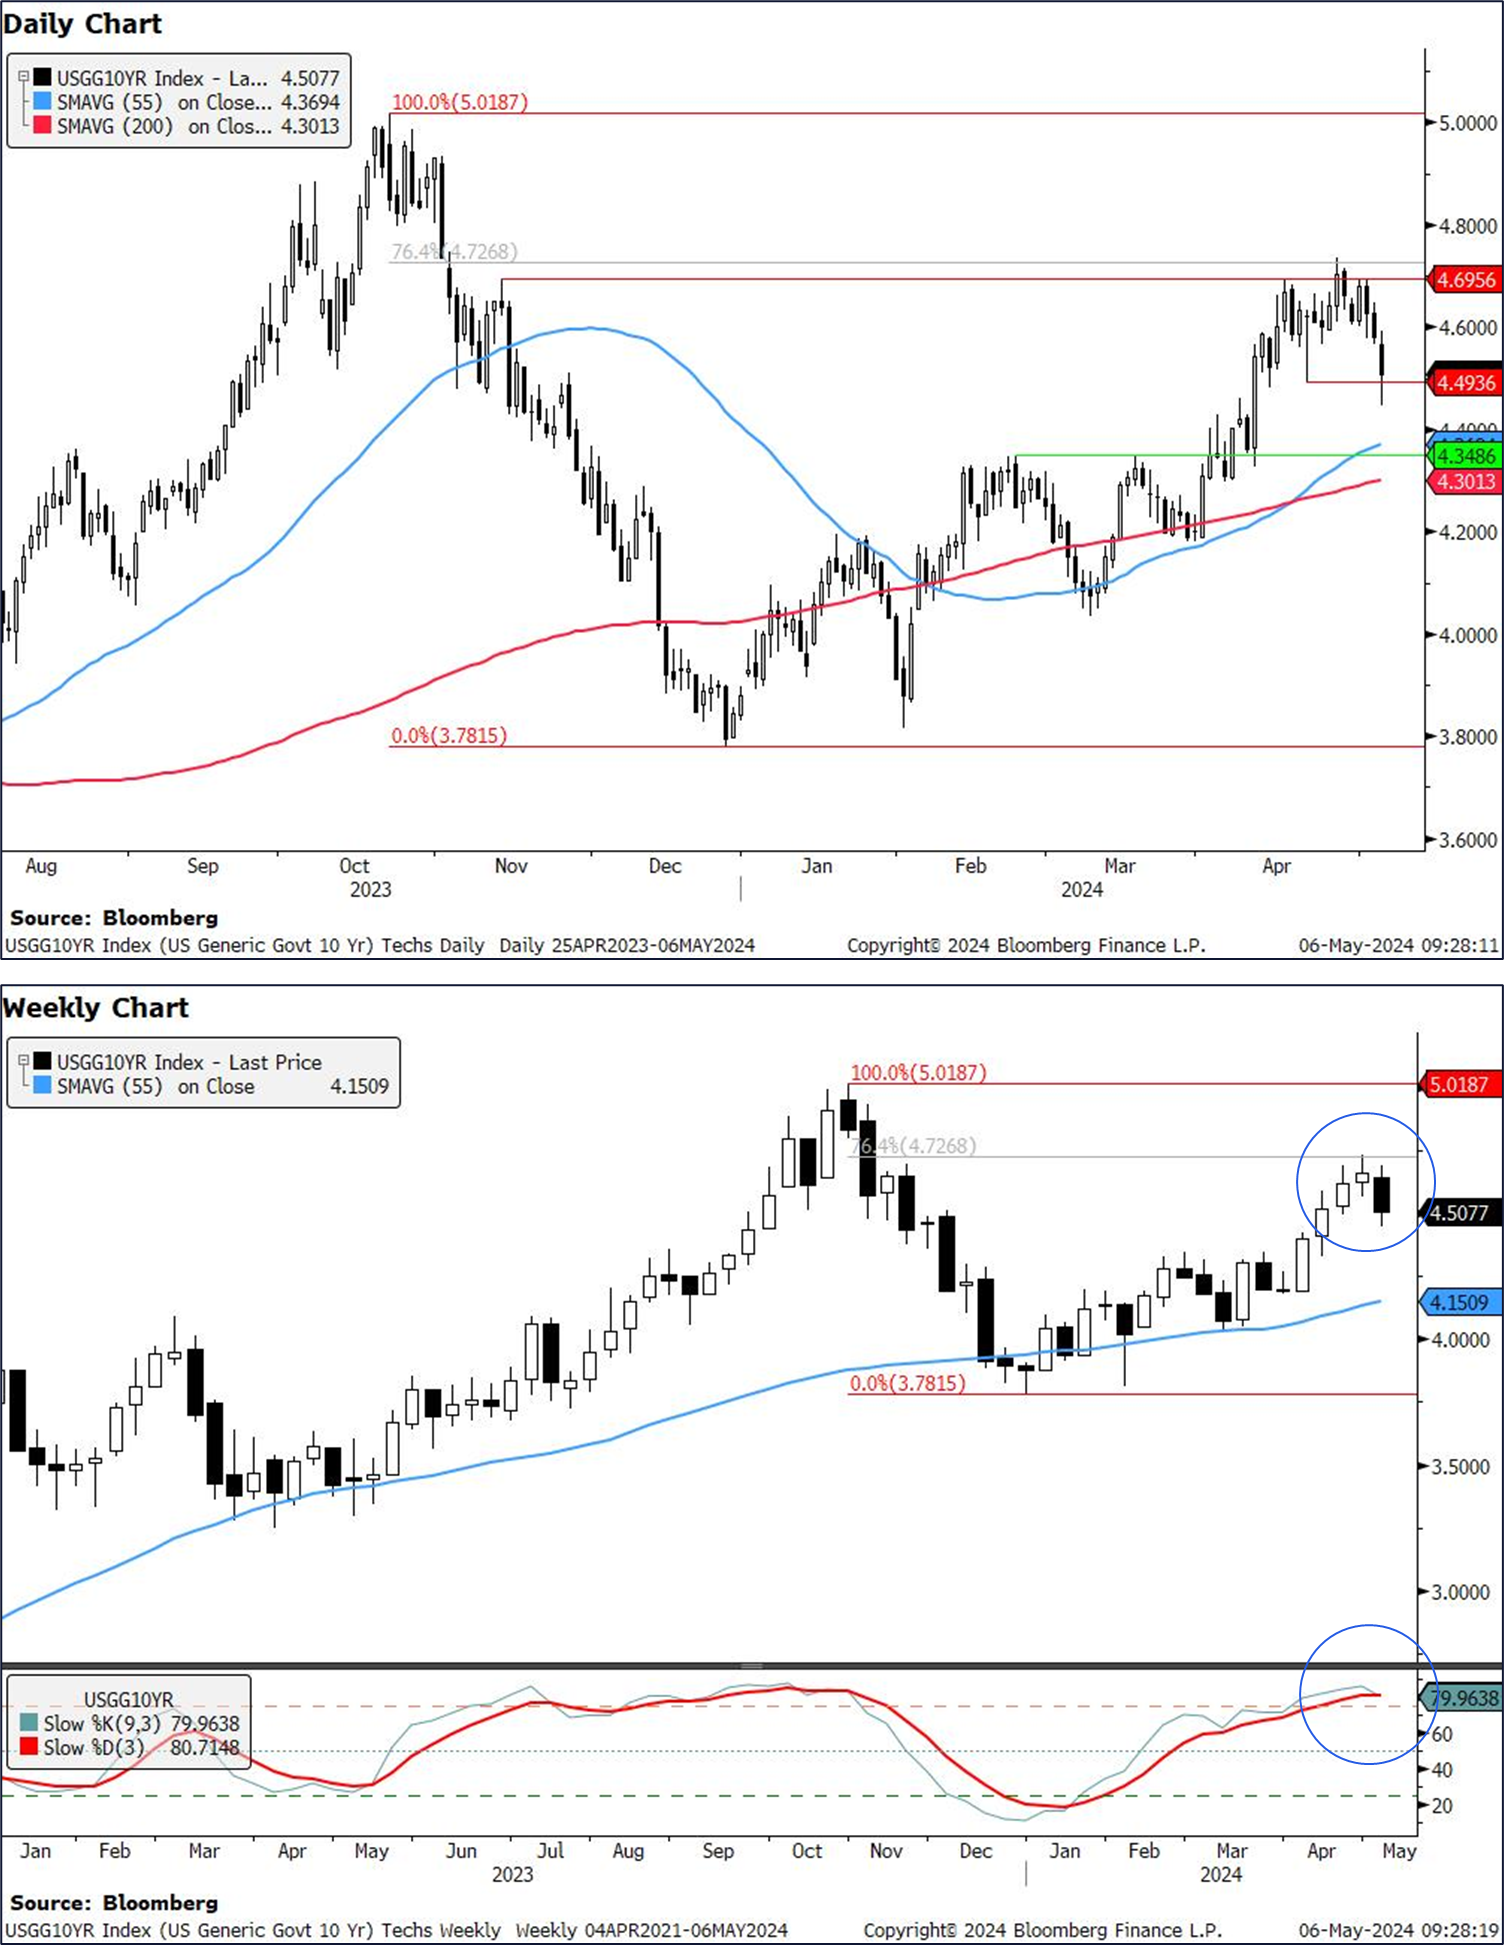
Weaker than expected US jobs and Fed Chair Powell's willingness to respond to the labour side of the dual mandate has resulted in lower yields. In techs, the picture is clear: Formations point to a larger Treasury rally.
US 2y yields: Indicators suggest we are in for lower yields. 2y yields have posted a weekly engulfing candle at the highs of the recent trend and off the 76.4% Fibonacci retracement. We also saw a crossover in weekly slow stochastics, suggesting waning momentum.
We think the combination suggests we are in for lower yields. The first major support level is at 4.74%-4.77% which we have already briefly tested (55d MA, 200d MA, Feb highs).
… US 10y yields 10y yields have posted a weekly evening star formation off the 76.4% Fibonacci retracement. At the same time, we see a crossover in weekly slow stochastics. The combination suggests yields are likely to see a move lower here.
Thus far, we have not closed below the 4.49% support level (April 19 low). IF we close below this, we are likely to see a move down towards 4.30-4.37% , which holds a multitude of support levels (55d MA, 200d MA, Feb high and March high).
Goldilocks: Has the Immigration Rebound Helped to Solve the Inflation Problem?
Immigration into the US collapsed at the outset of the pandemic but has rebounded forcefully over the last year and a half at a pace that has now exceeded the pre-pandemic trend by 1.8mn. Over the same period, wage growth and inflation initially surged but have since come down sharply. In this Analyst we explore whether the dramatic immigration turnaround from shortfall to surge helped to dampen wage and price pressures, and whether a potential decline in immigration after the election could cause wage growth and inflation to reaccelerate…
… Our results suggest that the immigration turnaround from shortfall to surge helped to dampen wage pressures, though it likely played a modest and secondary role. We expect net immigration to moderate this year, and it could decline further after 2024, depending on the election outcome. But our analysis suggests that with the labor market now back in better balance, the textbook answer—that moderate fluctuations in immigration should have little impact on aggregate wage growth and inflation—is probably right again, at least barring dramatic policy changes.
Treasury yields posted their first weekly decline in over a month while spreads were rangebound following less hawkish-than-expected remarks from Chair Powell and a softer-than-expected labor report …
… Treasuries: Yields are likely near local peaks and valuations remain attractive, but next week’s refunding auctions present bearish risks, and it will be tough for yields to follow through lower unless April inflation data validates this more dovish implied Fed policy path: stay neutral on duration and on TIPS breakevens
Treasury yields posted their first weekly declines in over a month while credit and mortgage spreads traded in a range-bound fashion following a week replete with key monetary, fiscal, and labor market developments. Yields initially moved higher early in the week on the back of a stronger-than-expected ECI report, before reversing lower following less hawkishthan-expected remarks from Chair Powell and a cooler-than-expected April jobs report. At this week’s Fed meeting, the statement language was changed to acknowledge the recent disappointing progress in bringing inflation down further, and the Chair’s prepared remarks echoed his speech from two weeks ago, suggesting it is likely to take longer than previously expected to gain confidence that inflation is moving sustainably towards 2%. Still, Powell seemed reluctant to offer that the next move could be a hike in the Q&A. The Chair laid out three policy paths: a path where inflation remains persistent, in which case they “hold off on rate cuts,” a path where they regain confidence that inflation is coming down (cut), and a path of unexpected weakening in the labor market (cut). In order to consider hikes, the Committee would need to see “persuasive evidence” that policy is not sufficiently restrictive. But in a number of places, he said that it’s “clear” that policy is restrictive (see Hikes aren’t in the gameplan, Michael Feroli, 5/1/24).
From that perspective, Fed officials will likely view the April employment report as a welcome sign that the labor market is coming into better balance. Nonfarm employment rose 175k in April, the softest monthly gain since October, and the work week ticked down to 34.3 hours. The unemployment rate ticked up from 3.8% in March to 3.9% in April. Finally, average hourly earnings increased only 0.2% in April, and the year-ago figure cooled to 3.9%. While all these signals were softer than prior months, they were still generally solid, and we continue to track 2Q real GDP growth at 2.5%, supported by strong consumer demand. Moreover, given this week’s data and the expectation that the next two job reports will show continued cooling in labor market activity, we stick with our call that the first Fed rate cut will come in July (see A welcome cooling in the April jobs report, Michael Feroli, 5/3/24).
While the market-implied path of Fed policy shifted somewhat more dovishly following this week’s developments, markets continue to price less easing than our own forecast: OIS forwards are pricing in an 80% probability of a 25bp cut at the September FOMC meeting, and a full ease by the November meeting, for a total 45bp of easing this year (Figure 1Markets picng80% probailty ofa25bp esinStmber, andfules byNovemr). Looking ahead, we feel more confident that yields are peaking here given the historical precedent for major sell-offs to peter out after reaching approximately 100bp in magnitude and 3-4 months in duration. Moreover, valuations appear stretched, with intermediate yields looking nearly 40bp too high relative to our fair value estimate. However, we remain neutral on duration for now, as the next CPI report is still nearly two weeks away, and next week’s mid-month Treasury auctions could provide a bearish impulse over the near term. Treasury is set to auction approximately $112bn in 10-year Treasury equivalents spread across 3-, 10-, and 30-year maturities next week, and there has been some tendency for long-end yields to move higher in the days around and after the new-issue refunding auctions (Figure 2Over thlasyer, long-ed yilshave risn75% oftheim ndaysround afterundig actons). We could see an even larger concession for this supply next week given that it comes ahead of the all-important April CPI report. Thus, we remain neutral on duration, though we maintain 5s/30s yield curve steepeners (see Treasuries).
Chairman Powell reinforced what the market was thinking--it's all about inflation. But the question is where inflation is going.
Last week put the spotlight on US inflation. Chair Powell and the Fed made clear that only inflation is keeping them from cutting rates. Should we worry that disinflation has stalled, or worse, that inflation is rising? Probably not. Extracting signal from noise is hard, but we feel pretty confident that inflation will be falling again, and probably soon.
Tuesday’s ECI print grabbed attention. Price inflation and wage inflation are correlated, but we have demonstrated in the past (and as Fed staff has published research on) that most of the causality runs from price inflation to wage inflation, not the other way around. In his press conference, Chair Powell again downplayed the importance of the ECI as he had in November.
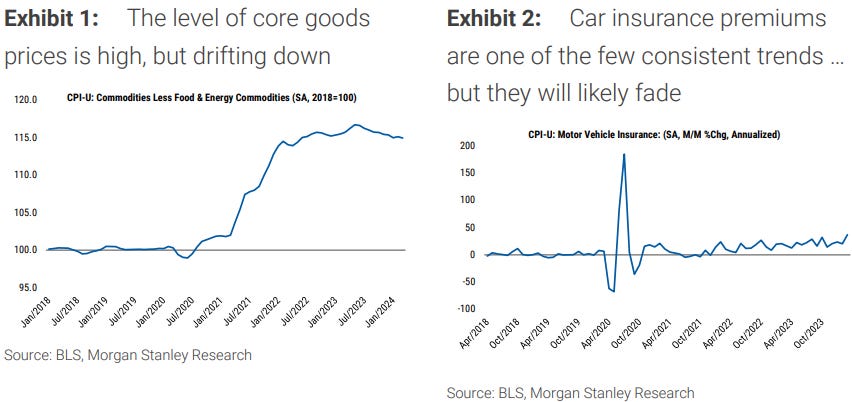
Nevertheless, to use the Fed’s words for the last three months, “there has been a lack of further progress” on inflation … but I think the details matter. For PCE, goods inflation has driven a lot of the increase, (and since most goods are imported, US employment costs are secondary here). Computer software, video tapes, and apparel jointly explain 2/3 of the acceleration, so I see the inflation as idiosyncratic, not widespread. In fact, using weights from the CPI, core goods inflation was negative two of the past three months…
… Taken together, we expect disinflation to resume with the next couple of prints and it will likely be even stronger in the second half of the year. And our US team recently documented that seasonal adjustment has likely overstated inflation in the first quarter of the year, suggesting some arithmetic payback later. Where the signal is clearest, it points to falling inflation, while the evidence for higher inflation is the noisiest.
MS Sunday Start | What's Next in Global Macro: Cutting Tail Risks
“I don’t see the stag or flation actually,” Chair Powell riffed somewhat uncharacteristically off-the-cuff during the post-FOMC meeting press conference when asked about the risk of stagflation facing the US economy. The overall message from the Chair was crystal clear – the Fed’s next move in policy rates is unlikely to be a hike. The Fed’s focus is on how long the current target range for the fed funds rate will be maintained, and the next move, whenever it happens, is likely to be a cut. Chair Powell admitted that confidence that inflation is sustainably moving towards 2%Y has been dented somewhat, but the expectation that it will move down by year-end remains intact. Importantly, the FOMC’s decision was unanimous and the FOMC statement maintained an overall easing bias…
… In sum, the message from the Fed was clear and unambiguous. The policy rate path ahead is for rates to remain in the current range or decline, and the bar for the next move to be a hike is very high. This bodes well for a wide range of instruments in fixed income.
UBS (Donovan): Exuberance and the Fed (an interesting point of view…)
A single, dubious quality US data report last Friday was enough to send bond and equity markets into paroxysms of delight. One month’s employment report should not trigger market moves of this degree. It is easy to put all the blame for this on the exuberance of traders, but Federal Reserve Chair Powell’s mantra of “data dependency” means investors will naturally elevate imprecise short-term data releases into the arbiters of US monetary policy.
We do hear from some Fed speakers today, including Fed President Williams. The challenge is that while “data dependency” remains the narrative, Fed speakers are competing with market economists for the role of talking head data-analysts on television. It limits the impact of their remarks.
Assorted business sentiment opinion polls are due, but investors do seem to be paying less attention to this noise.
There are two reasons, lower interest-rate sensitivity and strong demand tailwinds.
Specifically:
A) Lower interest-rate sensitivity:
1) 40% of homeowners don’t have a mortgage, and 95% of mortgages are 30-year fixed that are not sensitive to the Fed raising interest rates.
2) During Covid, most firms termed out their debt at very low levels, and with the IG market having grown from $3 trillion in 2009 to $9 trillion today, see the second chart, the interest-rate sensitivity of corporate America has declined.
3) A growing share of capex spending is intangibles (R&D and software), which generally is less sensitive to Fed hikes.
B) Strong cyclical and structural demand tailwinds:
1) Fiscal spending, including the CHIPS Act, Inflation Reduction Act, and Infrastructure Act, is still a strong tailwind to growth.
2) Excess savings have recently started to rise again for higher income households, see the third chart.
3) Immigration has been unusually strong, supporting overall employment growth.
4) The Fed turning dovish in December 2023 has eased financial conditions significantly, which continues to boost consumer spending and capex spending.
5) Higher interest rates give higher cash flow to households that own fixed-income assets.
6) After 14 years of very low interest rates from 2008 to 2022, the demand for higher all-in yields remains extremely strong from insurance companies, pension funds, and retail investors, which has contributed to easy financial conditions that have been offsetting Fed hikes. The AI story has also boosted household wealth and eased financial conditions.
7) Corporates that got into trouble once the Fed started hiking have not been liquidating their assets but instead doing reorganizations and distressed exchanges, and this has kept many firms alive that would otherwise have gone out of business, see the fourth and fifth charts.
In summary, the economy is strong for two reasons:
A) Consumers and firms locked in low interest rates during Covid, which made the economy less sensitive to higher interest rates (i.e., bullet points No. 1 to 3 above), and
B) Strong demand tailwinds coming from fiscal, excess savings, immigration, and easy financial conditions (i.e., bullet points No. 1 to 7 above).
With this backdrop, it is not surprising that inflation and labor costs remain high, and these 10 forces will keep the economy strong for at least several more quarters.
Eventually, the Fed will get inflation back to 2%, but it is increasingly clear that it will require a meaningful slowdown in the labor market and the housing market.
In short, GDP and earnings should remain strong for the rest of 2024.
Source: Redbook, Bloomberg, Apollo Chief Economist
Bloomberg: Treasury Rally Risks Running Into a $125 Billion Brick Wall
Gains after Powell and a soft jobs report face demand test
Shorter maturities favored as US 10-, 30-year auctions loom
… Curve Calculations
In the month leading up to last week, traders had clawed back wagers for multiple rate cuts this year amid data pointing to relentless growth and persistent inflation. Now, market pricing reflects expectations for almost two full cuts instead of just one as of earlier last week.
While some rate cuts will keep the two-year yield below last week’s peak, the outlook for 10- and 30-year bonds is less compelling for investors should inflation remain above the Fed’s target and Washington’s spendthrift ways result in another rise in long-end auction sizes.
George Catrambone, head of fixed income, DWS Americas prefers owning the two-year “as the probability of rate hikes remains remote,” and remains “skeptical of the outer reaches of the curve,” and has been for “quite some time.”
… “The back end is more vulnerable to repricing higher in yields” than “capped” front-end rates, said Jennifer Karpinski, managing director at Jennison Associates, which oversees $50 billion in fixed income assets.
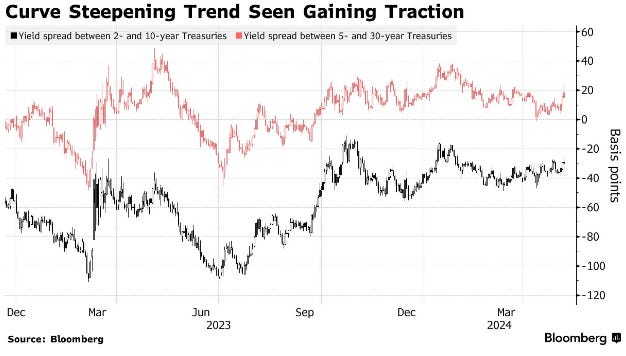
Jennison favors “a steepening trade strategy” in their portfolios, whereby they are overweight two-, three-, and five-year US Treasuries, while being underweight the 10-year note. “It’s hard to call when the long end does become attractive.”
A steeper curve is in store should the Fed begin cutting and the market prices in more easing on softer data. That would result in the US two-year yield falling faster than longer-dated benchmarks. For would-be buyers of the long end, the real payoff is that inflation will moderate and allow the long end to join a front-end led rally.
Bloomberg: A Random Walk Dodging Disaster on Wall Street (Authers’ OpED)
Plenty of potential pitfalls appeared in markets as the second quarter got underway. They’ve largely been sidestepped.


The End of Old Left-wing Mythologies
By Victor Davis Hanson
http://trk.amgreatness.org/c/7/eyJhaSI6OTkyNjA2OTcsImUiOiJ2YW5oZXluaW5nZW5AeWFob28uY29tIiwicmkiOiIxMzc1NTM2OTQwIiwicnEiOiIwMi1iMjQxMjctOTJhNWRkZTBmM2I5NDBiMzgwNzEwYmRkMzY2NDc3YTkiLCJwaCI6bnVsbCwibSI6ZmFsc2UsInVpIjoiIiwidW4iOiIiLCJ1IjoiaHR0cHM6Ly9hbWdyZWF0bmVzcy5jb20vMjAyNC8wNS8wNi90aGUtZW5kLW9mLW9sZC1sZWZ0LXdpbmctbXl0aG9sb2dpZXMvP3V0bV9tZWRpdW09ZW1haWwmdXRtX3NvdXJjZT1hY3RfZW5nJnNleWlkPTEzNDE1MSJ9/yZEOtdUI-XS17LNJ6Jcm7g
The Rubin Report: Images of UCLA campus, Post-Protest...
https://www.youtube.com/shorts/9bCc7mz-R2s