while WE slept: USTs bid into CPI; UPdated yield f'casts; stocks double tops; bonds TO 6.50%?; strong Foreign (PRIVATE)demand for USTs...
Good morning … MORE good news out yesterday in form of PPI, setting the table, if you will, for this mornings MORE important CPI …
CNBC Inflation watch: Wholesale prices rose 0.2% in December, less than expected
Investing.com: US producer prices rise by 0.2% in December, slower than anticipated
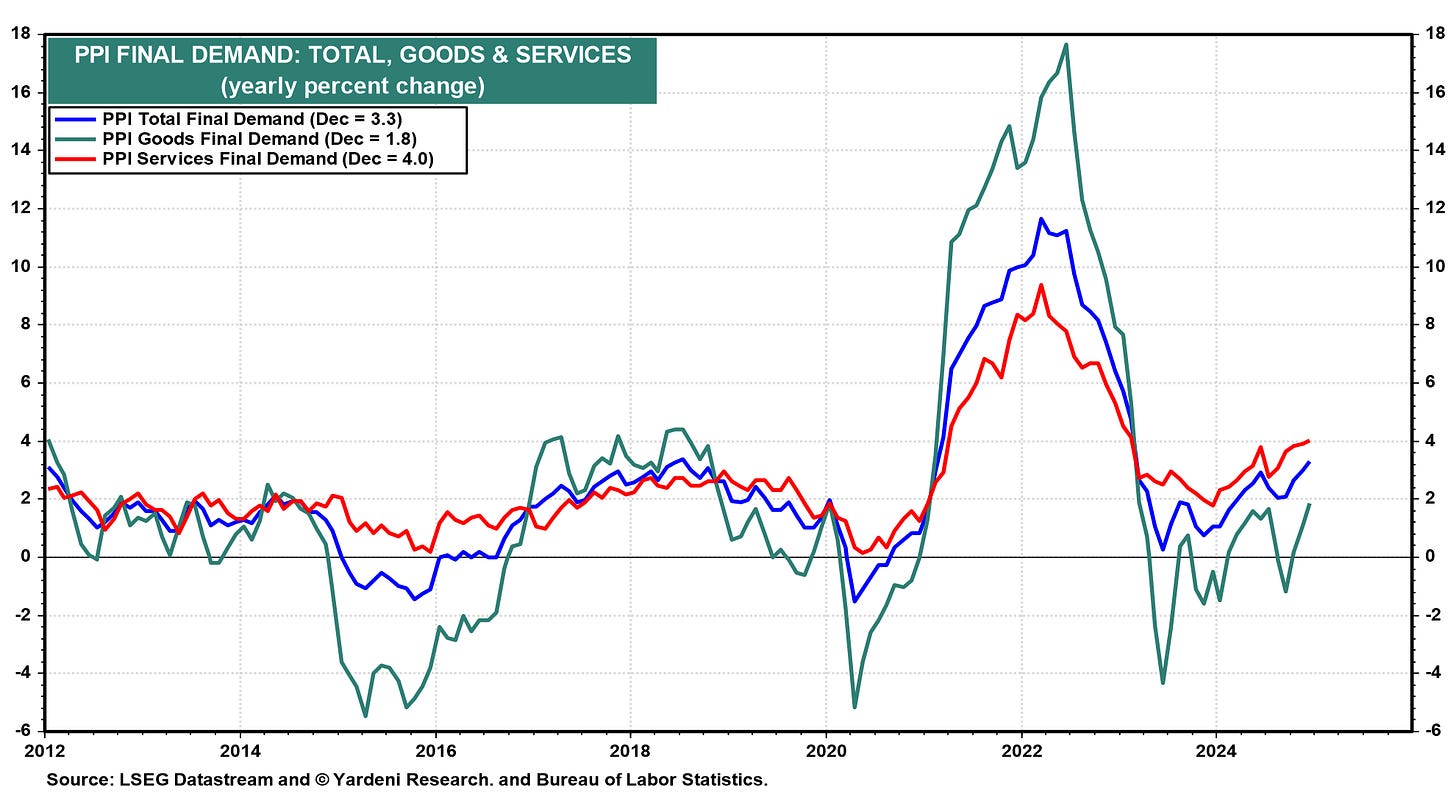
WolfST: PPI Inflation Accelerates to +3.3%, Driven by “Core Services,” +4.0%, both the Worst Readings in Nearly 2 Years
2024, the year of sharp acceleration. Services, accounting for two-thirds of PPI, are where inflation is festering and accelerating.
ZH: Under Biden, Producer Prices Rose At Triple The Rate They Did Under Trump
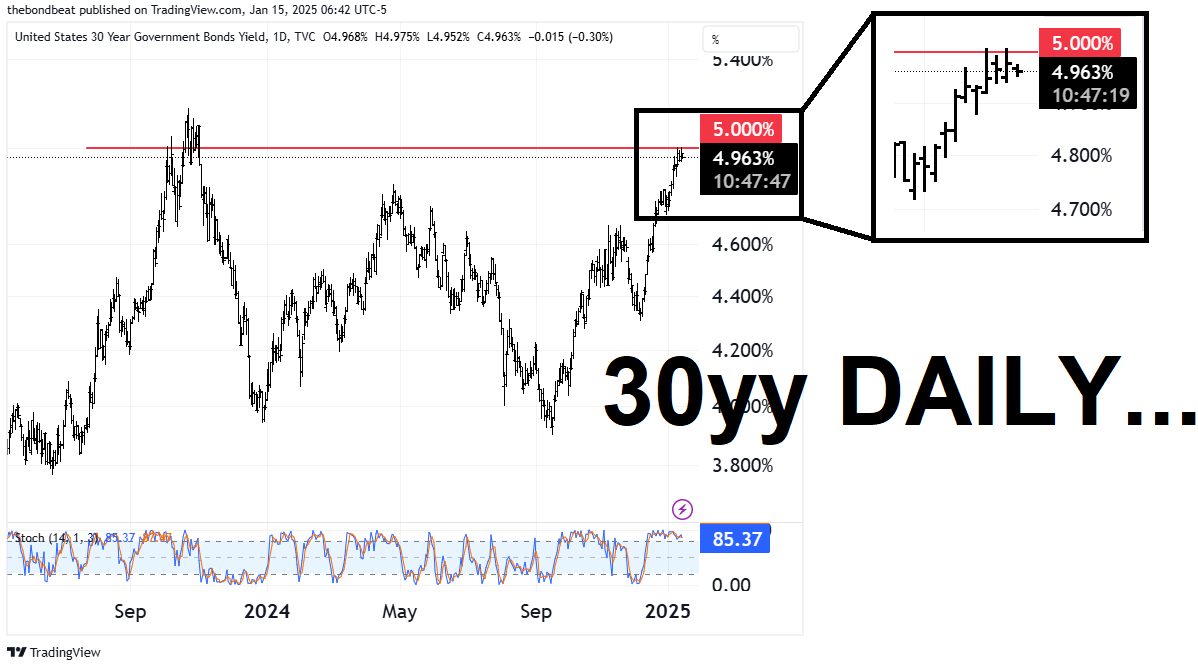
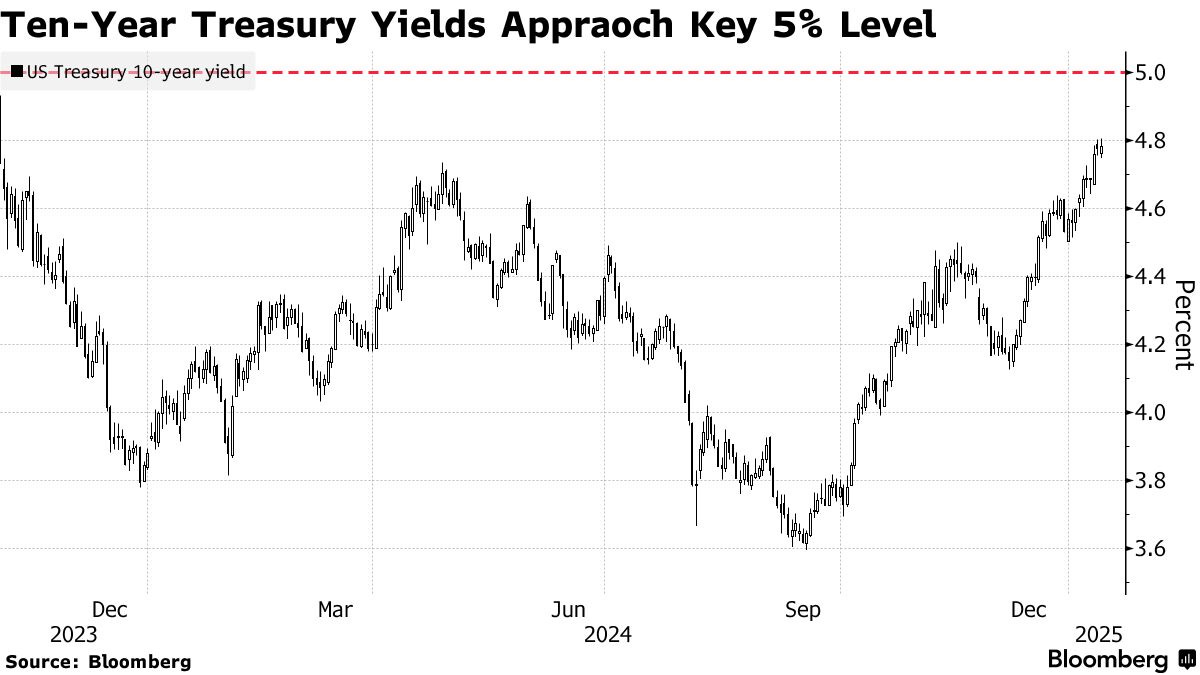
… and WITH this ‘good’ news, long bonds approached / romanced 5% yield levels (again) and are currently pushing back …
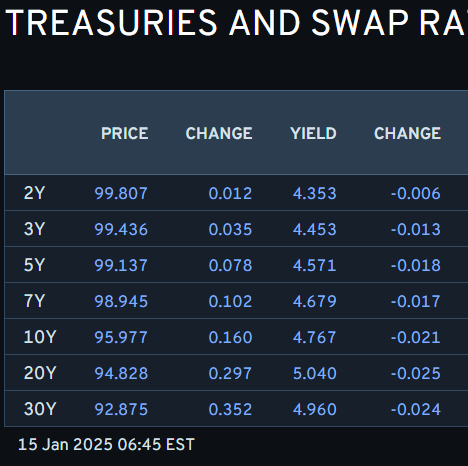
… momentum remains overSOLD and this mornings CPI print will likely help decide direction of travel, at least in the short-run. 5.00% may just be speedbump along path much higher (6.50% or higher? see KIMBLE below) … here is a snapshot OF USTs as of 645a:
… for somewhat MORE of the news you might be able to use … a few more curated links for your dining and dancing pleasure …
IGMs Press Picks: January 15 2025
Yield Hunting: Daily Note | January 14, 2025 | PDX Skyrockets, EIM Tender, NRO Rights Offering
NEWSQUAWK: USD softer ahead of US CPI, Gilts gap higher on cooler UK inflation … Gilts inflated by CPI, JGBs dented by Ueda & USTs await CPI … USTs are in the green and just off the session highs of 107-16+. Yields lower across the curve with the long-end leading and the curve as a whole flattening a touch. The session’s main event is US CPI, the headline M/M is expected to remain at 0.3%.
PiQ Overnight News Roundup: Jan 15, 2025
Opening Bell Daily: Big bank earnings begin … What to know as JPMorgan, Goldman Sachs and the rest of Wall Street kick off earnings … Financial stocks have rallied since Trump won the election and soft-landing hopes have climbed.
Reuters Morning Bid: Inflation offers crumbs of comfort, big banks report
Finviz (for everything else I might have overlooked …)
Moving from some of the news to some of THE VIEWS you might be able to use… here’s some of what Global Wall St is sayin’ …
Bank of the land UPPING yield forecast. We pause now to read …
BAML: Global Rates Viewpoint
Bond sell-off: drivers and new forecasts
14 January 2025Key takeaways
10y bonds 60bp higher in the US & UK and 50bp in Ger since Dec, largely down to a repricing in central bank expectations.
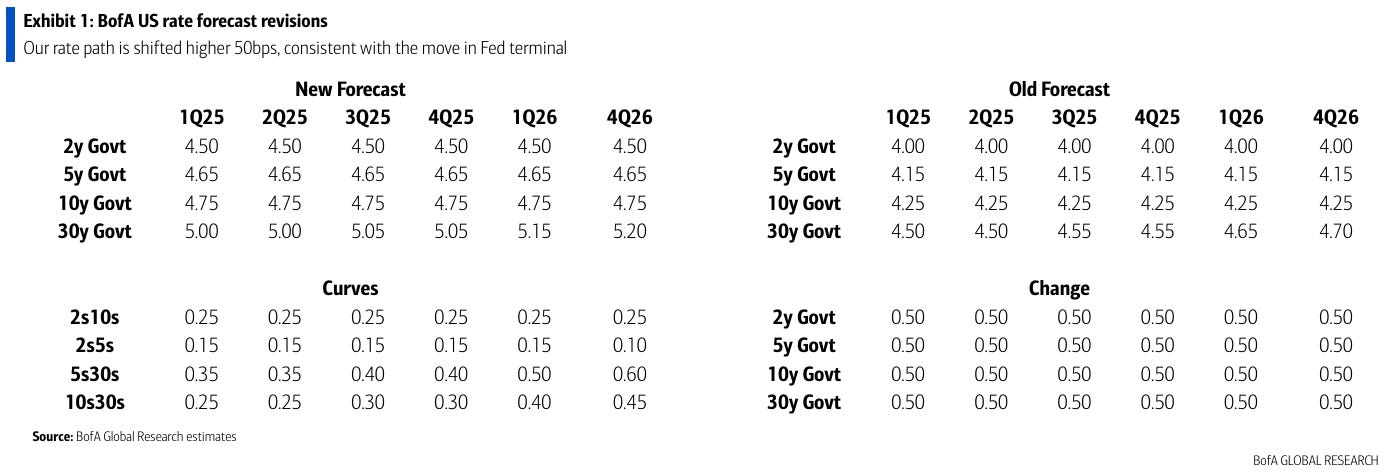
We up our UST forecasts on strong macro & no more Fed cuts. We adjust European and AU forecasts too, but stay bullish vs fwds
… Post payrolls on Friday, our US economists revised their Fed call & now expect no further cuts over the forecast horizon (see report: Rate cuts were so 2024 … Consequently, we revised our US rate forecasts higher by 50bps across the forecast horizon … Our new projections are slightly below the forwards but well above consensus and stable across the forecast horizon (Exhibit 1) - in-line with our US economist expectations for robust growth (2-2.6% y/y), sticky core PCE (2.1-2.6%, y/y), & strong labor market (U3 4.2-4.5%) thru end '26. We see risks to our US forecast as balanced. Rates can rise with further reduction of Fed cuts, rising odds of Fed hikes, or sharper UST supply / demand imbalance. They can decline on slower growth or larger negative feedback from higher rates into risk assets.
We like long EUR real rates x-mkt vs US & UK, long EUR front-end hedged with 3m2y payer fly, steepeners in UK & US (vs AU)
We’re just 15d IN to the year … let that (UP 50bps from priors …) sink in and lets turn back TO yesterday’s data as far as any takeaway / implication for future … UK on PPI, while ‘friendly’ on the top-line, these folks drill home an important PCE point …
BARCAP: PPI data provided a boost to December core PCE inflation
PPI inflation was softer than expected in December. However, the categories that inform core PCE, notably domestic and international airline fares, were substantially stronger than expected, leading us to mark our December core PCE estimate higher by almost 9bp, to 0.28% m/m (2.9% y/y).
Same shop on earnings …
BARCAP: U.S. Equity Insights: 4Q24 Earnings Preview: Can Tech Bloom Amid ex-Tech Gloom?
Earnings season could be a crucial catalyst given the year's rough start. Tech remains central to EPS growth for SPX; meanwhile, negative revisions and below-trend growth targets imply a low bar to clear for non-Tech sectors. FY25 consensus is drifting down toward our estimate.
Anyone ELSE here like charts? Best techAmentalists in the biz on stocks POTENTIALLY double topping …
CITIFX: US equities: Potential double top formations
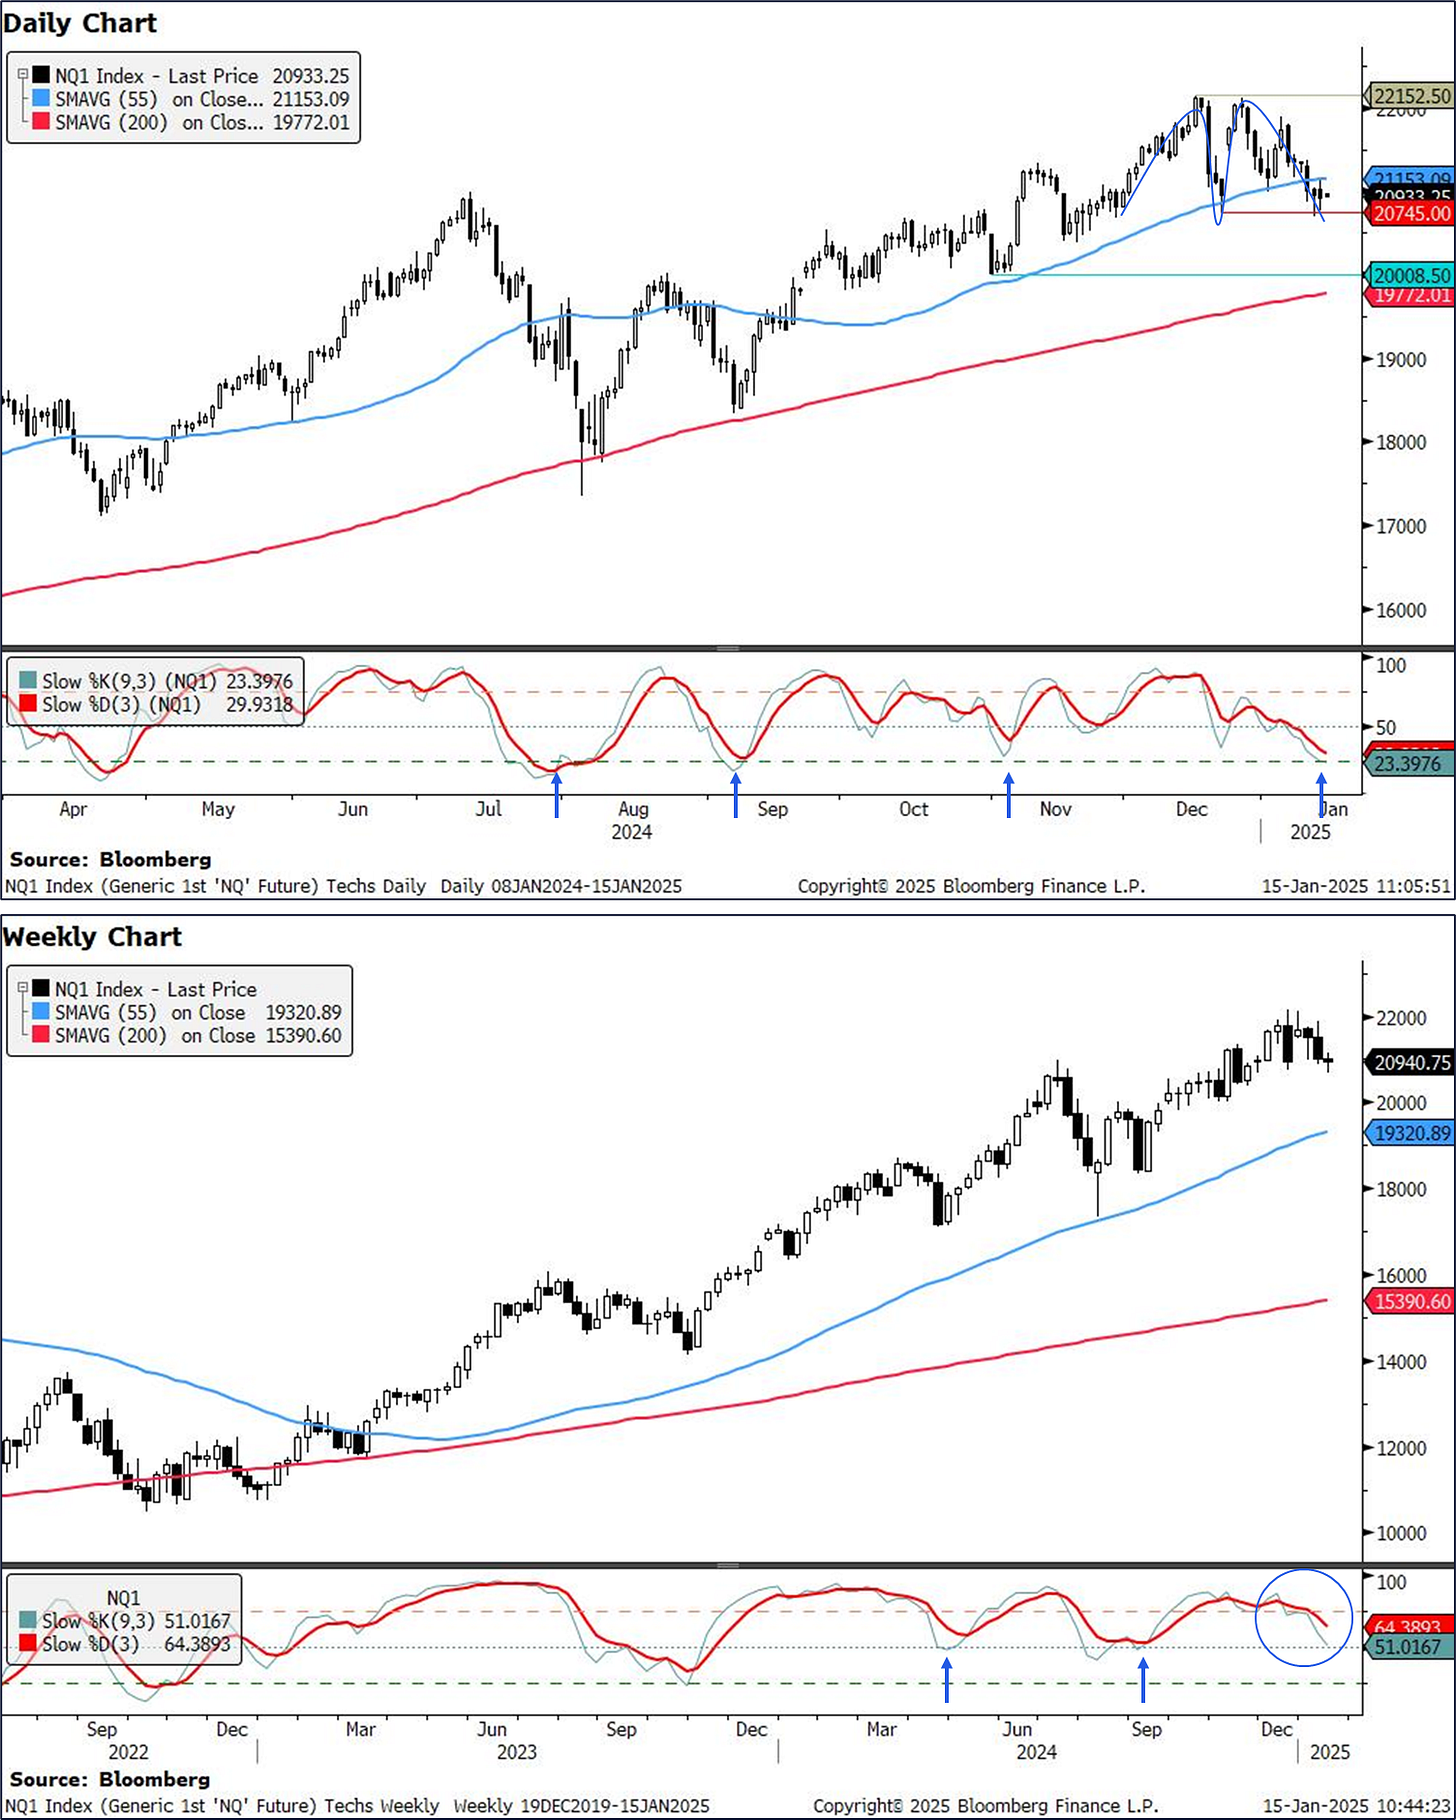
Both S&P e-minis and Nasdaq 100 futures are testing the neckline of double top formations. IF we close below the neckline, the picture would turn short term bearish for both. However, price action for both may differ: Support is relatively nearby for S&P e-minis, potentially limiting downside. However, Nasdaq 100 futures could face a ~4% dip before seeing the next layer of strong support…
…Nasdaq 100 futures (NQ1):
There are fewer supporting signs for Nasdaq100 futures vs S&P e-minis, suggesting we could see a ~5% move lower IF we see a weekly close below the double top neckline of 20745 (Dec 20 low).The double top formation suggests a target of ~19337 IF we see the weekly close lower. Unlike S&P e-minis however, we did not post a bearish outside week last week.
Nevertheless, there are fewer notable supports for Nasdaq 100 futures:
Strong support is only at 19772-20009 (200d MA, Oct 31 low), which accounts for a ~4% move lower.
Daily slow stochastics is grazing oversold territory, where we have seen upticks from in 2024
Similarly, weekly slow stochastics, is at levels where we saw an uptick from in 2024
As a result, while we do think a move towards the double top target is likely at this stage, we could still see a drop of ~5% towards the next layer of support.
German stratEgersist to the (Global Wall)stars out with an interesting if BINARY variable charts work CHART … lets HOPE this one isn’t good cuz, well, Team RateCUT not gonna like …
DB CoTD: The Price of Policy...
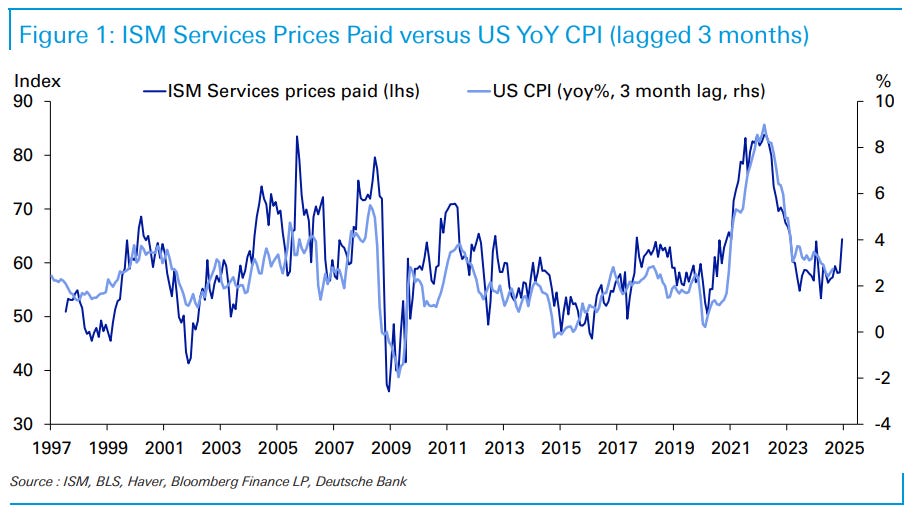
…oday’s CoTD plots the ISM services prices paid data against YoY US CPI and shows the strong correlation, even if the former is far more volatile. Statistically, the correlation between the two is highest with CPI responding around a quarter after prices paid.
In January last year (released early February) we saw a big spike up in prices paid from 56.6 to 64. However, this corrected back to 58.3 the following month and CPI declined notably in Q2 and Q3 so even though it’s dangerous to read too much into one reading, it’s part of a bigger narrative at the moment.
For tomorrow, our economists expect headline (+0.40% mom forecast vs. +0.31% last month) to be impacted by strong food and energy and eclipse a tamer core reading (+0.23% vs. 0.31%). This would ensure a YoY rate of 2.9% for headline (+0.2pp) and 3.3% for core (unch) respectively. See our economists’ preview here with a registration link to their webinar immediately after the release. Amongst other things, they discuss how rents will boost this month’s release but with signs of continued rental disinflation ahead.
The curveball will of course be policy under the new administration. It’s possible that some of the recent inflation-related surveys have seen a spike up on tariff fears. The reality could of course be better or worse than that, so these series may be volatile and sensitive to news flow at the moment. So all to play for in 2025 and beyond. The policies that will dictate a big part of the inflation story have likely not been decided upon as yet.
Same shop with an unrelated-to-CPI visual but one that is near and dear to me …
DB: Recent trends in Treasury market liquidity
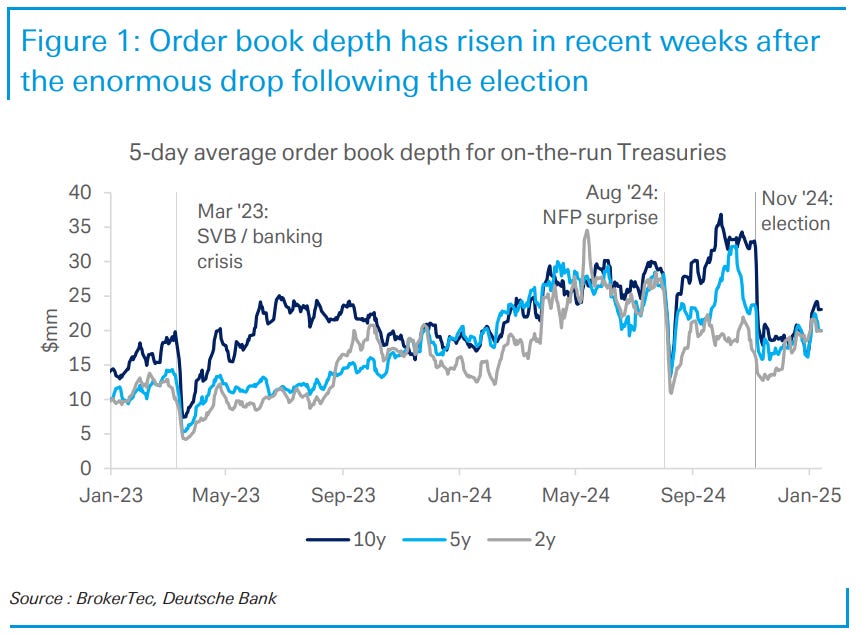
Today’s COTD examines order book depth, a commonly-used measure of liquidity in the Treasury market. The chart highlights instances of order book depth experiencing sharp and sudden declines due to market-moving events, with the most recent example being the election in November.
Prior to the election, order book depth had gradually improved over the course of 2023 and 2024, peaking around September/October. However, it plunged significantly after the election, with levels staying depressed through the rest of the year. The size of this decline was comparable to the drops around the March 2023 banking crisis and the August 2024 nonfarm payrolls surprise. Notably, the market rallied in both of those instances, whereas the market sold off immediately following the election.
Although order book depth has been slow to recover from the election-related decline compared to other liquidity metrics such as bid-ask spreads, it has since rebounded from local lows in recent weeks, pointing to some improvement in Treasury market liquidity. From a longer-term perspective, liquidity as measured by order book depth looks decent since the beginning of the hiking cycle but substantially worse than during the pandemic-era QE.
Same shop with couple / few MORE h’line / titles / clickbait (but notes worth a look)
DB: Mapping Markets: Why inflation risks are still rising into 2025
DB: On Oil - No more 'whack-a-mole'
DB: Another year of 5% growth target
DB: The History & Future of Trade: 25 Charts for 2025
Holdin’ out hope for CPI-inspired answers? Welp …
ING: Rates Spark: A consensus US CPI will not relieve the bearish pressure
The US consumer price inflation report due Wednesday is not the type of report that the Fed thought they would see at end-2024. Squint your eyes and you see a 3% inflation rate for December, and month-on-month rates, that when annualised, are in fact point closer to 4%. This, in part, is why the funds rate cut expectations have collapsed, and Treasury yields are knocking on the door of 5%
Next a couple from Swiss shop …
UBS: Shell shocked?
US December consumer price inflation should show modest headline gains. It is worth distinguishing inflation pressures and relative price changes. Egg prices are likely to rise sharply—egg producer prices rose 127.9% y/y in December. This is a supply shock. Unless Federal Reserve Chair Powell becomes a chicken farmer, they can do nothing about this.
US President-elect Trump wishes to establish an “External Revenue Service”. The use of the Oxford comma in the statement is an admission that US consumers pay Trump’s trade taxes (the service will collect “Tariffs [comma] Duties [comma] and all Revenue that comes from Foreign sources”). Tariffs seem to assume a different, more enduring role in this administration. This highlights the contradiction of single-issue politics. Duplicating the bureaucracy of the customs service would increase regulation…
UBS: PPI implies December core PCE price rise of 25bp
‘Bout NFIB …
WELLS FARGO: Small Business Optimism Shoots Up in December
Better Economic Outlooks and Greater Certainty Boost SentimentSummary
Small Business Optimism on the Upswing
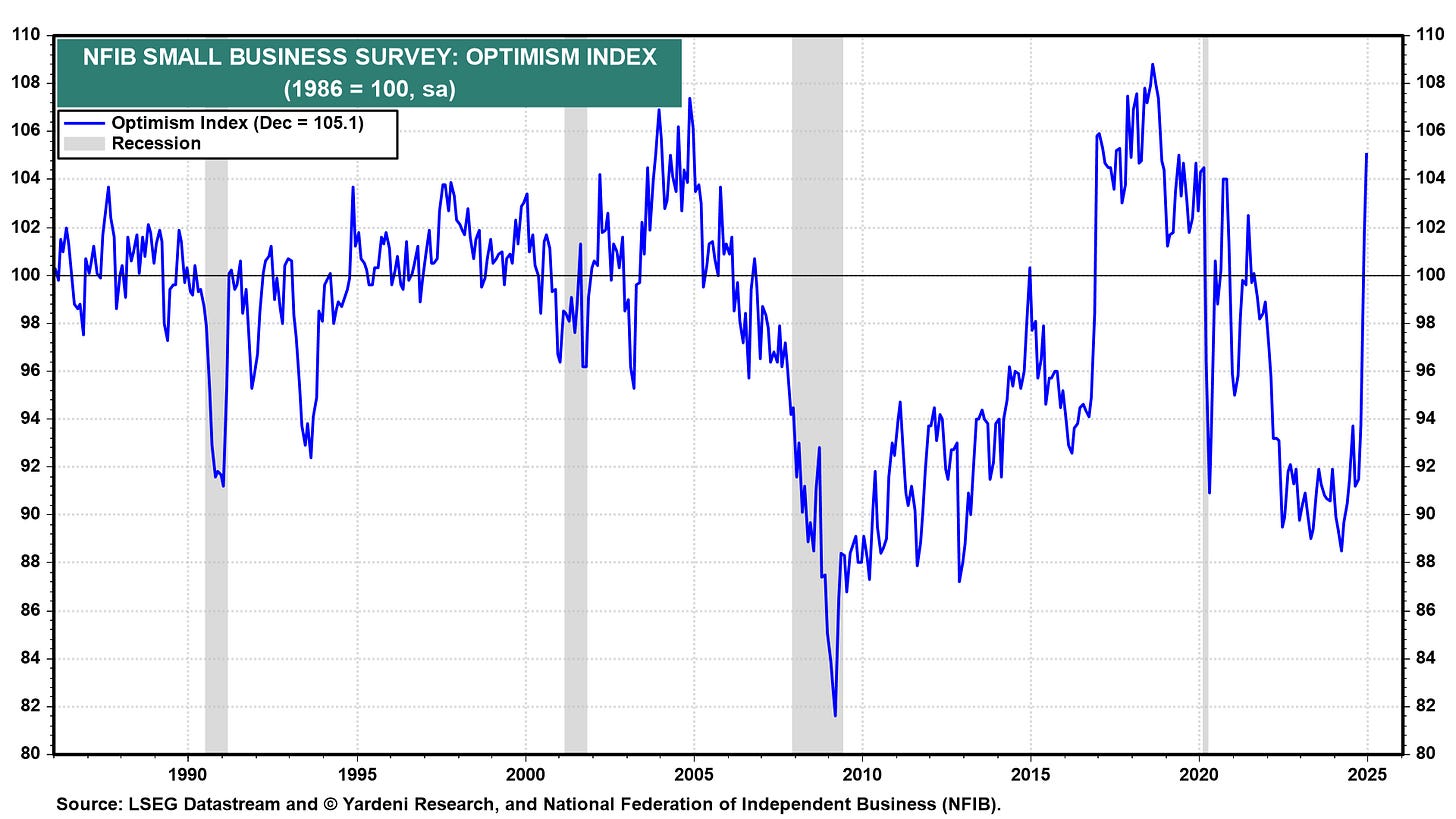
Small business sentiment continued to improve in December alongside greater economic and public policy certainty. The NFIB Small Business Optimism Index rose 3.4 points to 105.1, reaching its highest level since October 2018. Ongoing Fed easing coupled with a settled 2024 election likely played a role. The net share of owners anticipating better business conditions over the next six months soared to 52%, the second highest reading on record since the survey began in 1987. Meanwhile, small business owners generally reported easier access obtaining loans and expectations for more favorable credit conditions over the coming months. Labor demand also showed some early signs of stabilization, evidenced by an improvement in hiring plans in December. Yet progress on disinflation continued to stall, keeping inflation the top concern for small firms.Source: NFIB and Wells Fargo Economics
AND then there’s this next one from Dr Bond Vigilante, spinning fairy tales …
YARDENI: Not Too Cold, Not Too Hot
On the economic data front, it was mostly a Goldilocks day. December's PPI was lower than expected. The NFIB survey of small business owners showed rising optimism and animal spirits. However, the Treasury reported that the federal budget deficit totaled a record $711 billion in the October-December period, up 39% from $510 billion in the same period a year ago.
The bears were still growling in the bond market and the stock market marked time awaiting tomorrow's December CPI report. The markets are likely to remain listless until Monday's Inauguration Day, when President Donald Trump is expected to issue numerous Executive Orders which might muddy rather than clarify the economic outlook.
Let's review today's numbers:
(1) PPI. December's PPI rose 0.2% m/m, cooler than analysts expected. However, the PPI rose 3.3% y/y, its highest since February 2023. Both goods and services inflation rose, with the later up to 4.0% y/y (chart).
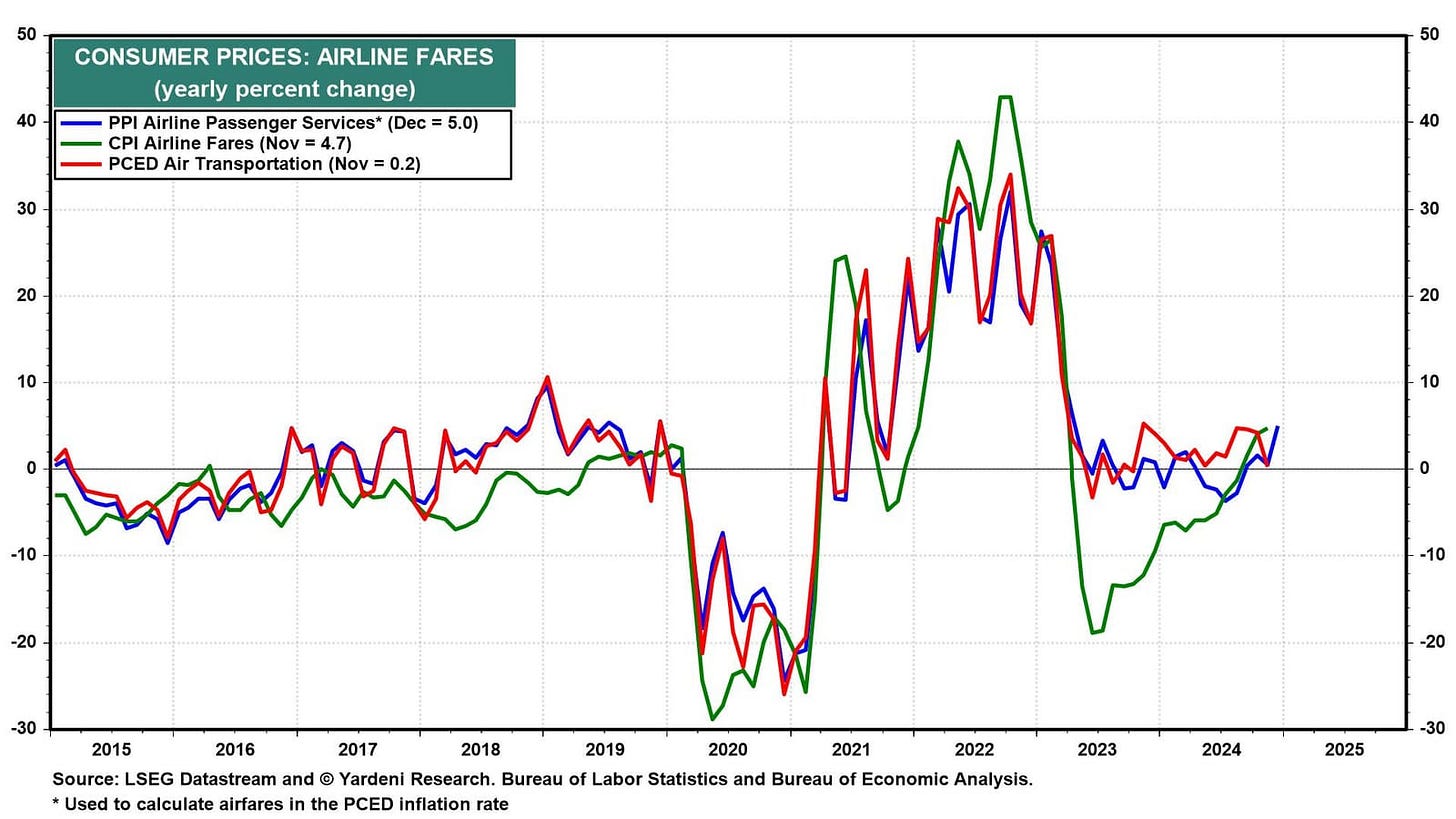
The bond market may have been spooked by airline passenger services in the PPI, which rose 7.2% m/m and 5.0% y/y (chart). It is used to calculate the PCED air transportation index though they can differ.
(2) NFIB survey. Small business owners continued to cheer Trump's election victory. December's optimism index reached its highest reading since October 2018 (chart). The two-month jump exceeds the comparable euphoria following his 2016 victory.
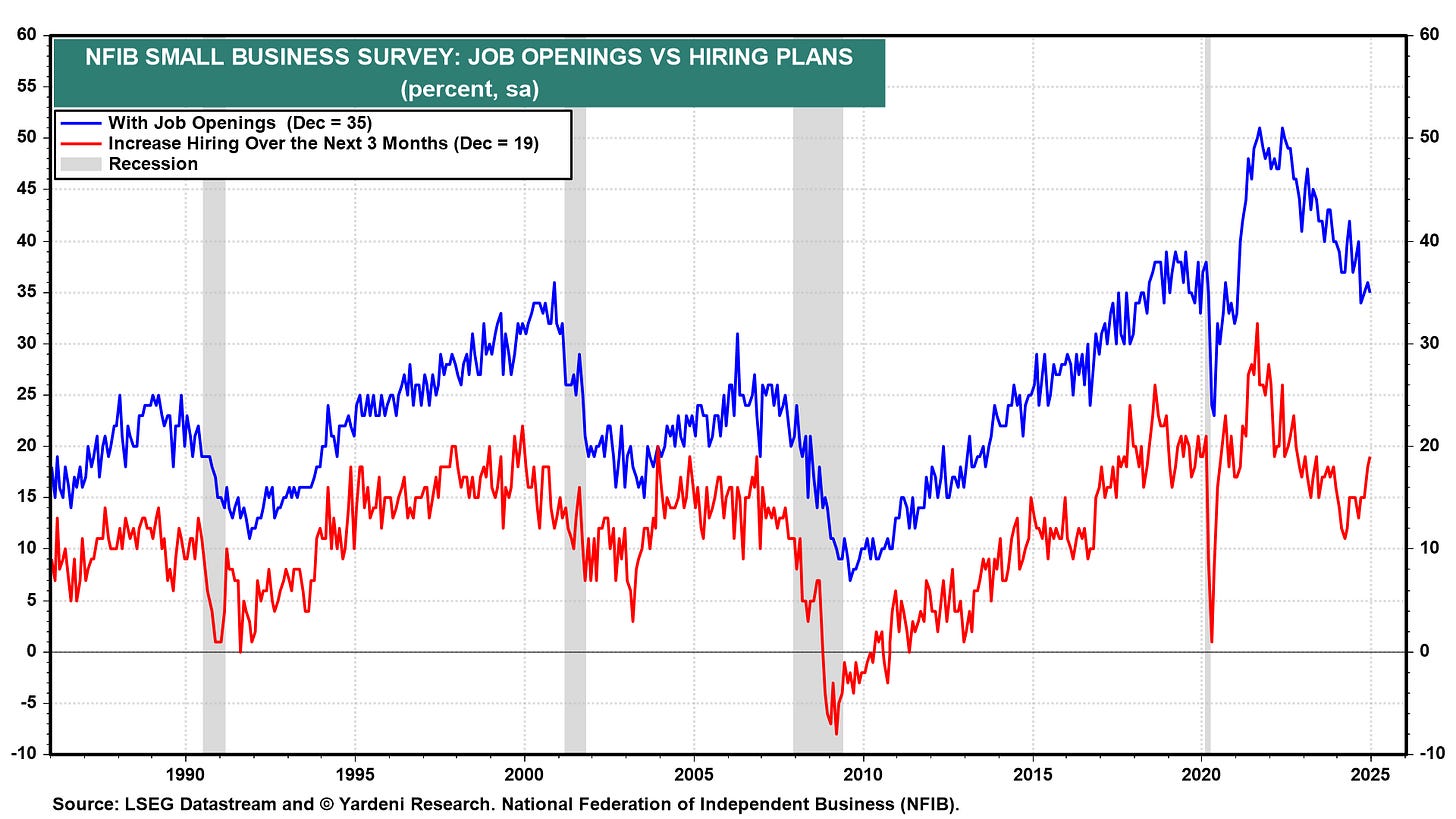
This optimism is reflected in increased plans to hire new workers, expand business operations, and raise wages (chart). While that's another good sign for the labor market and economy broadly, it likely added to the bond market's angst.
(3) Federal deficit…
… And from the Global Wall Street inbox TO the WWW … a few curated links …
What better way to start THIS part of the journey than with a look at DEMAND for USTs …
Apollo: Strong Foreign Demand for US Treasuries
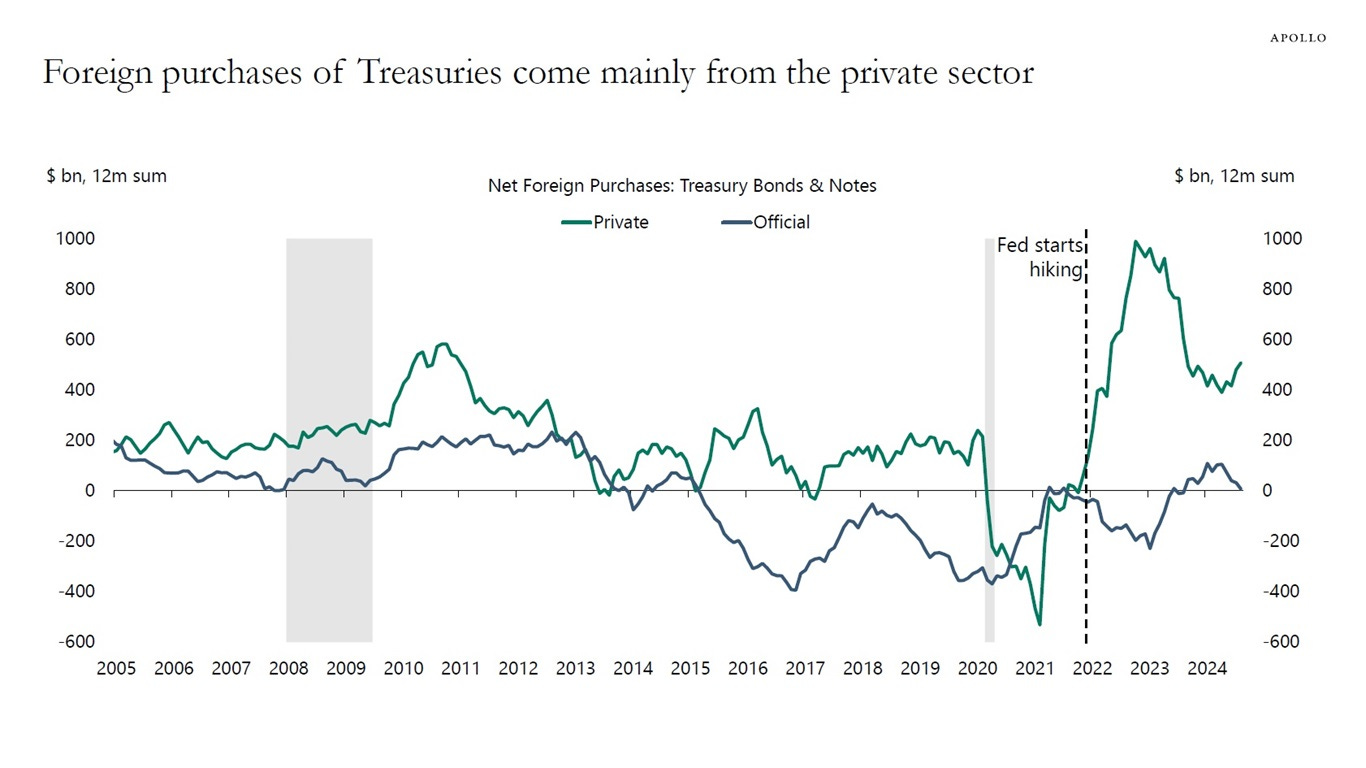
When the Fed started raising interest rates in March 2022, foreign private investors started buying a lot more Treasuries because they liked the higher level of yields, see the first chart below.
Japan is the biggest foreign holder of US Treasuries. With rates higher for longer, the latest data shows continued strong demand from Japan.
Our updated chart book looking at Japanese demand for US Treasuries is available here.
PRIVATE demand is good demand as that sort of capital can / will go anywhere on a moments notice if compensated … Moving along and TO POSITIONS matter and no one better than EBB …
Bloomberg: Bond Traders Wager Slump Set to Ease With Key CPI Data Ahead
Options bet eyes US 10-year falling toward 4.6% within weeks
JPMorgan client survey shows largest long bias since 2023
Some bond traders are betting that the relentless selloff in Treasuries will soon lose momentum, in part because of questions around how President-elect Donald Trump’s policies will take shape.
Traders have been adding options wagers that yields will retreat from the 14-month highs reached in the wake of Friday’s robust US jobs report, which dashed expectations for further Federal Reserve interest-rate cuts any time soon. One stand-out trade Tuesday, costing a premium of more than $40 million, targeted a drop in 10-year yields to 4.6% by Feb. 21, from roughly 4.8% now.
Wednesday brings the next pivotal data point, with the release of the latest consumer-price figures, which are forecast to show inflation remains sticky. Bonds have been slumping since early December, driving the 10-year yield up from around 4.15%, on signs of a resilient economy and speculation that Trump’s proposals will spur even quicker growth. There’s also concern that his tariff plans will reignite inflation.
However, a report Monday that his administration may implement tariffs gradually signaled the potential for a reduced inflationary impact, giving Treasuries a brief boost. The report drove home how much uncertainty there is around the policy mix investors will face under Trump. Bonds also drew fleeting support on Tuesday from a cooler-than-projected report on producer prices…
In a sign of increasing bullishness in the cash market, JPMorgan Chase & Co.’s latest client survey showed long positions increasing to the biggest in over a year, while short positions dwindled.
Meanwhile, in options linked to the Secured Overnight Financing Rate — which closely tracks the Fed’s expected policy path — some traders have started to position for a more dovish outlook than the current market consensus. The swaps market is pricing in just one more quarter-point of easing for the current policy cycle, but trades this week have targeted at least two more cuts this year.
Here’s a rundown of the latest positioning indicators across the rates market …
Here’s a few words from the very next up and coming Lacy Hunt …
EPB: Stock Prices As A Leading Indicator? Not Anymore.
Stock prices have long been deemed a Leading Indicator of the economy and are still in popular indexes such as the Conference Board Leading Index.
However, the relationship between stock prices, earnings, and real economic conditions has changed over the last several decades.
In this post, we’ll highlight the changes in these relationships and underscore a better leading alternative for the economy, earnings, and potential declines in share prices…
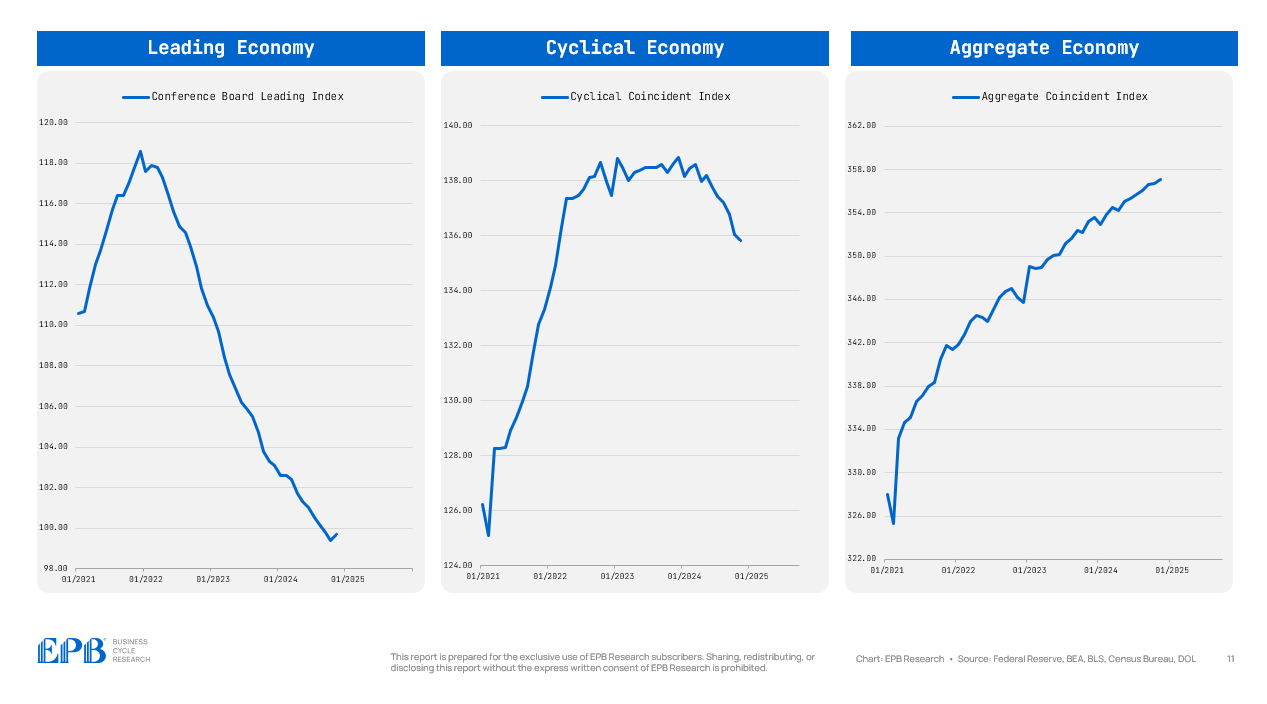
… Changes in the Cyclical Economy (construction and manufacturing) are always first to respond to changes in the Leading Economy or monetary policy conditions.
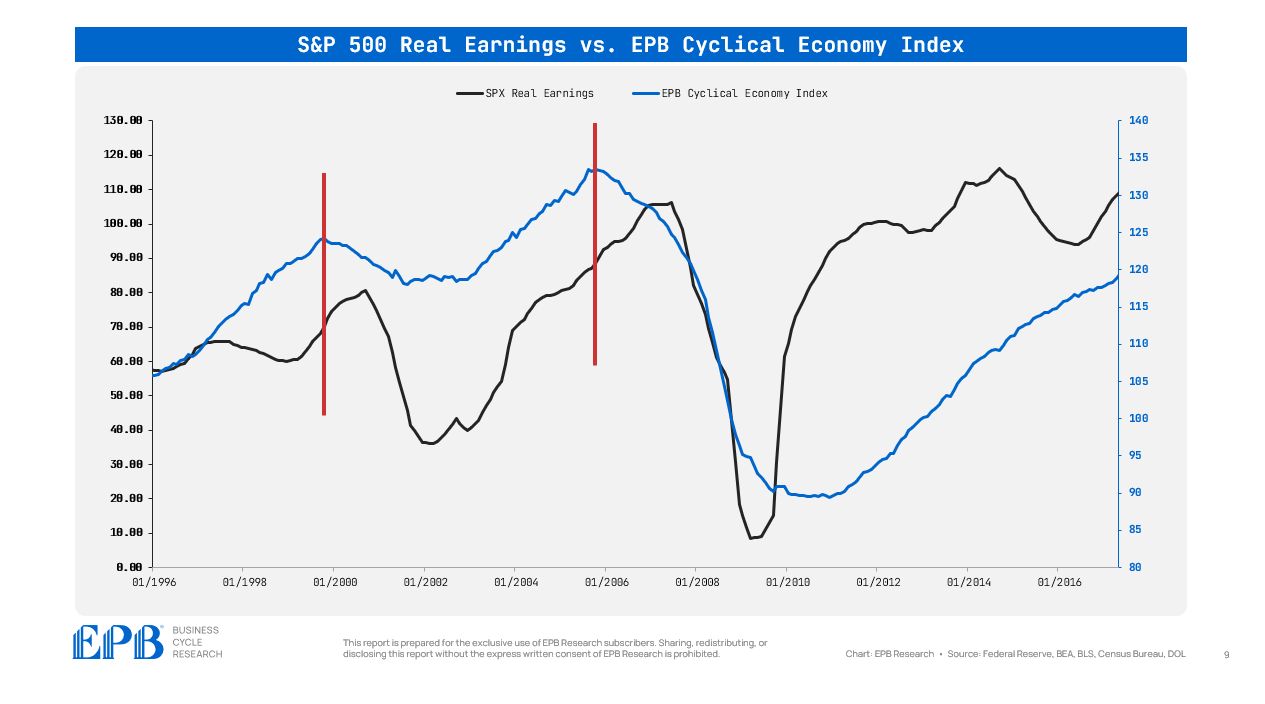
In the chart below, it’s clear how the Cyclical Economy Index of construction and manufacturing turned down far in advance of S&P 500 real earnings in the last two Business Cycle recessions of 2001 and 2008.
Changes in the Cyclical Economy lead to changes in earnings, which, lately, have led declines share prices.
Therefore, it is clear that the most important part of the economy to track is the Cyclical Economy or the construction and manufacturing sectors.
Tracking the Cyclical Economy and this Four Economies Framework is something that we do each month in the EPB Business Cycle Trends Report.
Of course, as the saying goes, there are long and variables lags between each Economy or each bucket of economic data.
On average, a 6-8 month time gap exists between each economic bucket, but these averages have variables ranges. For example, in the 2008 recession, the Leading Economy and the Cyclical Economy peaked around the same time, in the summer of 2006. This was about 1.5 years before the onset of the Aggregate Economy recession.
In the 2001 recession, the lead time of the Cyclical Economy peak to the Aggregate Economy peak was shorter than a year.
In this cycle, the time delay between the peak in the Leading Index was almost two years ahead of the Cyclical Economy due to a variety of pandemic-related factors.
Still, despite popular talking points, the Sequence of the cycle remained the same as it has in every Business Cycle.
In summary, stock prices, particularly the price of the major indexes like the S&P 500, are objectively poor leading indicators of the economy and earnings in the modern era.
However, changes in growth and employment of the most cyclical sectors remain a key warning sign of changes in earnings and broader economic activity.
Despite the shrinking relative size, don’t lose sight of the Cyclical Economy.
Technicals from Chris Kimble ALWAYS worth a look, even more so when he focuses in on USTs …
Kimble: 30-Year Treasury Bond Yields Targeting 6.5% or Higher?
In just 4 years, the trend (and investment theme) of low interest rates has been turned on its head.
During this time, home and auto loan rates have gone from consumer-friendly to unfriendly.
Quite frankly, whether you look at the 10-year or 30-year treasury bond yield, both are rising. Today we look at the latter.
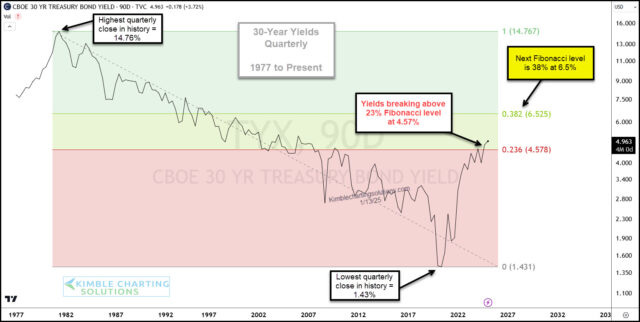
Above is a long-term “quarterly” chart of the 30-year Treasury Bond Yield. Using applied Fibonacci, we can see that the 30-year yield spent nearly two years testing the 23% Fibonacci level.
This quarter yields are attempting to breakout above the 23% level. The next upside Fib level comes into play at 6.5%. That’s not what consumers, businesses or economists want to hear.
In my humble opinion, this is a very important chart to be mindful of. Let’s see how yields close this quarter. Stay tuned!
Finally, wedged inbetween ‘good’ (less bad) PPI and whatever today’s number brings …
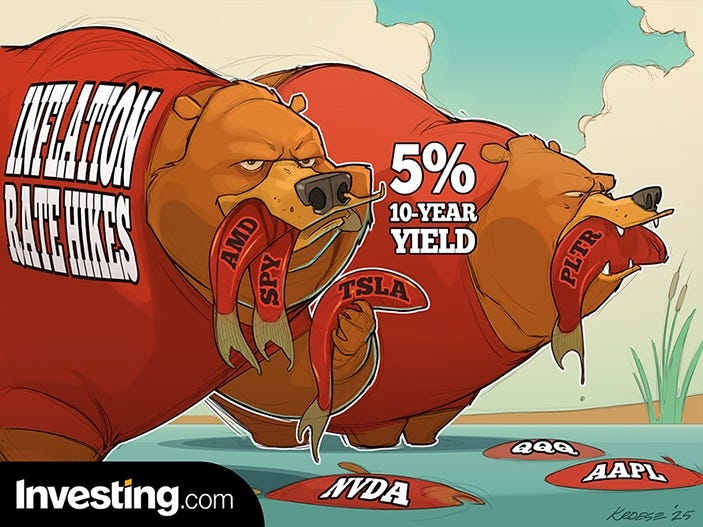
The Bears Are Back As Bond Yields Surge And Tech Shares Sink To Start 2025!
… THAT is all for now. Off to the day job…


