while WE slept: USTs bid, follow EZ; 'Macro HFs turned long on USTs while fund flows into bonds outpacing equity flows recently…'; "T-bill and chill" NOT such a no-brainer anymore...
Good morning … catching up through the inbox and before I jump in a quick look at this afternoons $44bb 7yr auction …
7yy: at home on the range — 3.80 - 3.55
… note ‘red line’ in effort to highlight somewhat bearishly leaning momentum which, if actually worked out, might mean a ‘concession’ for this afternoons liquidity event …
… And now a quick walk down memory lane since I was out yest (Wed) and we got an outstanding 2yr followed by a somewhat less outstanding 5yr…
ZH: Solid 2Y Treasury Auction Prices At Lowest Yield In Two Years
ZH: Yields Hit Session High After 5Y Auction Tails
… and as yesterdays dust settled with bonds and supply an afterthought …
ZH: Big-Tech, Bullion, & Bitcoin Battered Before NVDA's Big Night
… as if ANY of that mattered as much as NVDA and so …
ZH: NVDA Dumps After Smashing Q2 Expectations But Guidance Is A "Mixed Bag"
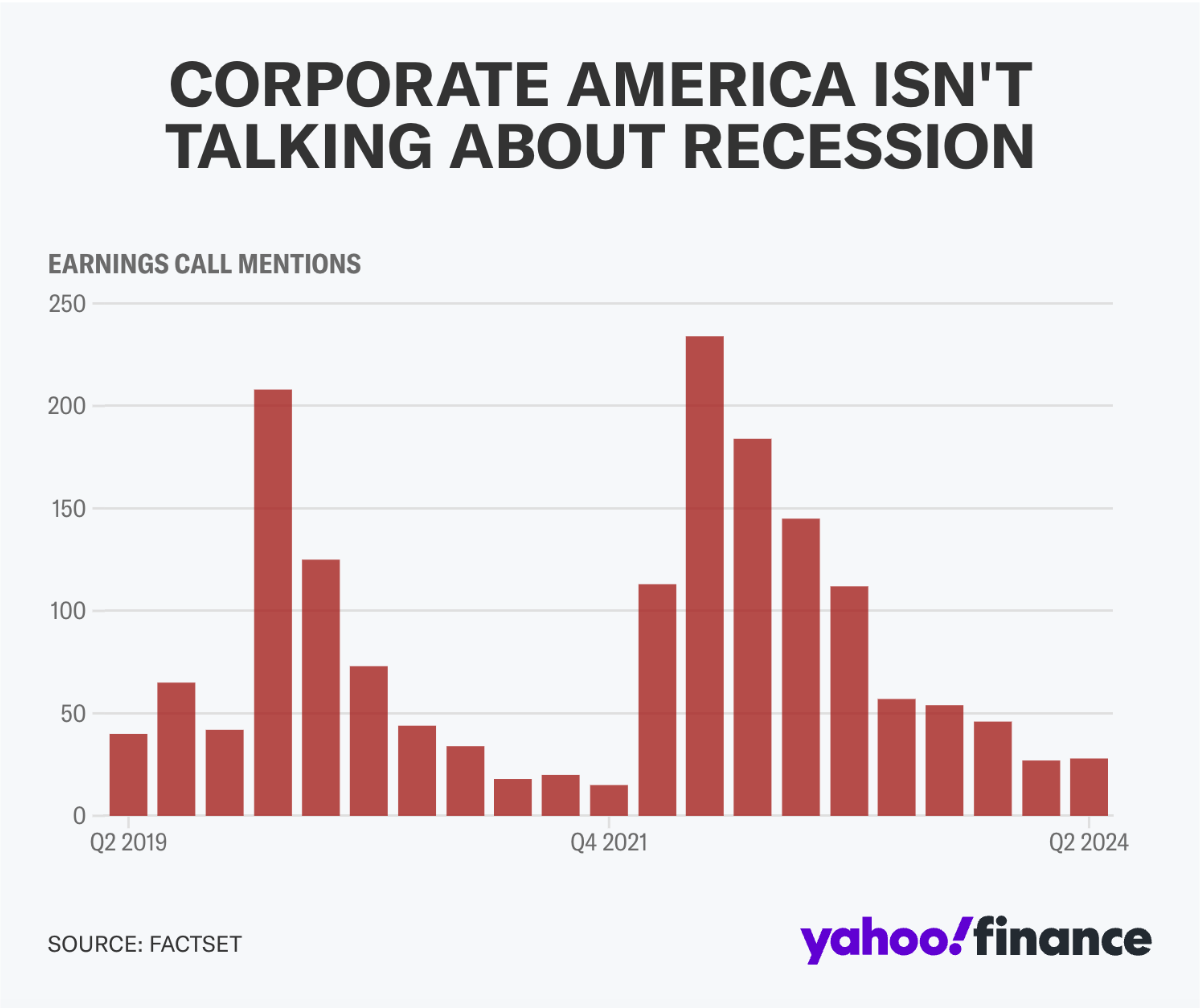
… and finally, a visual / thought via Yahoo as we prepare for holiday long weekend and, more importantly, the oncoming economic calamity which then requires many rate cuts …
… But as many economists will tell you, the US isn't and hasn't been in recession.
The creators of all these measures say this time may be different — their indicators could be, and have been, showing false positives. And the notable distortions to economic data from a global pandemic have unquestionably made the prediction business harder.
But the latest failures also reveal a harsh truth about the recession prediction game: Recession indicators aren't perfect, and they likely never will be.
Just ask one of the most prominent recession indicator creators.
"The economy is so complex that ... it's unlikely that we get the perfect indicator," Duke University professor and Canadian economist Campbell Harvey, who invented the inverted yield curve indicator, told Yahoo Finance.
The benefits of predicting a recession vary. For investors, there is an obvious reason. Making a call for an economic downturn that others don't see could produce a pretty sweet payoff. Just ask Michael Burry of "Big Short" fame, who made an estimated $100 million betting against the US housing market in 2007.
But most of us seem to be searching for something finite in the world of economics, which rarely is.
"It's really hard to read the economy right now," said Claudia Sahm, who worked as an economist for the Fed and now serves as the chief economist at New Century Advisors…
… AND with that in mind and lots more catching up to do … here is a snapshot OF USTs as of 635a:
… and for some MORE of the news you might be able to use…
IGMs Press Picks: August 29 2024
NEWSQUAWK: US Market Open: NVDA -1.8% pre-market, USD gains & EUR hampered by German State CPIs … Bonds have been lifted after the cool German State CPIs vs mainland expectations … USTs are benefitting from the EGB move but to a much lesser extent as the region awaits Friday's key monthly PCE metrics (Q2 figures, 2nd GDP read and 7yr supply due today). USTs at the top-end of 114-00+ to 114-07 parameters and just shy of Wednesday's 114-09 best.
Reuters Morning Bid:Nvidia 'beats' as expected, but fallout limited
Finviz (for everything else I might have overlooked …)
Moving from some of the news to some of THE VIEWS you might be able to use… here’s SOME of what Global Wall St (WAS and) is sayin’ as I catch back up, digging through the inbox hopefully NOT missing anything too terribly important …
ABNAmro Global Monthly | 28 August 2024
What Trump tariffs would mean for Europe
Despite the rise of Harris in the polls, a Trump victory in the November election is still essentially 50-50
Trump’s most economically consequential plan is for a 10% universal tariff on all US imports
Eurozone industry is already struggling to recover from recent shocks. Tariffs would cause a collapse in exports to the US, with trade-oriented Germany and the Netherlands likely to be particularly hard hit
The policy would also drive a significant divergence in Fed & ECB monetary policy, weighing on the euro
In a scenario where the EU negotiates a European exemption, the eurozone will still see an initial hit to growth, but might ultimately benefit from the diversion of US trade from tariff-hit countries
Regional updates: Services is still driving the Eurozone recovery for the time being, while in the Netherlands, disinflation is taking longer due to rising rents and strong wage growth
In the US, with the economy softly landing, the Fed is ready to start easing
Trump also has tariff plans for China, but as before, diversion tactics are likely to mitigate the effects
… US: Fasten your seatbelt, prepare for landing
The Fed is ready to start the easing cycle
The economy is still resilient, allowing for data-dependent and steady rate cuts
We therefore expect a 25bps cut in September
…To summarize, putting on your seatbelt is just common sense, even mandatory, regardless of whether you expect a soft landing. The landing will be bumpy, with volatility in monthly data releases, base effects in y/y inflation, and markets reacting strongly to incoming data. Helped by the economic tailwind, the Fed will gradually ease off the brake with inflation reaching target, growth weakening a bit, but averting a recession.
BAML:Private pension fund rebalancing update
Rough estimate for direction of rebalancing needs
… With the S&P total return in the month to date at c.+2.2%, the 10-year+ UST index c.+3.6% total return over the same period, and corporates c.+2.2%, the expectation is for rebalancing flows out of USTs and into equities and other FI assets …
… n our framework (see below), we see modest c.$2.5bn of rebalancing flows into equities (the standard deviation of monthly equity rebalancing flows over the last three years is c.$20bn, so this is a c.+0.1σ rebalancing month). In the FI space, the flows break down as c.-$5.5bn out of Treasuries (a c.-0.6σ rebalancing flow), c.$1bn into Corporates, c.$2bn into Agency and GSE-backed securities, and unchanged Mortgages.
BARCAP: Atlanta Fed wage tracker: Return of the track
July's resumption of the Atlanta Fed wage tracker shows steady deceleration of the unsmoothed measure from Apr-Jul, in line with the general wage developments during its hiatus. Our state-space model, which draws signals about underlying wage growth from various indicators, shows further gradual deceleration.
BARCAP: Who Owns What - Dip buying and rotation
CTA selling prompted real money to buy the dip. Bonds are well bid, yet equity flows remain backed by resilient earnings/labour market, and now Fed put. Internals show Momentum unwind & rotation to laggards/Defensives. Retail is very long Tech, but HFs have cut. NVDA results, payrolls and US politics are the next catalysts.
… Bonds demand edges equities. Money market inflows saw a pickup this month, as volatility surged, but may be short-lived provided rate cuts and soft landing become a reality. Bonds have actually been the key beneficiary of flows recently, as growth concerns overtake inflation worries, and rate cuts come into view. CTAs are now long bonds, and the fund flows gap of bonds vs. equities keeps widening. History shows that equity flows are typically muted going into US elections (and current polls are very tight), while September seasonality is negative. Still, recent stabilisation in EPS revisions should backstop equity flows, and, unless employment data sees a collapse, we believe that high allocation to equities is unlikely to be cut, while the Fed put is back on. So upcoming payrolls will be key, as any bad data that fuels more recession fears would arguably be bad for equities and good for bonds, and vice versa.
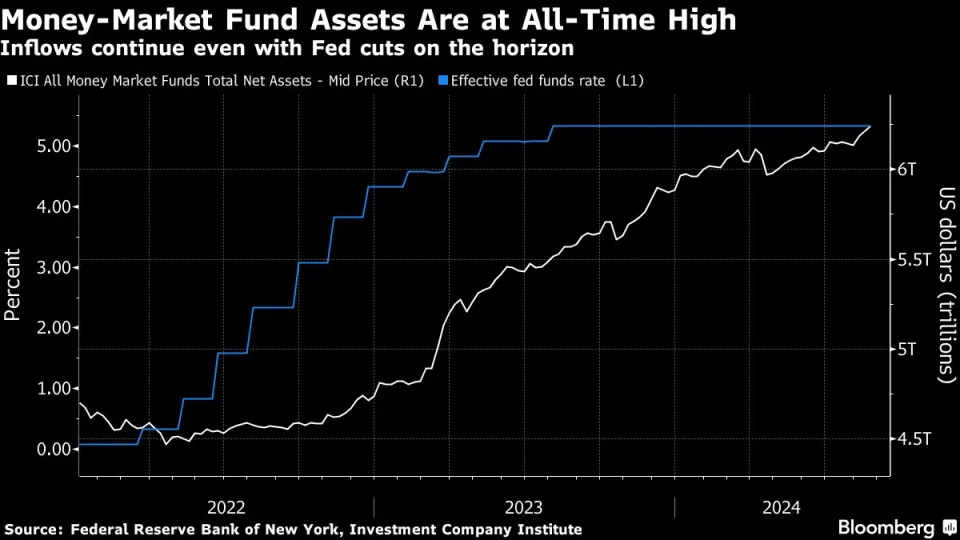
…Uptick in MM fund flows likely to be short lived
Money market funds were in demand in August, as the initial risk-off backdrop prompted a flight to safety and capital preservation. Indeed, flows into MM funds were at their highest levels since Nov' 23. However, as data through the month turned increasingly better, fears of an imminent recession eased. The tone from Fed speakers at Jackson Hole pointed to an easing cycle beginning sooner, boosting the chances of a soft landing further. In such a scenario, the uptick in inflows to cash is unlikely to be sustained, in our view.Bonds demand edges higher than equities
Markets have been aggressive in pricing rate cuts by the DM central banks recently (despite some improvement of late), helping bonds to perform well against equities for the second month in a row. Clearly, inflation concerns are no longer the headwind they used to be for bonds. Indeed, TIPS funds continued to see outflows, with breakeven rates trending lower.…With activity data undergoing a soft patch in the US, the Fed has confirmed that it is about to embark on an easing cycle as it starts to turn its attention more towards a growth/full employment mandate than a prices mandate. That has boosted the attractiveness of bonds even though the timing and extent of rate cuts remain in question. Macro hedge funds have turned long on treasuries, while fund flows into bonds have been outpacing equity flows recently…
BNP: Front-end center: When does fed funds wake up?
We discuss a variety of indicators the Fed is monitoring closely as we approach “ample” reserves, along with indicators we are observing to identify any warnings signs or obstacles that may disrupt this transition.
Our view is that the EFFR-IORB spread will start to trend higher by year-end/early-2025 and settle at -4bp once the Fed ends its QT program.
A recession or a repo crisis may induce an early revival of the fed funds market while debt ceiling constraints may extend its slumber.
DATATREK: Strange But True Facts, 10 Year Treasuries
… 2: 10-year Treasury yields are declining, but it will take lower real (ex-inflation) rates to keep this momentum going. Inflation expectations are already back to their long run average.
… Topic #1: Consider the following “strange but true” facts:
The price of a barrel of WTI crude is $74 today, the same as April 2006. Over the same period, inflation as measured by the Consumer Price Index has reduced the purchasing power of a dollar by 36 percent.
… 10-year US Treasuries yield 3.8 percent today, the same as in January 1963. US debt was 40 percent of GDP in the 1960s and is 122 pct as of Q1 2024…
… Topic #2: An update on our work deconstructing 10-year Treasury yields into their 2 primary components: expectations for future inflation and real (ex-inflation) interest rates.
This first chart shows inflation expectations embedded in 10-year yields from 2003 to the present, which currently stand at 2.13 percent, very close to their long-run average of 2.09 pct. As noted in the graph, these tend to reach very low levels during crises (0.1 pct in November 2008, 0.5 pct in March 2020). Their all-time highs were in April 2022 (2.98 pct) during that year’s peak inflation readings, but they have been retreating since.
This next chart shows real rates, which are the yields you see on the screen minus inflation expectations. Currently, they are 1.76 percent. Since the Fed pushed real rates below zero in 2012 – 2013 and again in 2020 – 2022 with its bond buying programs (quantitative easing), we have calculated the average of all positive real yields over this period. That number is 1.25 percent.
Takeaway: If 10-year Treasury yields are to decline much further, that will require real interest rates to continue moving lower, because inflation expectations are already back to their long run mean. Our own view is that this will happen over the next 6-12 months as the Fed reduces interest rates and inflation continues to moderate. That will show markets that the neutral rate of interest is still somewhere between 1.0 and 1.5 percent (average of 1.25, as noted above), just as it has been for much of the last +20 years. I (Nick) own the TLT ETF (iShares 20+ Year Treasury) and the IEF ETF (iShares 7-10 Year Treasury) and expect both to do well over the coming year.
DB: Early Morning Reid (recap of the NVDA and mkts reflex)
As we go to press this morning, the main market focus is on Nvidia’s latest results, which came out after the US close last night. Although the results slightly beat expectations, their share price was down around -7% in after-hours trading, partly because it fell short of some estimates that had been looking for an even stronger release. For instance, the revenue outperformance was the smallest relative to expectations in six quarters, so this wasn’t the sort of massive beat that Nvidia has often reported over the last 18 months. At the same time, the Q3 revenue guidance came in a touch above the average estimate ($32.5bn vs $31.9bn est.) but still well within the range of analysts’ views. So there’s been a pullback overnight, and that decline in after-hours trading has built on the -2.10% decline in yesterday’s session. In turn, US equity futures are lower more broadly this morning, with those on the S&P 500 (-0.33%) and the NASDAQ 100 (-0.64%) both falling back…
… Whilst equities were losing ground, US Treasuries put in a pretty subdued performance, with the main theme being an ongoing curve steepening. While there was little data or commentary from Fed officials, the 2yr yield still fell by -3.4bps to 3.87%, its lowest closing level since May 2023. By contrast, the 10yr yield was up +1.3bps to 3.84% and the 2s10s slope ended the session at -3.4bps, only a basis point from its 2-year high on August 7. Meanwhile, we got more indication that the prospect of rate cuts was filtering through to the real economy. Specifically, data from the Mortgage Bankers Association showed that the contract rate on a 30yr mortgage was down to 6.44%, the lowest since April 2023. Bear in mind that investors are still pricing in rapid rate cuts over the months ahead, with over 100bps priced in by the December meeting. This pricing was little changed despite somewhat hawkish comments from Atlanta Fed’s Bostic later on, who said that it “may be time” to cut but that he still wanted to see additional data to support a September cut.
Today, we should start to get some more data that will help to shape investors’ views. In particular, there’s the weekly initial jobless claims out of the US, which will offer a timely indicator on the state of the labour market. We’ll also get the second estimate of Q2 GDP, and although that’s a backward-looking reading, that will include the latest revisions to core PCE inflation in Q2. Any revisions to that would add to the uncertainty when it comes to tomorrow’s core PCE print for July, so that could have implications for the 25bps vs 50bps debate depending how that looks. As of this morning, futures are placing a 35% probability on a 50bp rate cut in September, so the view remains that 25 is more likely. But it’s far from a done deal, and we’ve still got both the jobs report and CPI release for August before that meeting, so plenty of time for that to shift around still…
DB: A brief history of the 50s
… As of this writing, the market is pricing just shy of 100bp of cuts through year-end, implying a 50bp move at one of the next three meetings.
For perspective on this, today’s CoTD shows the history of Fed target rate adjustments over the past thirty years, a period that corresponds to the modern approach to policy and communications (e.g., consultation of policy rules, announcement of rate decisions in post-meeting statements). The blue bars indicate moves at scheduled FOMC meetings, the red bars are moves at unscheduled meetings, and the grey lines denote the timing of all unscheduled meetings, calls, and votes (which often have not resulted in a policy rate change).
The main thing that jumps out in the context of speculation around a 50bp move ahead is that the modern Fed has never begun a rate cycle with a cut that big unless it came at an unscheduled meeting or was preceded by one…
DB: $HY: Anti-Recession Signals? (not another - spreads are low=NO recession call - a good read IMO)
… But what are $HY bond markets telling us about the likelihood of a near-term recession? We analyze three indicators below that have proven to be a good leading signal of future credit stress, future S&P 500 weakness, and ultimately weaker economic growth.
1) $CCC Spreads: $CCC bonds are the most vulnerable to default, given very high leverage and weak free-cash-flow generation. But $CCC spreads have tightened 40bps since August 1, and are near 3yr lows (Fig 1), supported by hopes of a meaningful Fed cutting cycle. This performance remains consistent with our view that US spec-grade default rates will slowly decline through Q2'25 and with our preferred portfolio expression to overweight a barbell of $BBs & $CCCs over $Bs.
2) $HY Funding Costs: $HY funding costs generally rise before a recession begins, using 1990, 2001 & 2008 as prime examples (Fig 2). Today, $HY funding costs are falling, with market yields having declined nearly 100bps from mid-April to 7.3% today. This easing of financial conditions for leveraged companies is highly inconsistent with a near-term downturn.
3) $HY Total Returns: Similar to 2) above, negative $HY total returns on a trailing 12m basis generally signal major weakness in the S&P 500 and ultimately the US economy ahead (Fig 3). But trailing $HY returns are becoming more positive in recent months.
Simply put, there is little recession signal coming from $HY credit. And post Jackson Hole, the presence of an effective Fed put is likely to keep credit concerns at bay. Hence, the more probable risk for investors is an increase in $HY funding costs first led by higher Treasury yields, not wider spreads. However, that view will take time to materalize, after a few Fed cuts release pent-up animal spirits first.
Gavekal: The Downside Of Rate Cuts (a visual worth a 1000 words, they say and so…)
… With debt liabilities at big US companies typically long term and fixed rate, the increase in interest income saw USA Inc’s total net interest expenses plunge. This had a big impact on corporate profits; the entire increase in US nonfinancial corporate profits since 2022 can be attributed to the fall in net interest payments (see the upper chart overleaf).
The near-term drag on corporate profits could discourage capital spending, which would have a dampening effect on US economic growth, at least before the lagged boost to aggregate demand kicks in. In the short term, then, rate cuts could weigh on large-cap US equities relative to bonds.
This effect is likely to outweigh any beneficial relative valuation impact. In 2022, when the Fed began hiking, US equities fell as fixed income yields rose. So shouldn’t equities benefit when yields fall? The answer is probably not. The starting point for relative valuation is different.
In 2022, US stocks were as expensive on a risk-adjusted basis as US bonds. Therefore, when bond yields rose, there was considerable pressure for equity earnings yields also to rise to keep pace. Today after the run-up in stocks, risk-adjusted US equity earnings yields are low relative to bond yields (see the chart below). It would take deep rate cuts to push bond yields down to the point where bonds become unattractive relative to equities. In short, US equity valuations have little room to benefit from interest rate cuts.
UBS: The (dis) inflation cycle starts again
The cycle of European consumer price inflation data is about to start again (in reality, this is pretty much a perpetual cycle). The Spanish and German preliminary August numbers are due today. Both are expected to show a fairly sizable decline. That means, of course, that real interest rates are rising. The ECB should continue to chase inflation down, not to offer policy stimulus but to maintain policy stability.
Revised second quarter GDP from the US is not expected to show anything too exciting—and these numbers will be revised a lot in the future. Investors tend not to pay too much attention to revisions. It makes no difference to consumers, who experienced the second quarter they experienced, not the second quarter that the Bureau for Economic Analysis reported.
There will also be revisions to the price deflators within the GDP data, but markets are set in their views that the Federal Reserve will be cutting rates in September. The Fed’s Bostic was trying to sound a bit hawkish yesterday, but it is a futile gesture.
Despite some more meaningful macro data, markets are still focusing on earnings data—although market moves say more about the levels of expectations than about corporate signals of economic health.
Wells Fargo: Consumers More Confident in August, But Still Worried About the Jobs Market
Consumer confidence improved in August, yet confidence remains within a narrow range and well below pre-pandemic levels. Views on the labor market remain depressed, holding back overall optimism.
… And from Global Wall Street inbox TO the WWW,
Apollo: 10 Facts about the US Treasury Market (#8 concerning to anyone?)
Bloomberg: ‘T-Bill and Chill’ Is a Hard Habit for Investors to Break
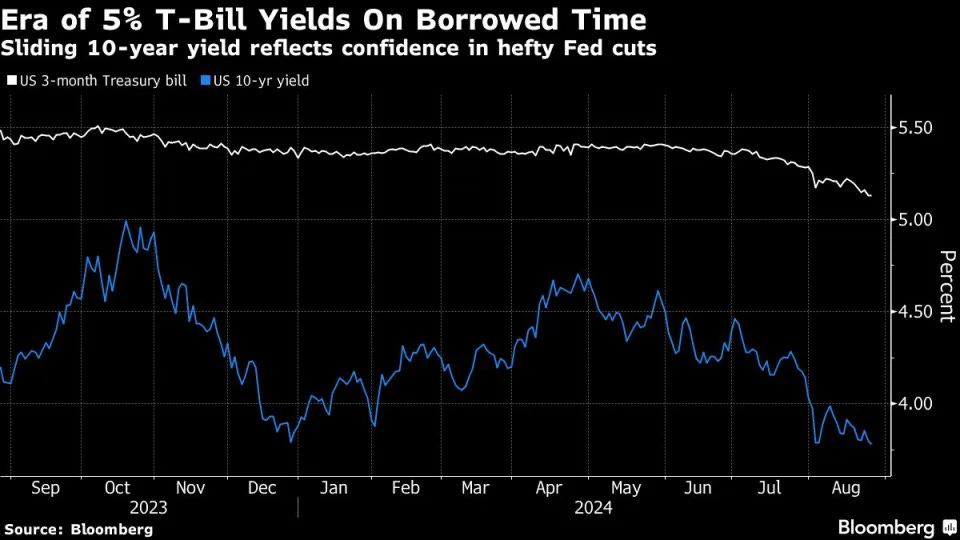
It’s been the ultimate no-brainer for more than a year: Park your money in super-safe Treasury bills, earn yields of more than 5%, rinse and repeat. Or as billionaire bond investor Jeffrey Gundlach put it last October, “T-bill and chill.”
… “Logically speaking, it doesn’t make a whole lot of sense for $6 trillion-plus to be sitting in money market funds if the yield is going to go down,” Kathy Jones, chief fixed-income strategist at Charles Schwab & Co. “We had a lot of talk about rate cuts and they haven’t happened, so there may be a lot of people who are just actually waiting to see it happen.”
… “For the first time in recent memory, cash is actually offering some yield and I can understand why people are sort of gravitating to that,” said John Queen, a portfolio manager at Capital Group, which oversees $2.5 trillion in assets. However well that’s worked recently, Queen recommends a classic strategy of diversification, investing in a mix of cash, equities and fixed income.
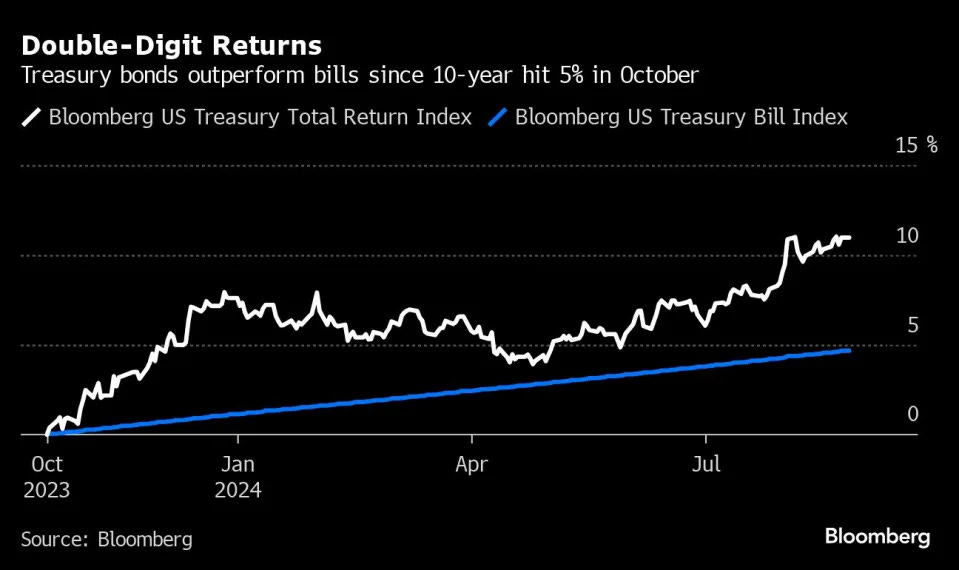
… The lost opportunity for cash investors is that unlike bills, bonds generate capital gains from price appreciation as interest rates decline.
… As cash-equivalent rates start moving down — and by all estimates they will — “T-bill and chill” won’t be such a no-brainer anymore.
“Once investors look at what they’re getting, they’ll decide where they are isn’t that attractive anymore,” said Schwab’s Jones.
Bloomberg: When 50% margins no longer impress, you're Nvidia (Authers’ OpED)
AI frenzy may have finally peaked, making ever rising profitability unrealistic. Also: Berkshire joins the $1 trillion club.
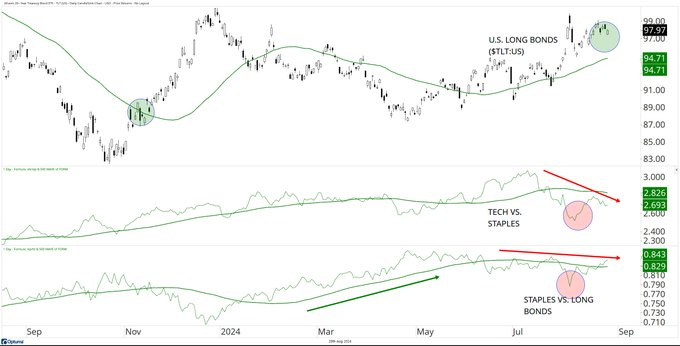
at DavidCoxRJ
we can all see that the right edge of the $TLT chart is in an uptrend...
we can all also see that technology $XLK vs. staples $XLP is in a downtrend and yet those staples, too, are in a downtrend vs. the long bonds...
Takeaway: Bonds are starting to exhibit relative strength while tightening up for a potential breakout. The Treasury Bond ETF ($TLT) is coiled beneath resistance ($100), suggesting a potential breakout in the coming days.
ING Rates Spark: Steadier, but big moves coming
A reasonable US 5yr auction further validates the Fed rate cut discount. Initiation of cuts will bring the 10yr rate down further. We identify more room for higher 10yr rates than lower on a one year horizon. In the eurozone, markets are pricing in a possibility of consecutive ECB cuts after September, but should also be careful not to get ahead of themselves
McClellan Financial: Yield Curve, Unemployment, and Sunspots - Chart In Focus
August 28, 2024
…Another part of that rise is that as the economy slows (pushing up unemployment), companies have less need for capital to invest in expansion of plant and equipment or new hiring. So a reduction in competition for money to borrow means that the price (yield) of that borrowing goes down.
The second big reason for the timing of this change by the Fed is far more fascinating, and will be more difficult to accept for classically trained economists who think that humans and governments are in charge of everything.
The same 10-1 yield spread which correlates really well to the unemployment rate also correlates well to the monthly sunspot count. The key to seeing this, though, is that we have to shift forward the sunspot count data plot by 3 years to see that correlation.
The sunspot count started rising for this cycle in early 2021. So counting forward 3 years takes us to where we are right now in 2024. Past experience suggests that the yield curve should move toward its normal positive relationship, and should keep moving that way until about 3 years after the sunspot cycle reaches its peak, which has not happened yet.
This correlation is not perfect, though, and there have been significant anomalies in the past…
WolfST: Treasury Department Aggressively Pushes Down Long-Term Interest Rates via Shift to T-bill Issuance and Bond Buybacks
But buybacks occur at huge losses for investors. Today it bought back a 1.25% 20-year bond for 66 cents on the dollar.
The US Treasury Department has been doing two major things to aggressively push down long-term yields on US government debt, and thereby long-term interest rates in the economy, such as for corporate bonds and mortgages:
Shifting a larger portion of issuance of new debt to short-term Treasury bills, instead of longer-term notes and bonds, thereby increasing the proportion of T-bills outstanding.
Buying back older longer-term Treasury securities with the proceeds from issuing new Treasury securities, so essentially replacing old securities with new securities, which doesn’t involve money creation and is not QE, but a swap of securities. It does put a big regular buyer into the harder-to-trade end of the bond market.
We can see the effects of those two policies on the 10-year yield. The increased portion of T-bill issuance starting in the second half of 2023 took pressure off the 10-year yield, which had been spiking into October 2023 and briefly kissed 5%. The buybacks, which started in April, coincided with a decline in the 10-year yield of nearly 100 basis points, even as the Fed was pushing back against rate-cut mania.
…. AND in the ‘maybe I should try it’ category …
… THAT is all for now. Off to the day job…






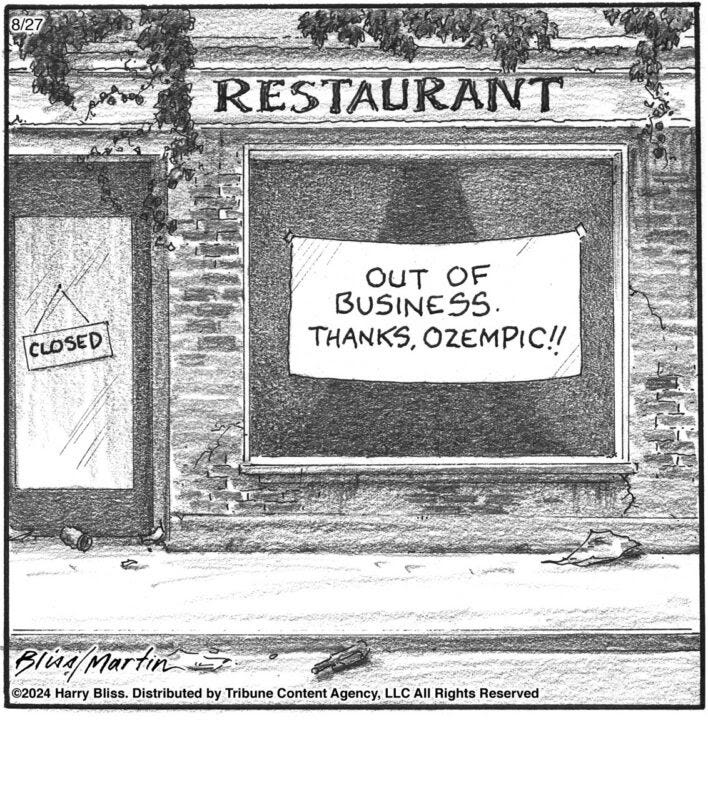
Thoughtful Money just dropped a 100 min Lacy Hunt interview, there goes my afternoon :)! Thanks for always linking his Q reports!