Bloomberg: US and Iran Nearing a Peace Deal Around G7 Meeting Next Week
Bloomberg: SpaceX Shares Indicated More Than 35% Higher on Gray Markets
… AND a few thoughts …
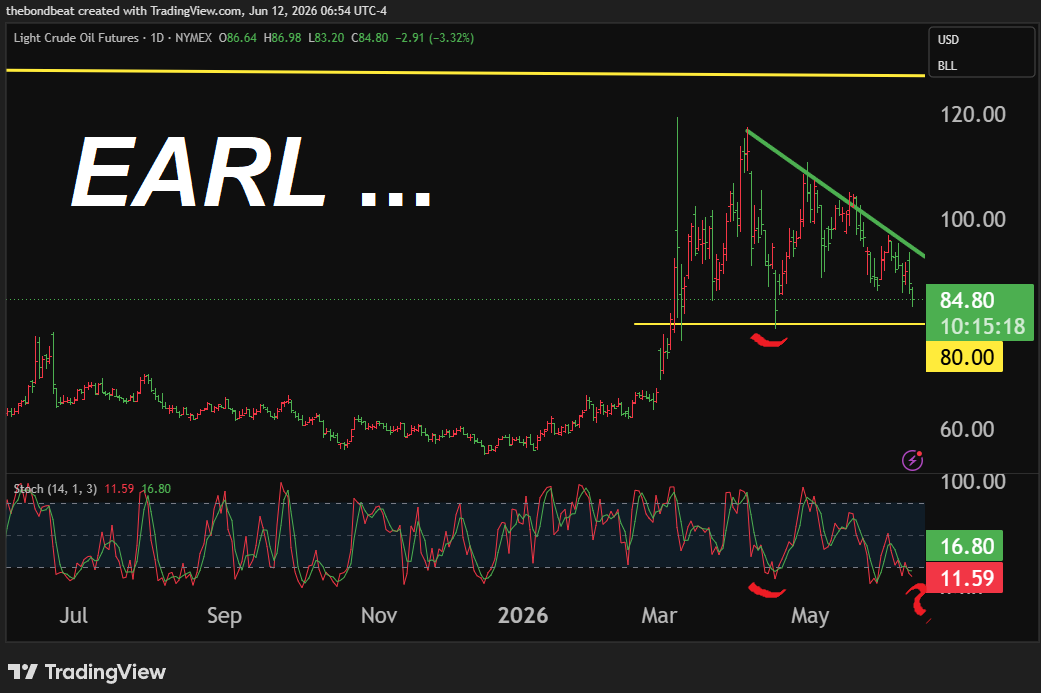
EARL. Some (below) say it’s no longer in control of markets and rates specifically. I’d politely disagree … With that in mind and lacking other inspiration ahead of the SPCX IPO, I’ll lead with a visual from TradingView of CL1 (so please treat this as indication only as real prices out there, well … whatever) …
… as momentum becoming overBOUGHT (so in need of some time at a price?)
#GotEARL? Happy to report the downtrend in place SINCE the Persian Excursion began and you’ll see below, AAA reporting prices at pump following along the downtrend. RELIEF. Now, this all to be taken with a giant grain of salt as we’ve seen over history how it is IRAN plays the DEAL / NO deal game.
Take yesterday, for instance…Persian Excursion on again …
ZH: Trump Says ‘We’ll Bomb The Sh*t Out Of Them’ Tomorrow Too If No Deal, After Dozens Of Tomahawks Hit Iran
… and OFF again …
ZH: Trump: Iran Deal Should Be Done ‘Pretty Quickly’ But ‘Subject To Settling’ Over Next Few Days
… keep in mind these headlines, granted ZH not an actual news organization (so, thats likely good / more reliable, right?), happened in same day …
On heels of this then GOOD (war’s to be OVER) headlines, stocks exploded taking back what was lost Wednesday (and then some).
Timing was perfect as all this good will and SPCX anticipation buried the other news of the day … ECB hiked rates, as expected and is first major CB to do so. Will it once again be policy error (2011)? Only time will tell …
ZH: ECB Hikes Rates For First Time Since 2023 (As Expected); Cuts Growth, Hikes Inflation Outlook
… Again, this news was buried by the IMMINENT IRAN DEAL good vibes which couldn’t have come at a better time. It’s Friday. SPCX to make some waves and as it debuts, a bit of a bounce over IPO price (135) will produce our very first TRILLIONAIRE! What a time to be alive — like or hate him. Understand the biz model or NOT. Lunch ladies and janitors working at SPCX are to benefit (assuming they can cash out in timely fashion — remains to be seen) and at this very moment, well, not sure who really cares about US funDUHmental data yest …
ZH: US Initial Jobless Claims Jump To 4-Month-Highs
ZH: Core Producer Prices Cooler Than Expected In April, Goods Costs Jump Most On Record
WolfST: Producer Price Inflation beyond Energy: 6-Month Services PPI, “Core” Goods PPI & “Core” PPI Blow by 6%, Worst since Mid-2022 - The surge in energy costs is bad, but there's a lot of inflation from other sources.
…. No problem, just force EARL down and build hype in / around largest IPO ever and all was well … I’ll get outta the SPCX way but first, a few words from my BondBot Intern…
🚀 Oil Down, IPOs Up, Delusion at All-Time High
Treasuries are trying to decide whether they’re pricing peace, prosperity, or just another sugar high. Crude is sliding on hopes of an Iran MoU that could cool Middle East tensions and reopen barrels to a market that was pricing apocalypse just days ago. Meanwhile, rates traders are watching inflation breakevens ease while the long end remains stubbornly skeptical of Washington’s fiscal sobriety. Stocks? They’re partying like liquidity never left. SpaceX just pulled off the largest IPO in history, creating thousands of new millionaires and reportedly pushing Elon Musk into trillionaire territory. Add AI mania, falling oil, and a weekend of irrational optimism ahead of the New York Knicks game, and you have the market equivalent of handing tequila to a kindergarten class. Everyone suddenly believes inflation disappears, growth accelerates, and valuations no longer require math. Maybe they're right. Or maybe this is just another late-cycle melt-up where the band plays louder as the iceberg gets bigger. The market is pricing a happy ending—history usually charges extra for that.
… almost WEEKEND. NAZ just announced SPCX to be quoted 950a and begin trading 10a. Good luck out there…
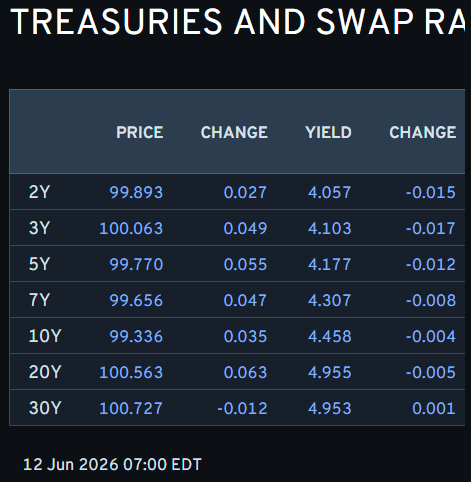
Onwards and upwards TO the reason many / most of you are likely here … whatever it may be on Global Wall’s mind but first … here is a snapshot OF USTs as of 700a:
… for somewhat MORE of the news you might be able to use … a few curated links for your dining and dancing pleasure …
NEWSQUAWK US Market Open: Crude benchmarks hit on Mehr MoU reporting, equities bid into SPCX debut … Fixed income benchmarks benefit from the softer energy prices … USTs (+4+ ticks) gain, and hold at the upper end of a 109-19 to 109-29 range. Action which has been facilitated by the positive geopolitical mood music, but still remains the underperformer vs peers. That can potentially be explained by the ongoing hawkish repricing at the Fed, heading to the Bank’s policy announcement next week. Elsewhere, yields are lower across the curve with underperformance in the short-end/belly; the 10yr currently holds at 4.43%, marking the WTD low. Should the geopolitical environment materially improve in the coming days, and the Strait entirely opens up, the 10yr could dip its head back towards support levels at 4.33% and then 4.25%. Do note that the 10yr resided below the 4.00% mark before the Iran conflict started …
A US-Iran deal, if confirmed, would remove a major macro tail risk and clear the way for further broadening/rotation. This would likely benefit Europe and cyclical laggards the most, particularly the uncrowded consumer plays like Luxury. The World cup could also provide a tactical lift to the space.
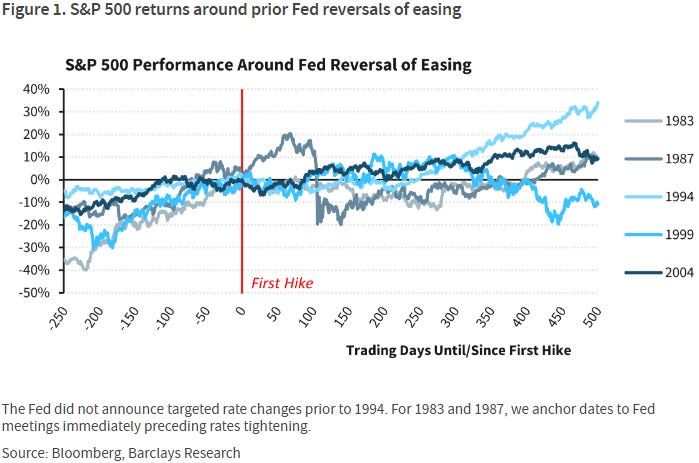
With sticky inflation pulling up calendar targets for the "reversal of easing", we examine SPX returns around similar moves in the past, finding little evidence of headwinds leading into the event but some potential for muted returns in the weeks and months after, if history is any guide.
PEACE PREMIUM …
June 11, 2026 BMO: PPI Highest Since November 2022, PCE Components Stronger
PI came in 0.4 ppt above consensus, printing at +1.1% MoM in May to match April’s release for the largest monthly gain since March 2022. The yearly pace rose to +6.5% vs. +6.4% anticipated and +5.7% prior (revised from +6.0%). This is the fastest pace of headline inflation since November 2022. Core-PPI was softer-than-expected at +0.4% MoM in May vs. +0.5% MoM projected and +1.0% MoM prior was revised to +0.7% MoM. This brings the YoY pace to +4.9% vs. +5.4% forecasted – matching April’s +4.9% print as the highest since January 2023.
As for the PPI components that feed into the PCE, Portfolio Management came in strong at +4.8% MoM vs. -2.3% MoM prior, the largest monthly gain since July 2025. Airfares were -0.5% MoM vs. +2.7% MoM prior. International passenger airfares were +6.3% MoM vs. +2.9% MoM prior (highest since Dec. ‘25). Additionally, the healthcare components were a bit firmer. These details will likely boost consensus May core-PCE estimates to at least a ‘high’ +0.3%…
…Treasuries rallied on Thursday despite a hotter-than-expected PPI report that resulted in upward revisions to May core-PCE forecasts. The bond-bearish implications of the realized inflation data were ultimately overshadowed by the drop in crude oil after President Trump canceled planned airstrikes against Iran and said, “Discussions and final points have been, in both concept and great detail, approved by all parties involved, including the United States, Israel, Saudi Arabia, UAE, Qatar, Turkey, Pakistan, Bahrain, Kuwait, Jordan, Egypt, and others. The Naval Blockade will remain in full force and effect until this Transaction is finalized — Time and place of the signing to be announced shortly.” Note that this list does not include Iran – who has reportedly not approved any outline of an agreement. Nonetheless, the yield curve bull-steepened on the US President’s insistence that a final deal is at hand, and the front-month WTI crude oil contract dropped below $87/bbl. While there still isn’t tangible evidence of a peace deal as the market awaits Iran’s response, the message of de-escalation has been sufficient to get 10-year yields back below 4.50%.
Thursday’s rally in Treasuries began to lose steam once 10-year yields returned to pre-NFP levels from Friday, although we were stopped out for a gain on the remaining portion of our short position in 10-year notes (entered on June 4th at 4.45%) at 4.48%. The 5+ bp drop in 10-year yields that immediately followed Trump’s social media post foreshadows what could ultimately be a much sharper kneejerk decline in nominal rates if and when Iran ultimately agrees to a peace deal. That being said, if the market’s renewed peace deal optimism proves misplaced, 10-year yields would be justified in returning above 4.50%. From a technical perspective, we’ll highlight that initial resistance comes in at the 40-day moving-average of 4.439% before the month-end close from May 29th at 4.436%. Through there is the bottom of June’s yield range at 4.422%, followed by the 50-day moving-average of 4.410%…
Preparing for hikes based on the data …
11 June 2026 DB US Economic Notes - May inflation recap: (CPI-PCE) Wedge-ing the door open for hikes
May’s headline CPI (+0.47% vs. +0.64% in April) was slightly softer than we expected, mostly a function of weaker food inflation. However, core CPI (+0.21% vs. +0.38%) was almost exactly in line with our prediction. The year-over-year rate in the former picked up 40bps to 4.2% while the latter rose a tenth from 2.8% to 2.9%.
Within the basket, there was broad-based weakness in core goods, suggesting tariff effects are waning. However, input costs for goods producers have continued to accelerate, suggesting goods still face upside risks.
Services took a step down as rents mostly normalized from last month’s payback from last October’s missed data collection. Airline fares and delivery services continued to show bleedthrough from higher energy prices.
In terms of the readthrough into core PCE, the CPI data was somewhat positive given weaker core goods data. However, portfolio management and foreign airfares in the PPI more than offset that. We are currently tracking a +0.37% gain in May for the Fed’s preferred inflation measure. This would correspond to 3.44% in year-over-year terms (assuming no revisions), which would be the highest since October 2023.
…the past 24 hours has seen a sharp reversal in the trajectory of the US–Iran conflict, as mounting hopes of a deal have seen Brent crude fall -1.62% overnight, leaving it on track for a 3-month low of $88.80/bbl. So that’s led to a huge rally across bonds and equities, as lower oil prices have eased fears about a prolonged stagflationary shock…
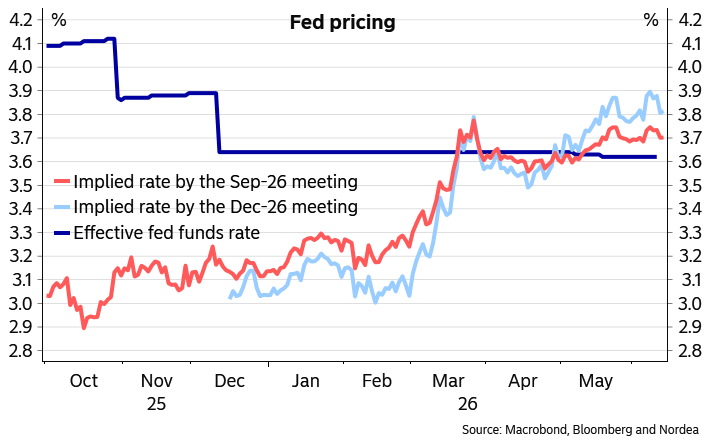
…With oil prices coming down sharply, alongside hopes that the Strait of Hormuz will reopen, that’s seen investors price out the chance of rapid rate hikes this year. Indeed, as we go to press, markets are now pricing in just a 77% chance of a Fed rate hike by December, having been fully priced in earlier this week. In fact, it’s not until the March 2027 meeting that a hike is fully priced in. So that dovish repricing helped US Treasuries to surge, with the 2yr yield (-8.1bps) down to 4.06% by the close, whilst the 10yr yield (-9.1bps) fell to 4.46%…
This monthly chartbook highlights our top charts for understanding the current state of the US economy and the outlook for 2026 and beyond.
This edition features sections focused on: (1) doubts about US disinflation (see Five doubts about the US disinflation story); (2) how the Fed may have become accommodative as cuts left them overinsured against downside risks to the labor market (see Overinsured?); (3) a deep-dive into the effects of AI on the labor market, inflation, and growth (see Tracking the effects of AI on the US labor market); (4) the impact of oil price shocks on the economy; (5) evidence of a stabilizing labor market and risks of reacceleration; and (6) prospects for a high-productivity growth regime.
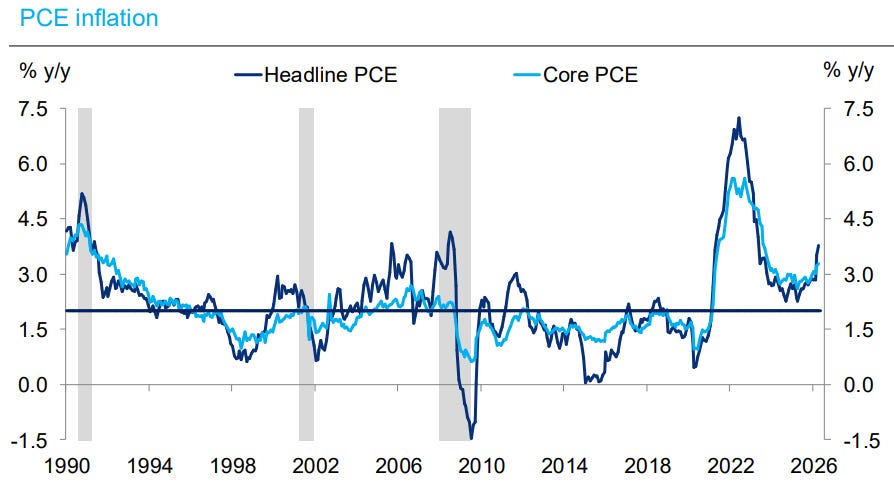
…PCE inflation remains well above the Fed’s 2% target; excluding the Covid period, core PCE highest since 1992
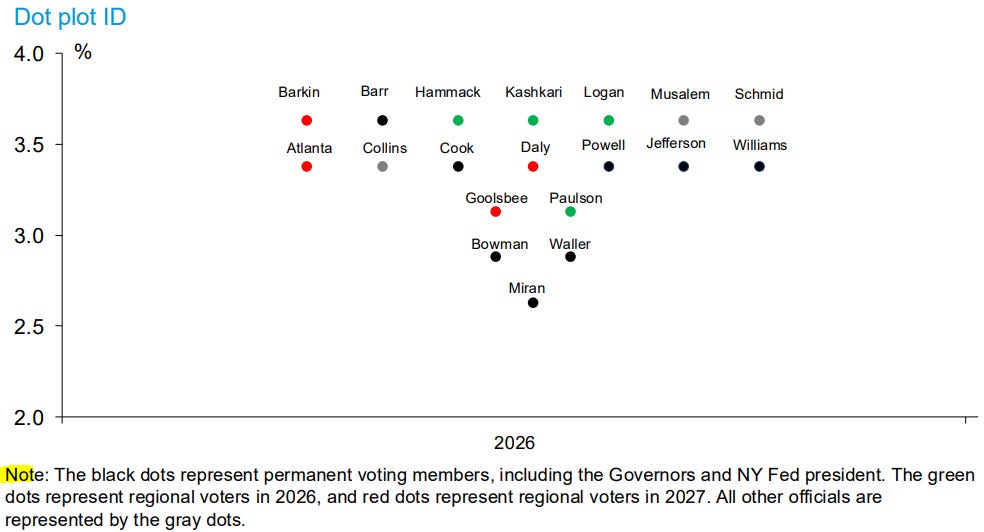
…DB’s identification of the 2026 dots from the March SEP
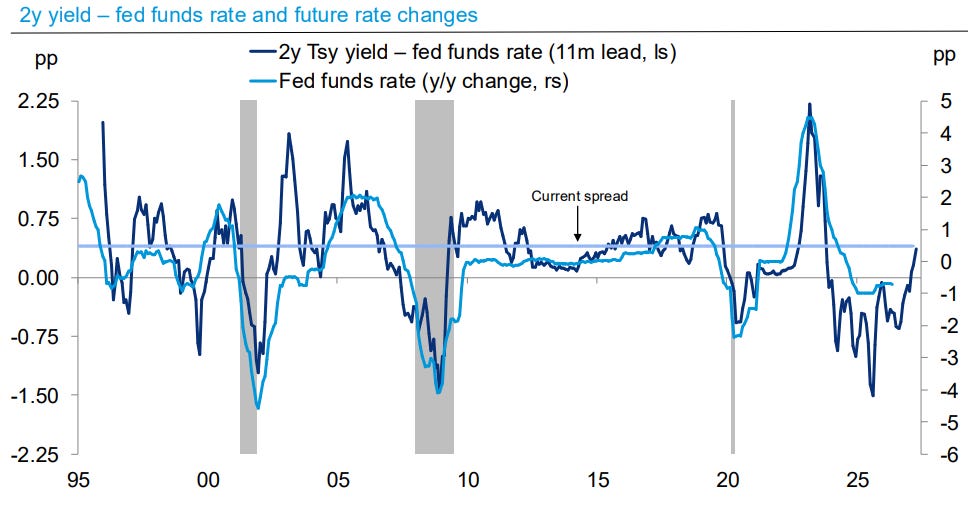
…The wide gap between 2y yields and fed funds rate also predicts rate hikes
Money supply tightness to bring the flation down … HOPE, as they say, springs eternally on Global Wall …
…Implications: The ongoing conflict in the Middle East continues to fuel inflation, as producer prices rose 1.1% in May, matching the increase from last month for the fastest pace in four years. Unlike in April where we saw a broad increase across categories, the surge in May was mostly limited to energy, which jumped 10.7%, driven by a 23.4% surge in gasoline prices. The 2.8% rise in goods prices marked the largest on record since the series began in December 2009. In turn, goods were responsible for nearly eighty percent of the headline increase…We expect volatility and uncertainty to continue in the months ahead as the ongoing conflict in Iran puts further pressure on oil prices and global supply chains. However, sustained movements in overall inflation are led by the money supply, which is up 4.7% in the past year versus the 6% trend prior to COVID when inflation remained low. We expect this monetary tightness will eventually bring inflation down once the conflict in the Middle East ends. Until then, incoming Fed Chair Kevin Warsh and the FOMC are unlikely to do anything with rates…
We’re all fixin’ the same broke cars, in the same boat, hopin’ HOPE floats … you know …
We had our 25bp ECB hike, though markets were probably expecting more commitment to future moves during the meeting. But lower oil prices turn out to be the bigger dovish driver. If tensions with Iran were to re-escalate, we could still see rates rise significantly higher
… said another way … Global CBs be like …
PPI schmeepeeeI … AND a rethink of risks to a FED CALL …
Trump canceled planned Iran strikes; Treasuries rallied and oil fell; ECB hiked 25bp; US PPI beat; equities rebounded; LatAm FX led EM gains; DXY at 99.69 (-0.3%); US 10y at 4.46 (-9.1bp).
Risk sentiment improved after potential US-Iran de-escalation lowered oil and haven demand, driving a rates rally, weaker USD, and stronger equities.
US rates rallied across the curve as President Trump canceled planned strikes on Iran and signaled a potential agreement, pulling oil lower and reducing near-term inflation-risk premia (2y: -8.1bp; 10y: -9.1bp; 30y: -7.4bp). The rally accelerated after earlier pressure from a weak 30y auction faded. The long bond auction tailed, stopping at 5.020% versus a 5.008% when-issued level, briefly eroding gains in the sector. Hot May PPI initially pushed against the rally, with final demand rising 1.1% m/m versus 0.7% expected. Equities rebounded as oil fell and short-covering supported risk (S&P 500: +1.8%; VIX: -12.5%; Brent: -4.2%; Gold: +3.4%).
US risk assets rallied sharply after President Trump’s announcement, driving a broad reversal of the geopolitical risk premium that had built up earlier in the week. Technology led the advance as investors rotated back into core AI and growth exposures, with semiconductors rising~12% and the momentum factor posting its strongest session in five years. Cyclicals outperformed defensives as lower oil prices and falling yields improved the macro backdrop, with consumer discretionary, materials, and industrials among the strongest sectors, while airlines outperformed within transports. Market breadth was exceptionally strong, suggesting the move extended beyond short covering alone and reflected a broader improvement in risk appetite as investors responded to signs of potential de-escalation in the Middle East conflict…
June 12, 2026 05:00 AM GMT MS US Economics Weekly | Reassessing risks to our Fed call after the latest data
Last week’s data suggest that, on net, the balance of risks is shifting toward firmer inflation rather than weaker hiring. The labor market continues to firm, and while the tariff impulse appears to be nearing completion, sustained disinflation ahead depends on a resolution of the conflict.
Key takeaways
The labor market has strengthened, reducing downside risks and shifting the Fed’s focus back toward inflation.
CPI came in line with expectations, suggesting the payback in core goods is underway.
However, a strong core PCE translation following PPI (0.36% m/m in May) indicates that the oil impulse to core persists—primarily through airfares.
The extent of airfare payback—and broader core disinflation—will depend on how long the Strait of Hormuz remains disrupted.
Consumption has been running slightly above wealth‑implied levels, and we expect limited upside risks to real spending growth.
Exhibit 1: The longer oil prices remain elevated, the greater the risk of second-round effects on core inflation.
Wait, what? EARL no longer in charge? Was I imagining things yesterday?
The ECB hiked rates by 25bp and stands ready to do more, as the inflation outlook warrants. The above-target core inflation forecast still in 2028 supports our call for another rate hike as early as the July meeting and a total of four hikes.
Central bank action has picked up with the ECB hike, and more tightening is likely in store. The first meeting chaired by Kevin Warsh is ahead next week. Meanwhile, the oil price has lost its position as the most important driver of interest rates.
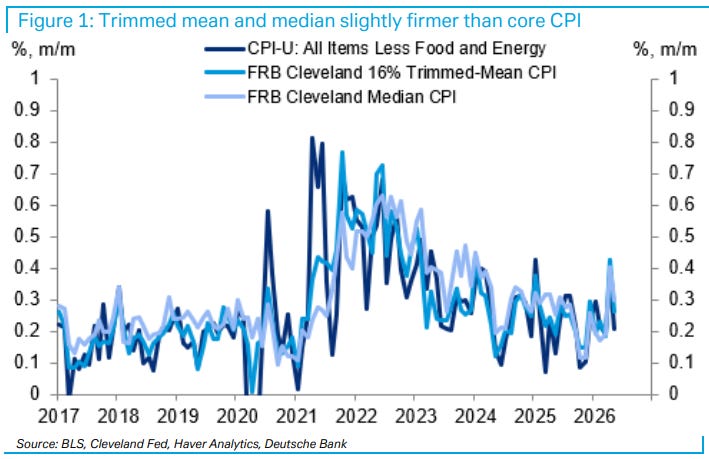
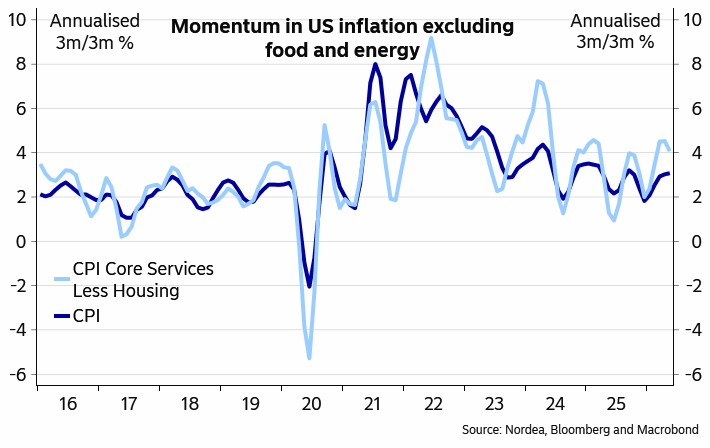
…US CPI momentum still pointing upwards
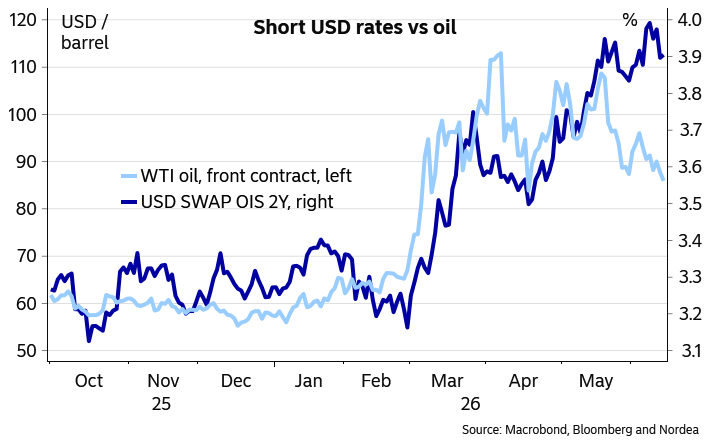
…Oil prices no longer set the tone for interest rates
When the war in the Middle East broke out, news on the hostilities determined the direction for energy and the oil price in particular, which in turn set the direction for especially euro-area interest rates. This relationship remained relatively strong for more than two months, but began to break down towards the end of May. We find good arguments in favour of a weakening relationship.
When energy prices first surged, questions about the likely response from central banks started popping up. A central bank can usually look through short-term spikes in energy prices, but the longer elevated energy prices persist and the longer they last, the bigger the risk that they will spill over to broader prices. The state of the economy naturally matters as well, with weak demand and ample spare capacity limiting the pass-through of higher energy prices through supply chains.
By now, there are already plenty of signs of broadening inflation pressures, so at least as far as the ECB is concerned, the question is no longer whether there will be a monetary policy response, but how big it will be. While the developments in the Middle East naturally still impact the outlook, as also the ECB confirmed at the June meeting, the impulse of higher energy prices is already making its way through supply chains. In other words, increasing focus will be placed on assessing the mechanics and strength of broader prices pressures. Lower energy prices alone would probably not remove all the ECB’s inflation worries, which has been confirmed by several Governing Council speakers as well. It thus makes sense that short interest rates have not followed oil prices lower at least in full.
Going forward, the prospect of a peace agreement still hangs in the air, and in case a more permanent agreement is reached, both energy prices and interest rates will likely fall sharply on that day. The prospect of such an outcome probably still limits more aggressive ECB hike positions for now. We still think the ECB will hike rates all the way to 3% at consecutive meetings, which is clearly above the current market pricing…
…The relationship between the oil price and interest rates weakened in the euro area …
… and in the US
…What will Warsh do next week?
After the ECB’s rate hike, the focus will now shift to the FOMC next week, with the decision out on Wednesday 17 June. This meeting will be very interesting as well, as Kevin Warsh is set to chair his first meeting. The initial focus will be on Warsh himself. President Trump has been calling for rate cuts for a long time, but there is currently no broader support within the FOMC for such a measures. Will Warsh try to forge consensus and side with more neutral or even slightly hawkish views, strengthening his credibility, or will he dissent at his first meeting to appease the President’s expectations and seriously dent his credibility right from the start? We think the former approach is more likely.
The statement itself is likely to adopt a more neutral stance on further rate moves, while the dot plot of the individual rate forecasts of FOMC participants will probably no longer include the rate cuts that were in the profile for this year in March. Some calls for hikes are actually also likely to creep into the dot plot. Warsh has not been a big fan of the dot plot, so he is likely to have plans to change the Fed’s communication policy going forward, but it would be a surprise, if material changes were implemented as early as at the June meeting. An announcement of future changes might surface, however, while Warsh may not necessarily be willing to include his own forecasts in the dot plot.
Financial markets moved to price in tightening from the Fed later this year
MORE on the ECB …
12 Jun 2026 UBS: Carrying on, without keeping calm
The expected error from the ECB was accompanied by rhetoric citing concerns about oil price pressures broadening throughout the Eurozone economy. There is no evidence of this reported broadening—non-oil prices should be expected to pass on oil-related costs, and only a wage-spiral or profit-led inflation would constitute a broadening of inflation pressures. These are notable by their absence. Nonetheless, the Teutonic cry of “we must have discipline” seems to be echoing throughout the ECB, raising the risk that the error will be compounded with a further rate increase.
US President Trump has suggested—for what media report to be the thirty ninth time—a deal with Iran is just around the corner. Iranian media is suggesting that the US has agreed to Iranian terms, which has given the statement a little more credibility.
US University of Michigan consumer sentiment data is due, and is not especially useful. However, polls do matter to the extent that they influence politicians. Other polls suggest that a majority of Republicans now blame Trump for the affordability crisis, so the political breakdown of the Michigan data is important…
Greetings from Greece. My colleagues, Elias and Toby, have been writing the QTs this week while my wife and I are vacationing in Crete and Santorini. The weather, food, and people are great. In Crete, we visited the ruins of the Palace at Knossos. It was the ceremonial and political center of the Minoan civilization and culture that thrived during the Bronze Age. We learned that for fun, Minoans enjoyed bull jumping. In Greek mythology, Zeus was born in Crete. In addition, the Minotaur, who was half human and half bull, was confined by King Minos of Crete to dwell in the Labyrinth, designed by the architect Daedalus and his son Icarus. Icarus died by flying too close to the sun, which melted his wax wings.
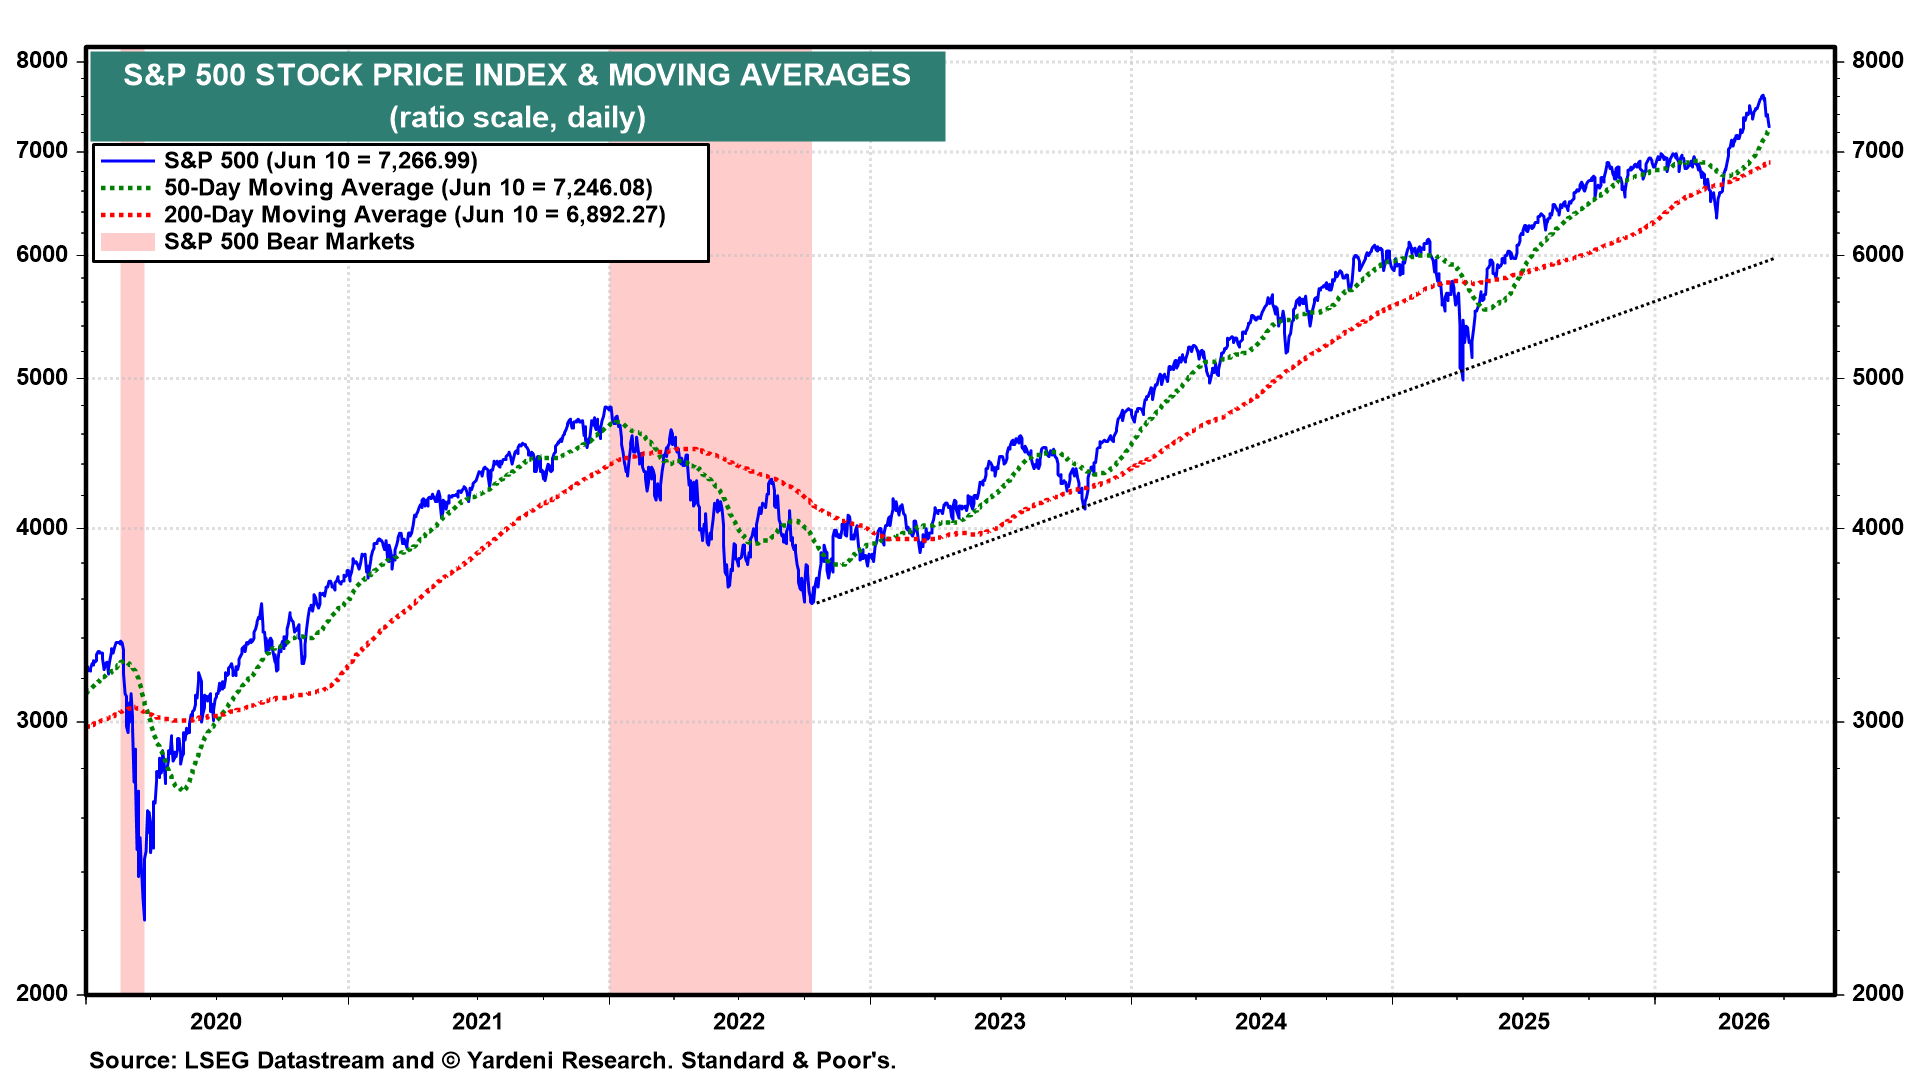
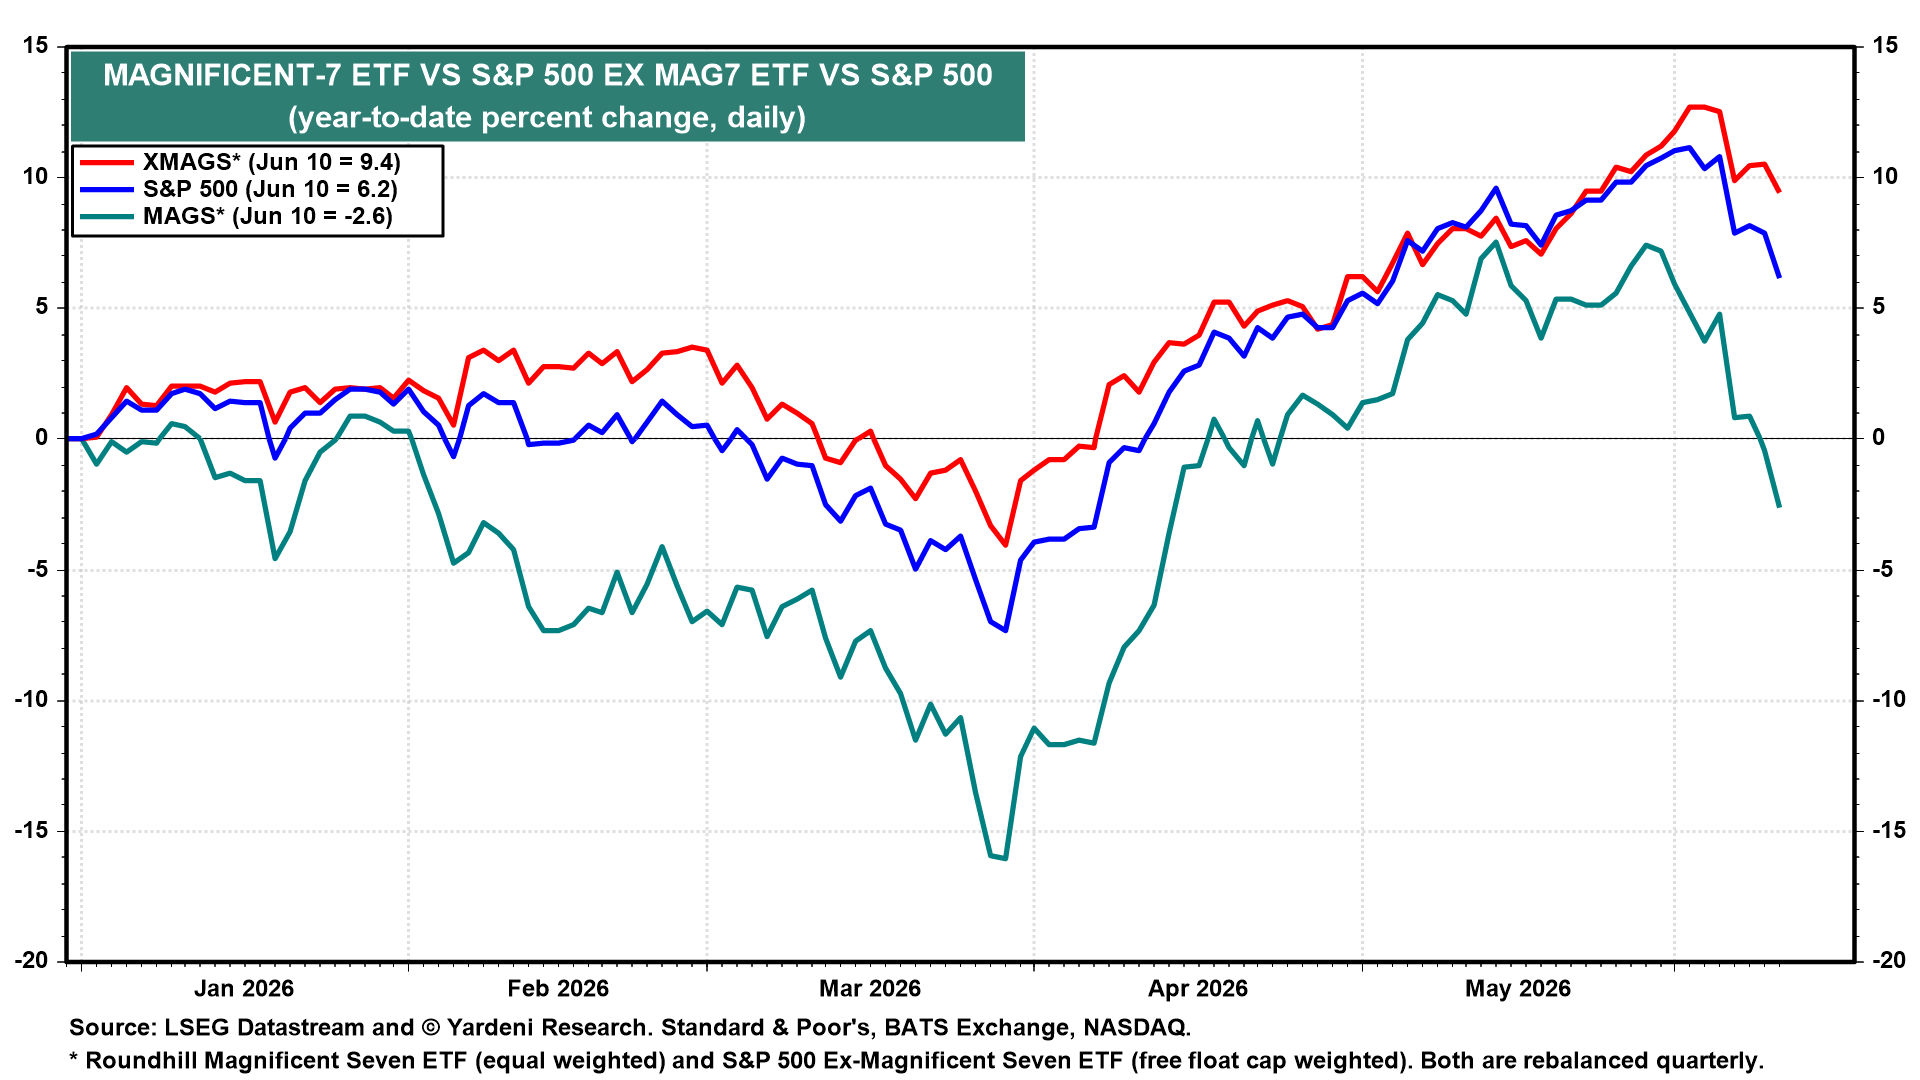
(1) Markets. Today’s bull market in stocks has raised concerns that investors are flying too close to the sun and are in for a meltdown like Icarus’. We try not to be bullheaded, but we think that the earnings-led bull market will continue at least through the end of the decade. We think that June’s Swoon so far is more likely to be a rotation than a correction (chart). The S&P 500 bounced off its 50-day moving average today on news that President Donald Trump decided to postpone a planned attack on Iran. He subsequently said that a deal to end the war is imminent. Iran has yet to confirm this.
While the Magnificent-7 companies mostly continue to deliver fabulous earnings momentum (FEMO), investors aren’t sure that they can sustain it given their enormous AI capex. In addition, there is lots of uncertainty about the AI investments’ payoff. Recently, LLM providers have had to lower the prices of their “tokens” in response to pushback by business users at the high cost of using AI tools.
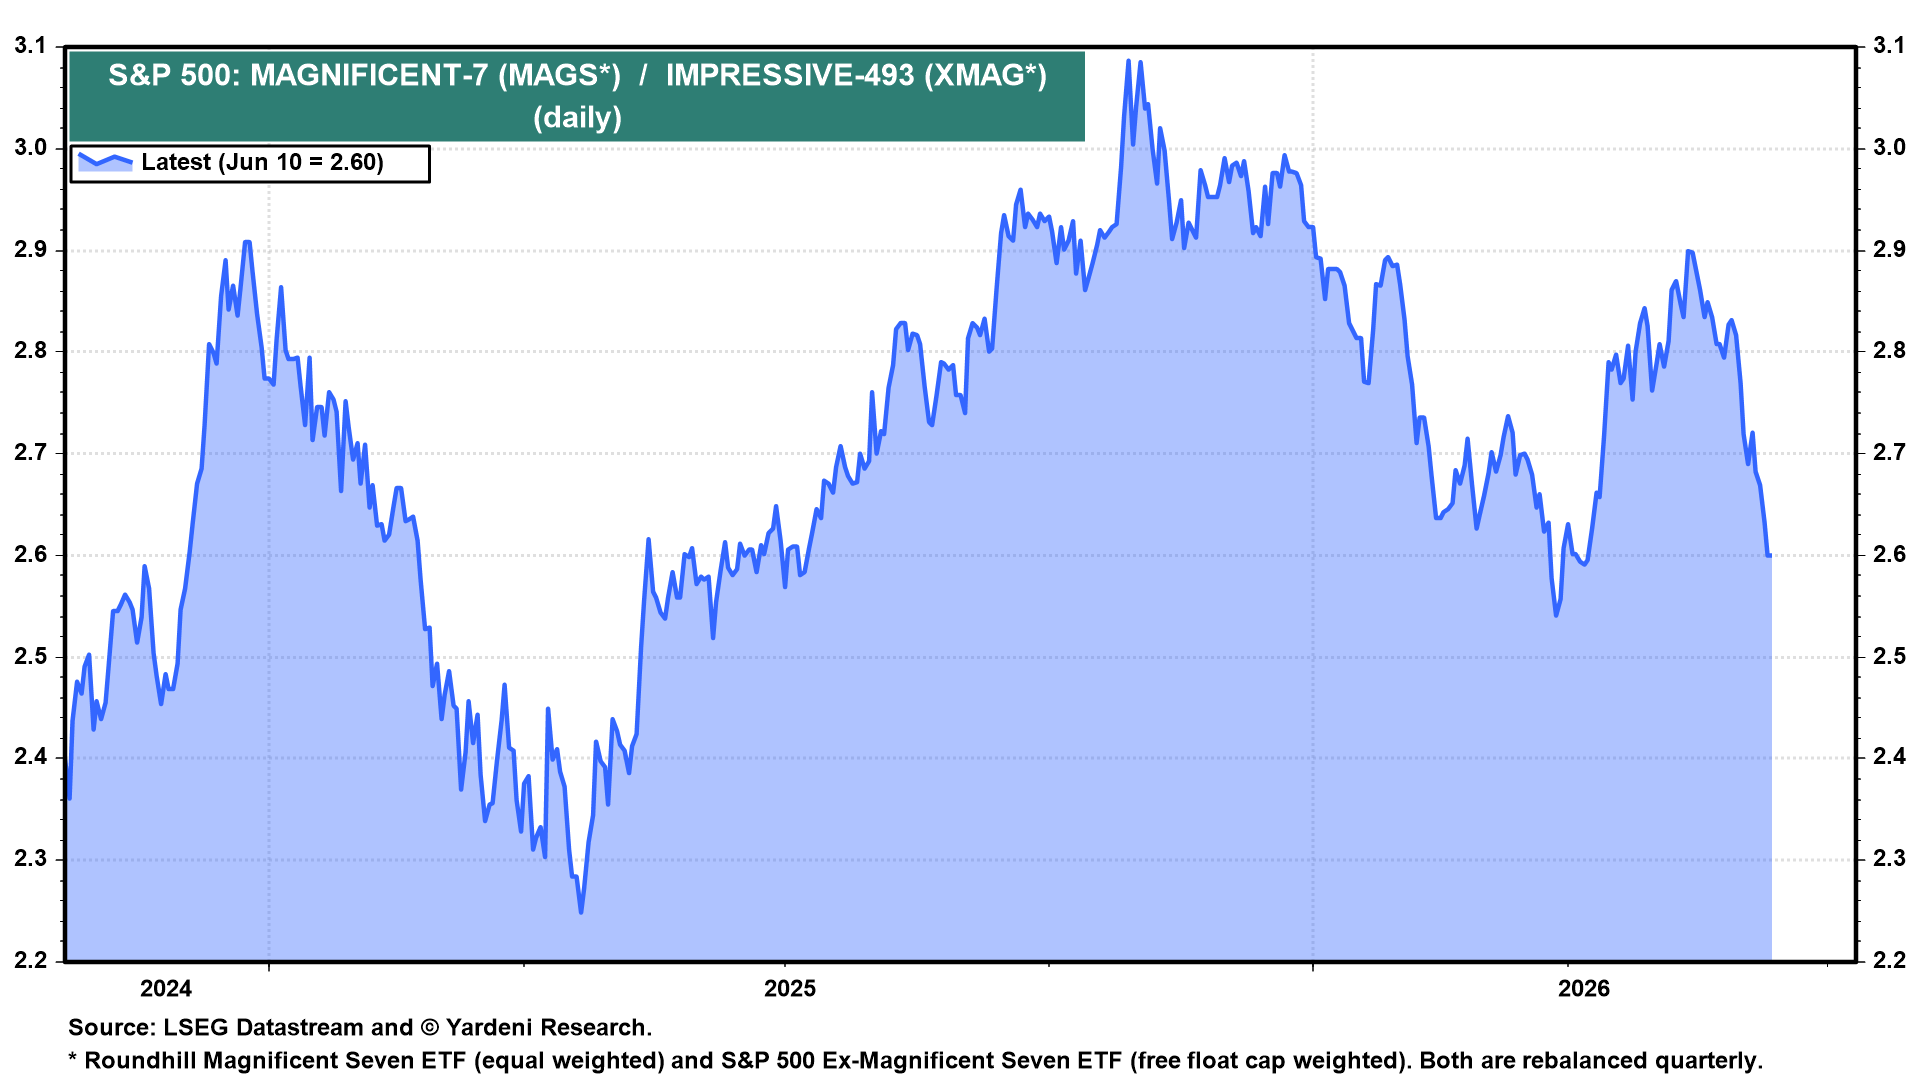
In recent weeks, the Impressive-493 collectively have outperformed the Magnificent-7 stocks (chart). The latter might also be getting hit by profit-taking by investors participating in tomorrow’s gigantic SpaceX IPO.
The MAGS ETF is down 2.6% ytd, while the XMAGS is up 9.4% (chart).
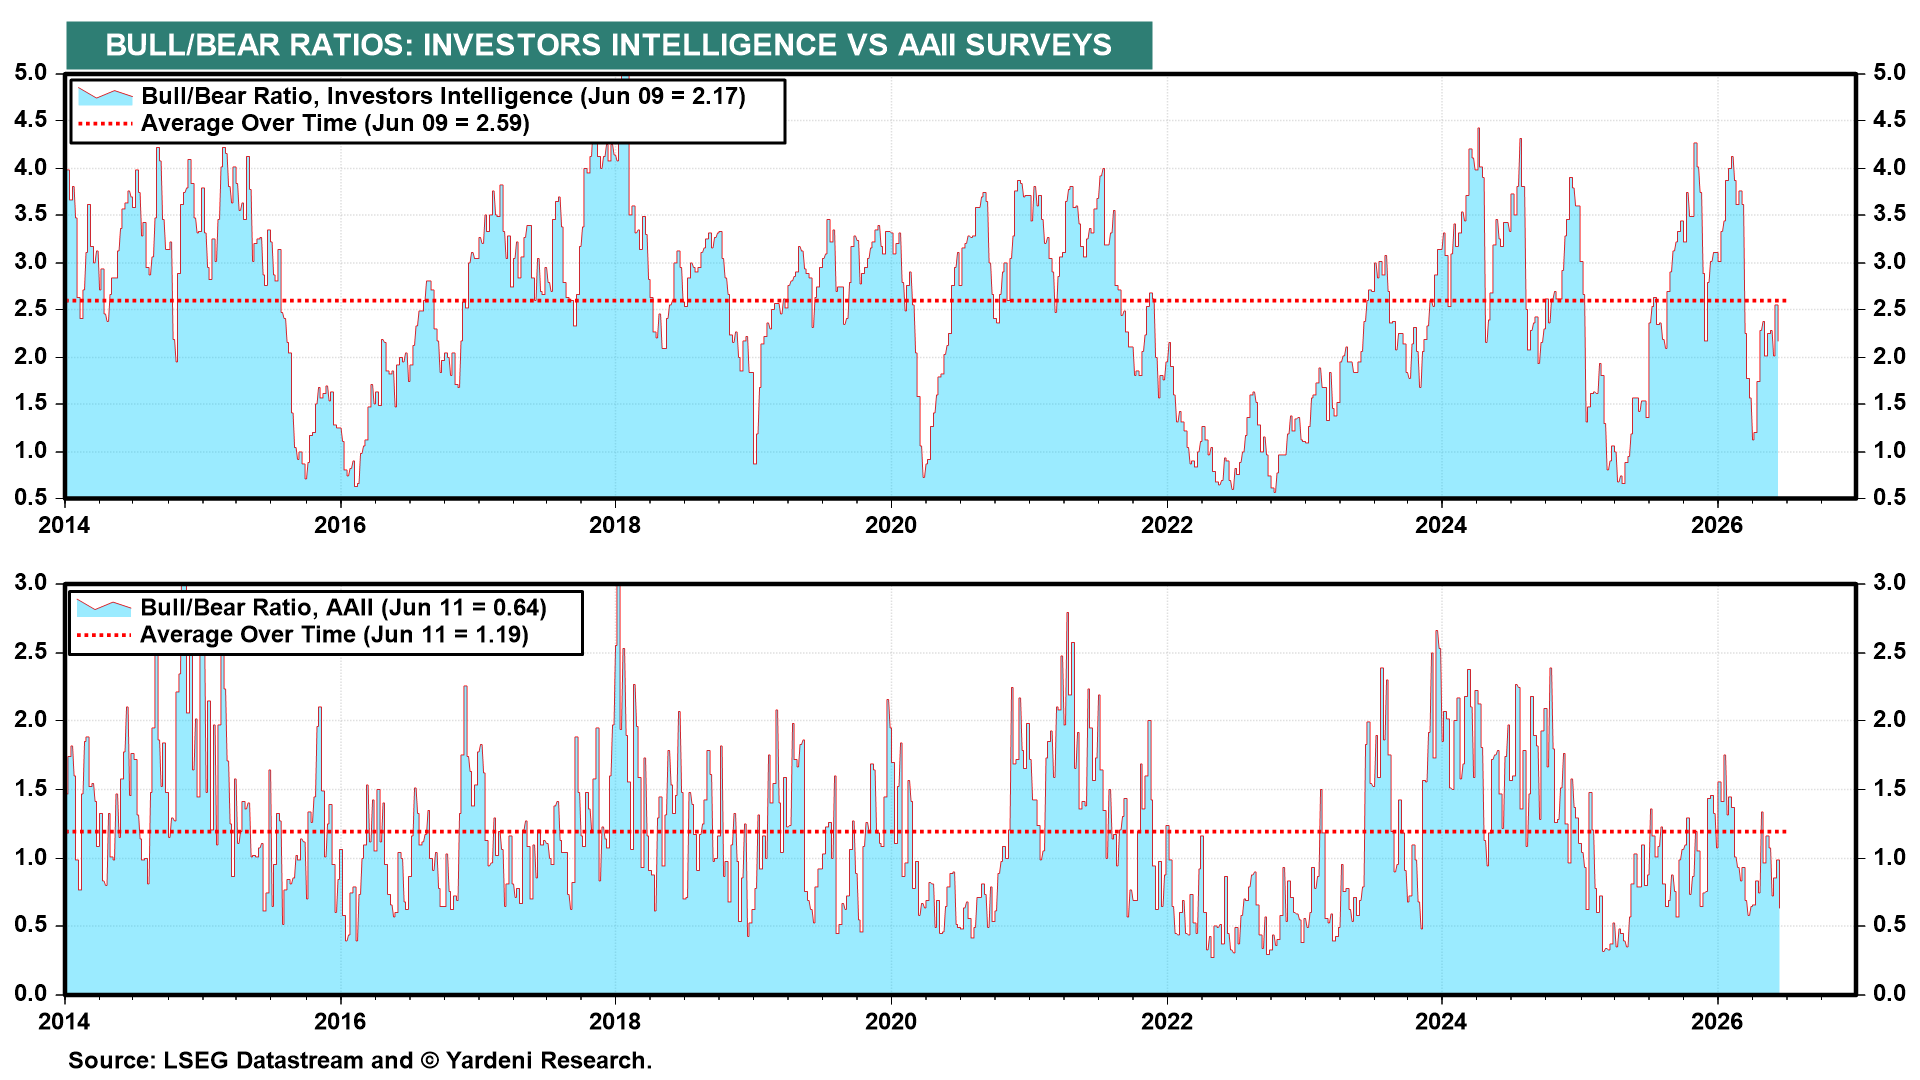
Another reason we don’t expect the current June Swoon to turn into a correction is that our two favorite Bull-Bear Ratios remain subdued (chart). We tend to get concerned when there are too many bulls.
By the way, a couple of days ago, when the price of gold dropped below its 200-day moving average around $4,500, we concluded that it was likely to fall further and find support at $4,000 (chart). We still think that, expecting it to bounce off that level and resume the bull market that began in late 2022. We would have to seriously reconsider our current stance should the price fall below $4,000…
… Moving along TO a few other curated links from the intertubes. I HOPE you’ll find them as funTERtaining (dare I say useful) as I do … …
GOOD news, 3x in a row …
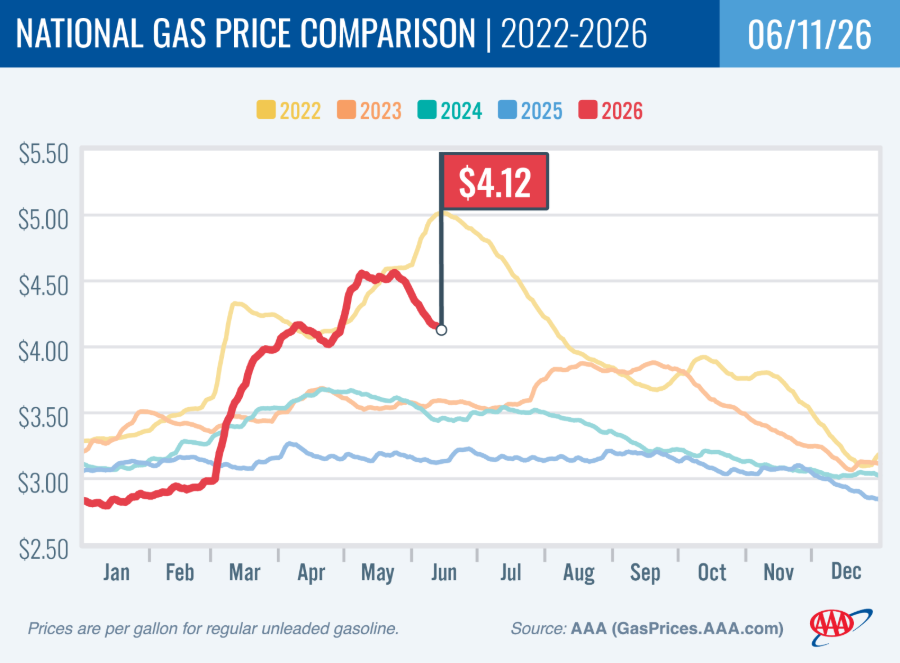
June 11,2026 AAA: Pump Prices Fall for Third Straight Week
WASHINGTON, DC (June 11, 2026) – The national average for a gallon of regular has been falling for three straight weeks, delivering some relief to drivers during the busy summer travel season. Since May 21, the national average has dropped from $4.56 to $4.12 thanks to crude oil prices remaining below $100 per barrel. Gas prices typically peak around this time of year, but uncertainty surrounding the Strait of Hormuz makes this year more unpredictable. Pump prices remain at four-year highs, but the national average is currently far from the record set on June 11, 2022, of $5 per gallon.
Perspectives on where the buffalo and bond yields could roam …
Historically, short-term bouts of yield volatility have oscillated around a more central, core, and slow-moving average established by past inflation environments.
Bond yields are driven by numerous forces including the supply of bonds, the pace of real economic growth, the focus of Federal Reserve officials, the degree of risk appetite or safe haven demands from both domestic and foreign investors, the competitive level of real yield offerings, and of course fears of inflation. Over time however, the central level of yields is established predominantly by a long-term moving average of the inflation rate. Evidently core inflation expectations – while impacted by short-run inflation evidence – are primarily formulated by long-run experiences with inflation. In the short-run, bond yields can be volatile, surging higher or plunging lower based primarily on contemporary events. Historically, however, these short-term bouts of yield volatility have oscillated around a more central, core, and slow-moving average established by past inflation environments.
Bond Yields Equilibrium Tied to a Long-Term Trailing Average of the Inflation Rate
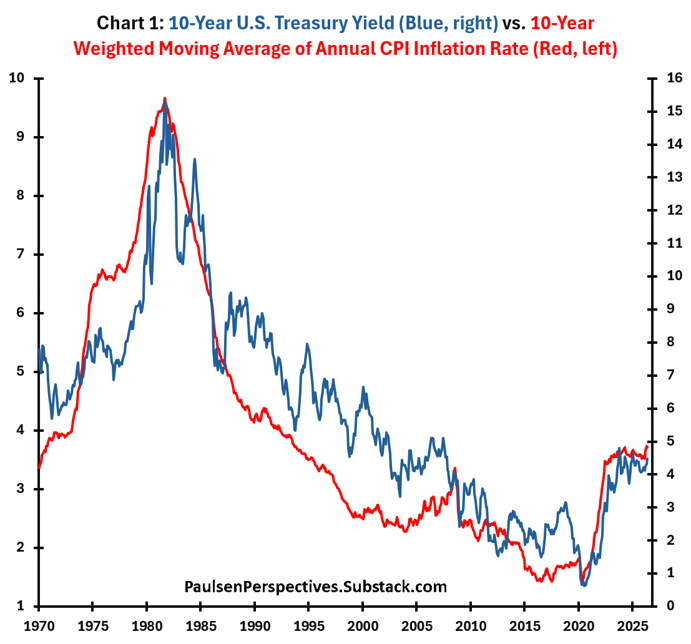
The fundamental character of the bond market is perhaps best illustrated by chart 1 which, since 1970, overlays the 10-year U.S. Treasury bond yield (blue line, right scale) with a trailing 10-year weighted moving average of annual consumer price inflation rates (red line, left scale). A few observations are noteworthy.
First, bond investors are obviously focused on much more than just the latest monthly inflation report. During the last 56 years, a simple slow-moving average of inflation rates during the previous 10-years does a pretty good job of tracing the major trend moves in long-term bond yields! Since at least 1970, when the 10-year moving average of the inflation rate rises, the underlying trend in bond yields has been higher whereas a declining long-run average inflation rate indicates a falling trend for bond yields. From 1970 to 1981, the 10-year average inflation rate rose and so did the trend of bond yields. Then, from 1981 to 2020, the average inflation rate declined and bond yields “trended” lower. Between 2020 to about 2023, the long-run average inflation rate again rose and so did bond yields, and since 2023, both the average inflation rate and bond yields have trended sideways. Clearly, the central tendency (trend) or core bond yield is simply the product of a slow-moving average of past inflation rates!
Second, bond yields tend to be much more volatile than the long-run central inflation expectation as proxied by the weighted 10-year moving average of past CPI inflation rates. That is, in chart 1, the blue line is chronically more volatile than the red line. Consequently, although the average long-run inflation rate does provide investors guidance as to the trend of yields, it doesn’t necessarily provide good insight into the short-run movements of bond yield. Clearly, whether the long-run inflation rate is trending higher or lower, bond yields can rise or fall significantly in the short-run.
Third, despite considerable volatility in the short-run, bond yields do ultimately return to the core levels portrayed by the long-run inflation rate. Specifically, whenever the bond yield (blue line) in chart 1 has meaningfully been below its core level (red line), bond yields have trended higher regardless of their daily or annual volatility. For example, when the red line rose above the blue line in 1974, this was a timely warning to bond investors that yield risk was increasing. From 1974 to 1981, bond yields mostly rose attempting to catch up with long-run inflation expectations. Conversely, between 1987 to 2020, although bond yields were volatile, they mostly declined because they were “above” declining inflation expectations. Finally, once long-term inflation expectations again rose above bond yields in 2020, yields mostly rose until inflation expectations (red line) stopped worsening in 2023. Essentially, when the 10-year bond yield is chronically above or below the long-run inflation expectation, this construct has provided a good guide to the future direction of yields.
Contemporarily, since 2023, both bond yields and the long-run average inflation rate have been stuck in a sideways range. Moreover, bond yields are not deeply below or above their equilibrium level relative to long-run inflation expectations. Thus, bond yields have primarily remained rangebound since 2023 because they currently trade close to an appropriate premium relative to long-term inflation expectations and because inflation expectations have similarly been locked near the same level. That is, since 2023, the long-term inflation rate has persisted near 3.5%, and the 10-year bond yield has oscillated near 4 to 4.5%. Looking forward, the question is where will bond yields most likely roam? Forget the Fed, the size of government deficits, the pace of economic growth, investor risk appetites, or the supply/demand for bonds. Not surprisingly, the answer depends primarily on where inflation is headed.
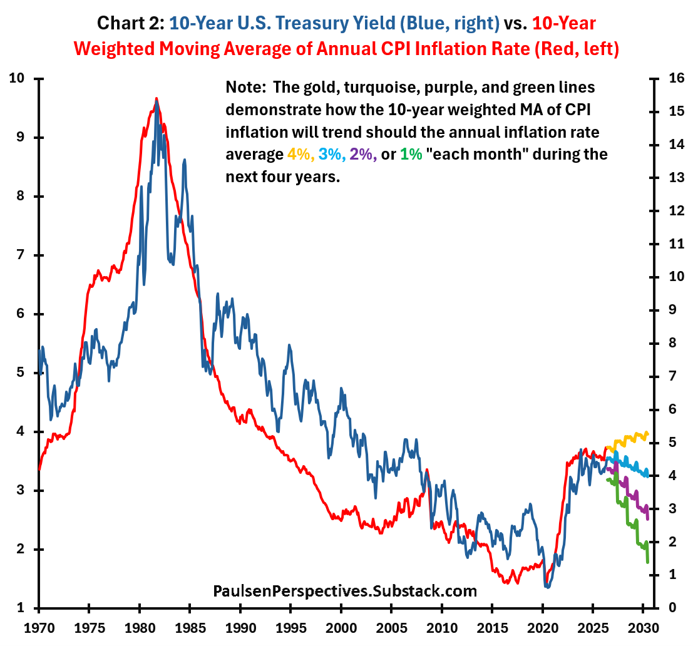
Where Will Bond Yields Roam?
Chart 2 depicts how the 10-year weighted moving average of inflation rates (i.e., the proxy for bond market inflation expectations) will respond in the ensuing four years based on different inflation assumptions through mid-2030. Specifically, the gold, turquoise, purple, and green lines demonstrate how the 10-year weighted moving average of past inflation rates (i.e., historically the red line in chart 2) will trend should the annual inflation rate average 4%, 3%, 2%, or 1% “each month” through mid-2030.
The current trailing 10-year CPI inflation weighted average is about 3.75%. For this average inflation expectation to worsen during the coming four years, the annual CPI inflation rate would have to average more than 3.5% “each year” during the coming four years. Indeed, as shown on the chart, even if inflation averages 4% per annum in the coming four years (the gold line), the average bond market inflation expectation in mid-2030 will still be slightly below 4% implying an equilibrium “core” bond yield of only slightly more than 5%. Alternatively, should inflation average 3.75% or less in the coming four years, average bond market inflation expectations are poised to “decline until mid-2030. For example, if the Fed’s 2% inflation target is achieved on average during the coming four years, the bond market’s inflation expectation will decline from today’s 3.75% to only 2.5% (the purple line) suggesting a “core” bond yield at about 3% by mid-2030. Given normal bond yield volatility, this would imply a reasonable range for the 10-year bond yield by 2030 of say between 2.25% to 3.75%.
Of course, inflation could prove disastrous in the next four years – anything is possible. However, given the cultural obsession with inflation in recent years, the likelihood of an eventual peace with Iran leading to lower energy prices, a continued sluggish overall pace of real GDP growth, lousy and worsening U.S. demographic growth, and considering the current relative contractionary economic policies being employed, it seems highly likely inflation will prove “lower” in the coming years than it was during the most recent pandemic/tariff-riddled/Iran war years.
Final Comments
All investors (present company included) get wrapped up in analyzing and overanalyzing the latest movements in commodity prices, wages, producer and consumer prices, various economic reports, and the ongoing stream of Fed commentary. Every month, “news” creates bond market volatility. However, it’s good for investors to be reminded that “core bond yield pressures” typically change much slower than suggested by the monthly economic reports.
As the charts in this note indicate, the central or core bond yield and its upward or downward trending potency is tied primarily to a slow moving 10-year average of past CPI inflation rates. In the last three years, the bond market’s inflation expectation – based on the last 10-year’s weighted average inflation rate – has been rangebound between about 3.5% to 3.75%. Essentially, inflation expectations appear to be topping! Consequently, despite all the monthly worries about potential imminent inflation risk and whether the Fed will or won’t adopt a tightening bias, the 10-year Treasury bond yield has likewise been primarily rangebound between about 3.75% and 5%.
The average inflation rate in the coming four years seems highly likely to be “less” than the current central inflation expectation of 3.75% (from the red line in chart 1).Consequently, the “core trend” of bond yields (which has been “sideways” during the last three years”) will likely soon be downward for the first time since 2019. After fearing much higher yields for the last several years, investors may want to consider the likelihood of significantly “lower” bond yields during the coming years. Should the “core trend” of bond yields finally change from the rising or flat trend of recent years to a persistent “declining” trend, this will probably prove to be good news for both bond and stock investors.
Finally, ahead of weekend festivities (NYK game) which do NOT include a workout …


The bondbot getting better and better