while WE slept: USTs benefit from EARL and TECH (KOSPI ~ -10%); #Got2s?; when in doubt, jack the S&P tgt; June index #extensions < avg; “conundrum”; QE chart; SPCX chart pattern
CNBC: Tech rout intensifies as selloff grips global stocks Yahoo: NAZ, S&P plunge as global chip sell-off spurs AI doubts…
… AND a few thoughts …
This morning, with NAZ future down BIG, tech-inspired selloff ‘bleeding’ across GLOBAL Wall. Today’s casualty is the KOSPI which fell approx 10% … This, in turn, helped bring UST yields in a bit, after 2s hit highest levels in a year.
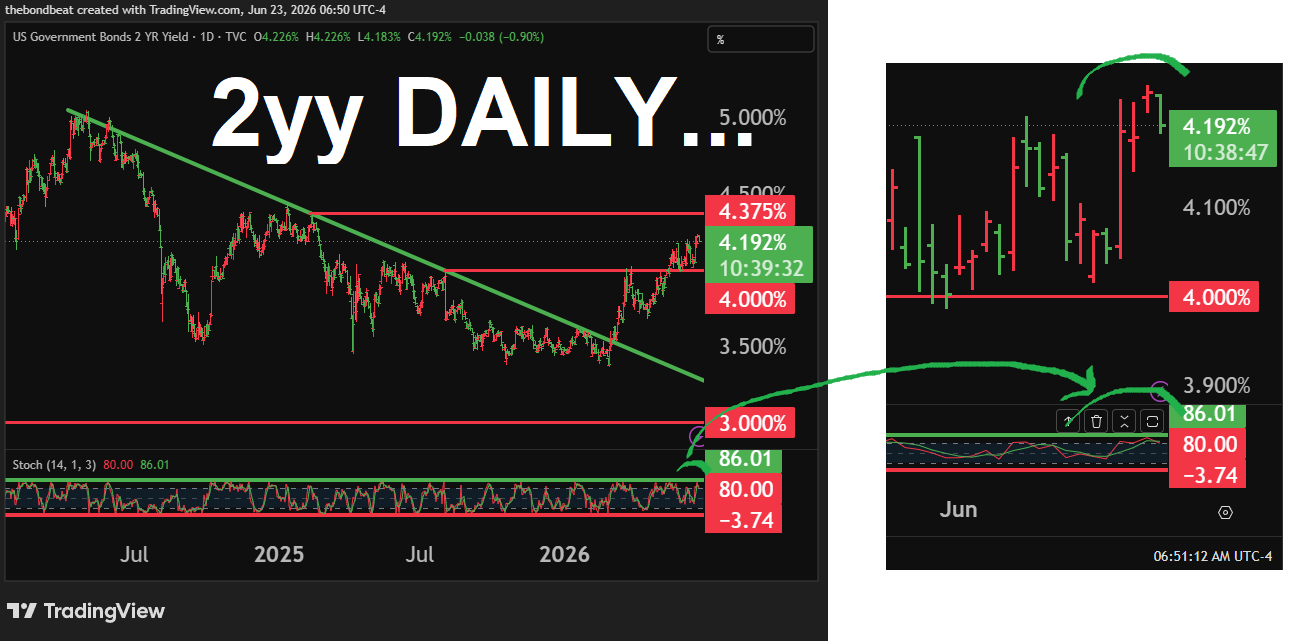
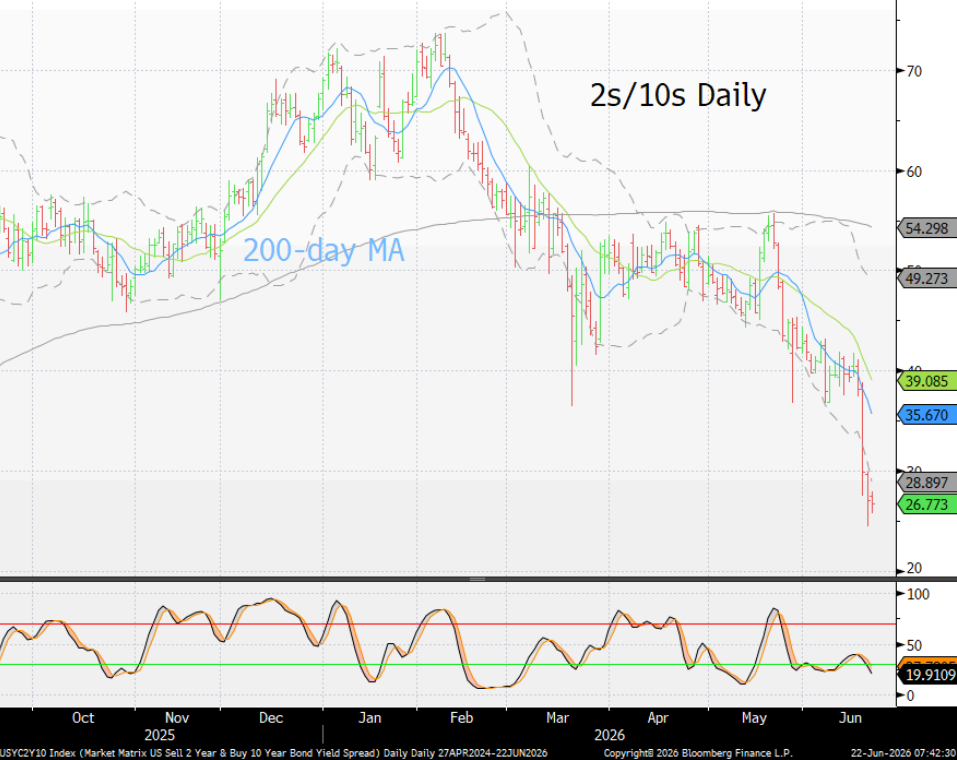
2yy DAILY (bars): 4.25 (round nbr) and 4.1875 (middle point of 4.375 - 4.00) ..
… momentum overSOLD, reflexing, rolling, suggesting current pop in yields '#DipOrTunity’ …
#Got2s? Keep yer friends close and stops closer? Get those bids in early and often?
NOW, in as far as WHY front-end and rates reflexing bullishly this morning, well, stocks. Noted above, here’s a look at the ‘BIG’ selloff in the KOSPI overnight. YES, it was down nearly 10% overnight, but let’s face it — I’m not a tech stock expert NOR a SKOREAN tech stock one, at that … spot the selloff …
absolute crickets on way UP 10% and now we’re all nervous in the service…did we THINK it goes on forever ad infinitum?
… and here we are … with bonds being bonds (safe havening for Global Wall), front-end to be tested into supply, I’ll move right along TO my BondBot Intern …
Overnight felt like watching a championship team trade its franchise player at the top while the fans were still buying jerseys. The KOSPI got absolutely smoked—down nearly 10% as Samsung and SK Hynix, the twin engines of the AI supply chain, suddenly reminded investors that trees do not, in fact, grow to hyperscale datacenters. The AI narrative hasn't died; it merely encountered valuation. Meanwhile SPCX, priced at $135 in the largest IPO circus in history, has already slipped below its IPO close as investors discover that "infinite demand" is not an accounting metric. Bonds finally caught a bid, serving as the financial equivalent of a storm shelter while tech tourists sprinted for the exits. The message from rates is simple: when the world's favorite crowded trade starts looking like a game of musical chairs, Treasuries still have a chair left. Everyone wanted AI exposure—right up until they got it. Turns out "to the moon" is a lot less fun when the rocket is publicly traded.
… not bad. I’ll move right along …
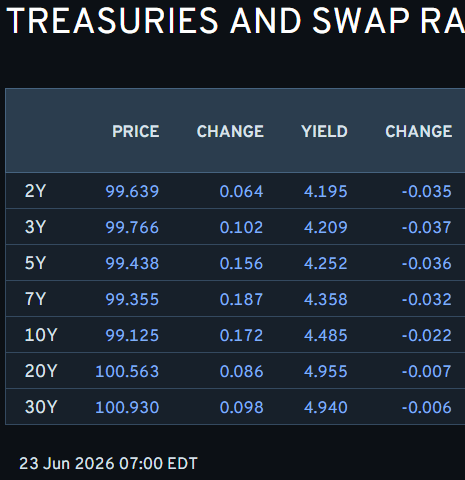
Onwards and upwards TO the reason many / most of you are likely here … whatever it may be on Global Wall’s mind but first … here is a snapshot OF USTs as of 700a:
… for somewhat MORE of the news you might be able to use … a few curated links for your dining and dancing pleasure …
NEWSQUAWK US Market Open: USD attracts haven demand after hefty KOSPI losses; NQ -2.5% … Fixed benefits from modest energy downside and traditional haven allure; PMI commentary points to a possible peak in price pressures … USTs firmer by seven ticks in 109-06+ to 109-14+ confines, towards but just off highs as the mentioned energy move off lows has seemingly formed a ceiling in fixed or now at least. Ahead, we have the region’s Flash PMIs before 2yr supply. A tap that should benefit from a number of factors.
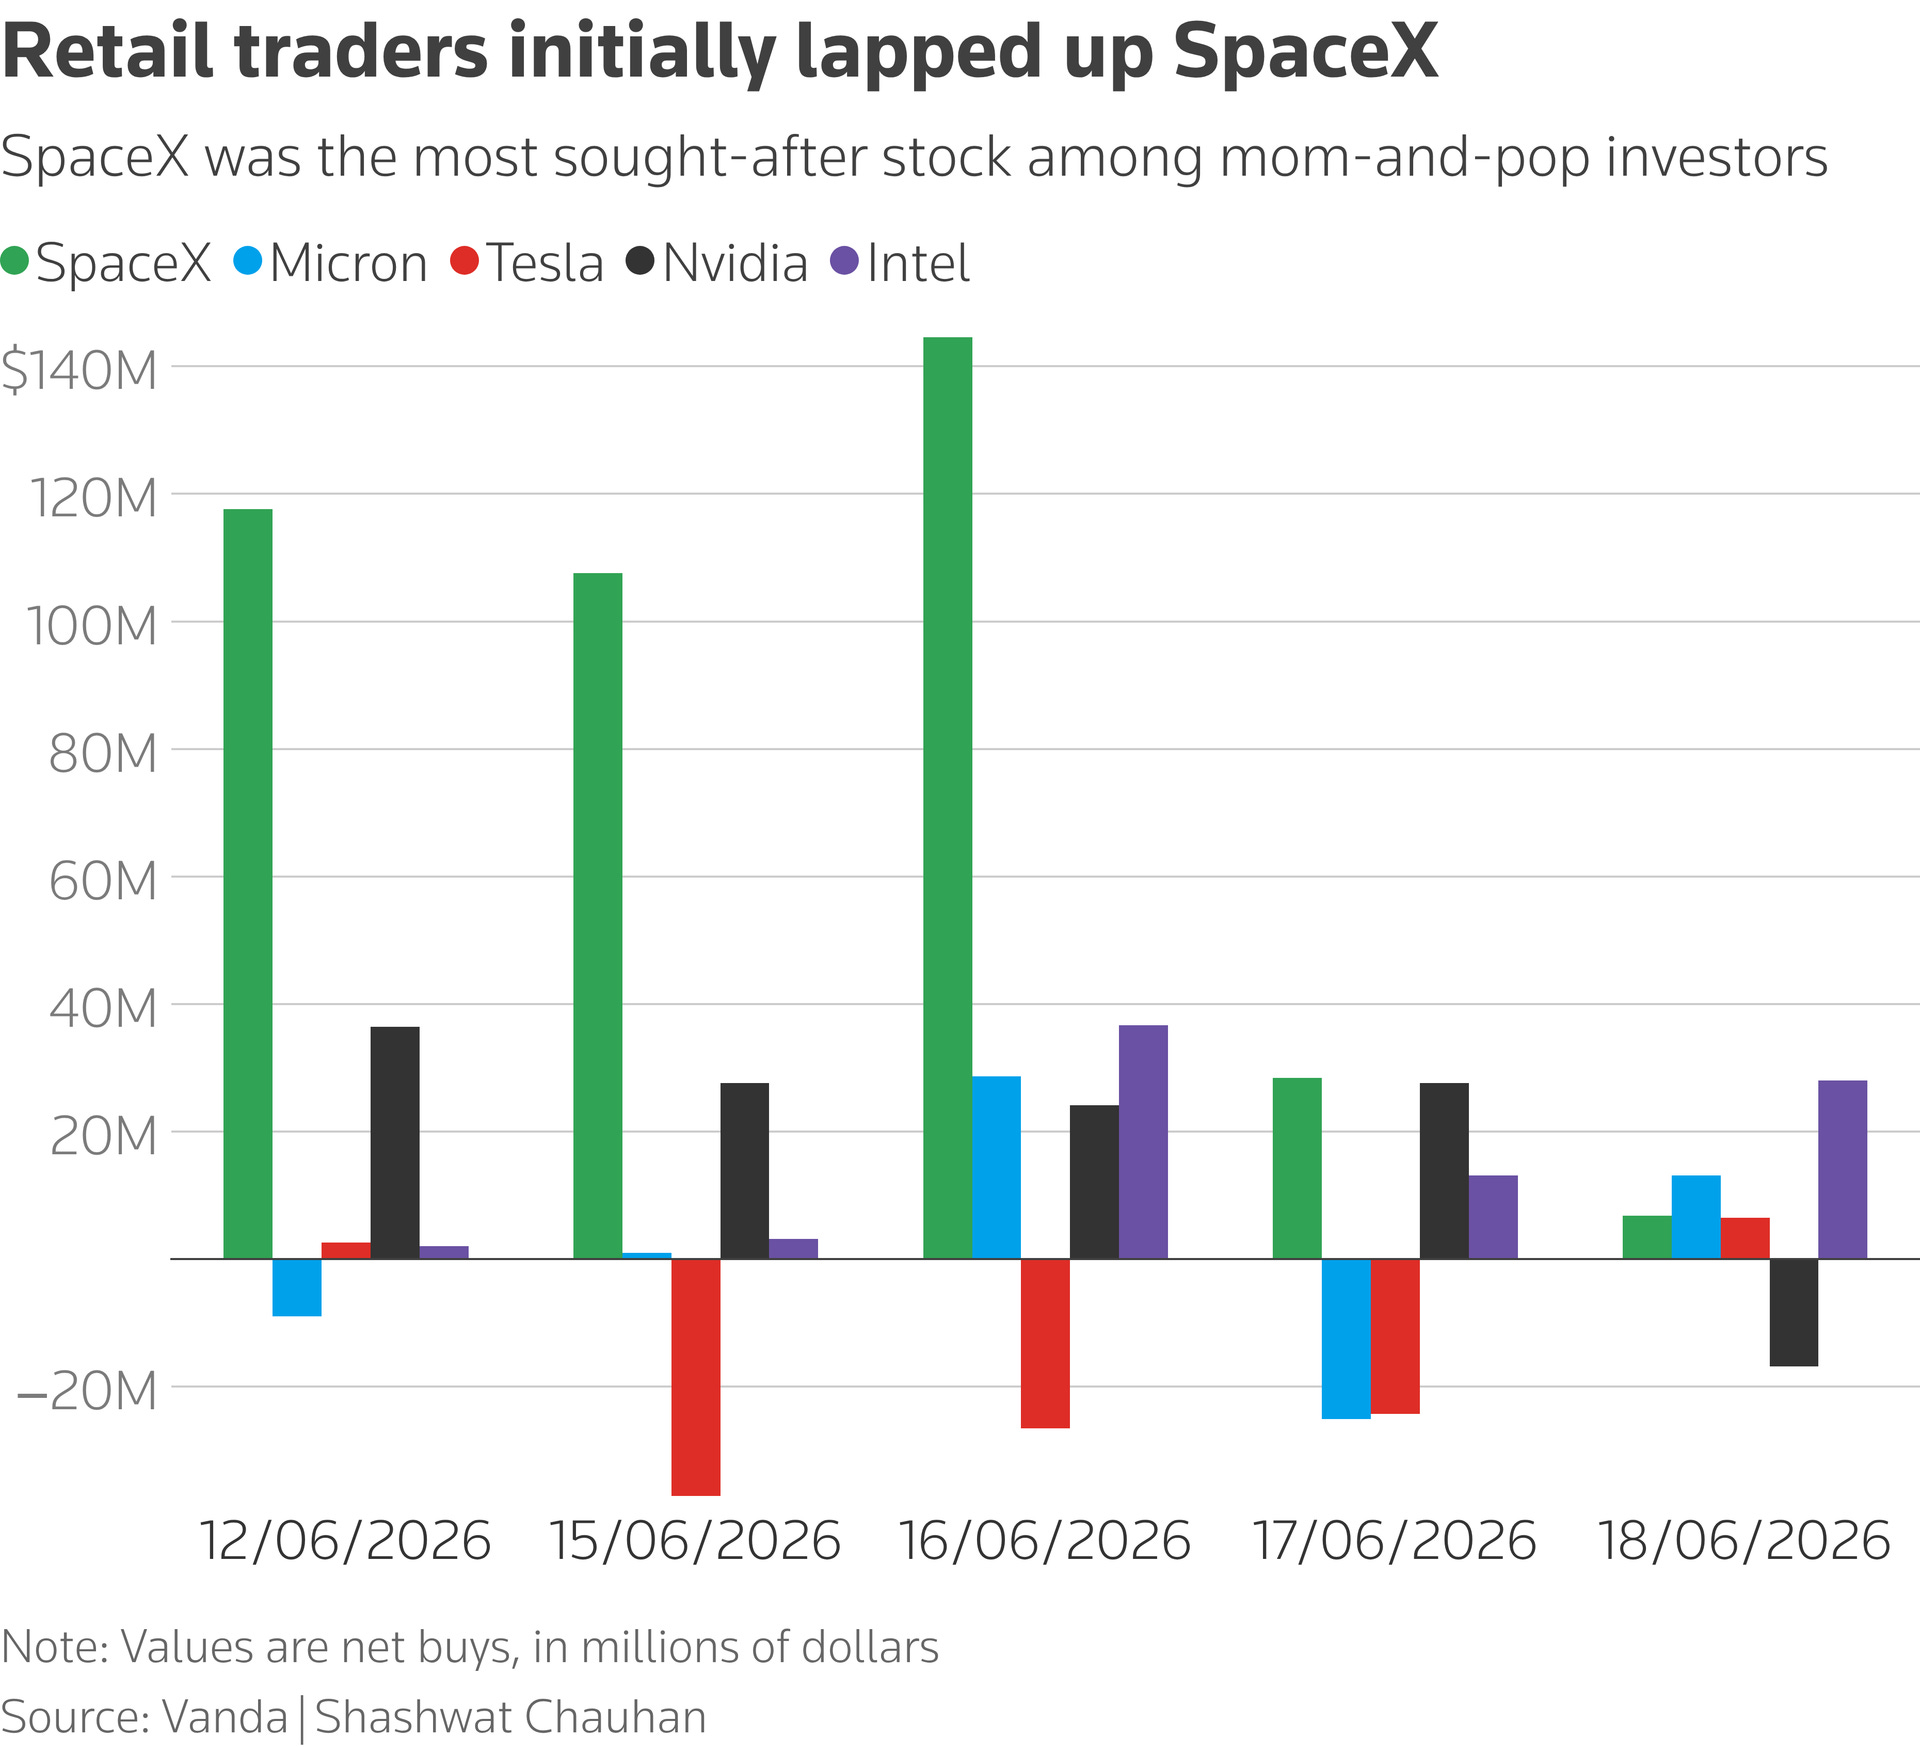
SpaceX stock has reversed all its initial trading gains since its IPO, falling below its first stock price print after a nearly 17% drop on Monday, as the company outlined debt-raising plans and other Big Tech megacaps also swooned.
The shares remained 14% higher than the $135 listing price on Monday, but they fell a further 2% in afterhours trading. The quick reversal will concern retail investors who pumped tens of millions of dollars into the stock last week, and it also threatens the company’s newfound $2 trillion market valuation…
Equities remain choppy as peace talks stop and start, and questions linger around AI spend, funding and monetization, higher for longer rates, and consumer strength. We focus on the improving earnings outlook, taking our FY26 EPS to $337 from $321, and our 2026 PT to 7800 from 7650.
Macro regime remains complex, but the balance of risks still leans constructive. Labor data are strong enough to reduce recession risk, but also to push rate cuts further out. Input costs are rising again, though not yet a growth shock large enough to derail the cycle. The equity bull case remains intact, but earnings and AI capex visibility must do more of the work as Fed support fades and positioning is less able to absorb disappointment.
We raise our FY26 S&P 500 EPS estimate to $337 from $321, modestly below the Street’s $341 and implying ~21% Y/Y growth from $279 in FY25. Tech earnings guidance and visibility remains underpinned by expanding AI capex, reflationary pressure should support nominal revenue growth, and the industrial side of the economy looks relatively supportive into 2027, offsetting potential downside to consumer spending. We also introduce our FY27 EPS estimate at $389 (+15% Y/Y), below the Street’s $398.
Our 2026 S&P 500 price target goes to 7800 from 7650. We trim our valuation assumptions modestly from the last update (23x FY26 EPS, down from ~24x) to account for uncertainties around the scale, funding and monetization timeline of capex, AI-led dispersion, and higher nominal yields and inflation. This leaves earnings to do the work in raising our price target. We also introduce our 2027 price target at 8800…
…Risks we are watching into the back half of the year include signs of stress in the AI investment cycle, including the ‘what-ifs’ we debated last September: model advancement, availability of power, and funding (especially as the financing mix grows more complex). Rates are re-centering as a key risk factor with a new Fed Chair taking the reins amid resurgent inflation. Finally, we are keeping a close eye on the U.S. consumer as higher inflation and lower purchasing power have the potential to generate lagged pressures in 2H26…
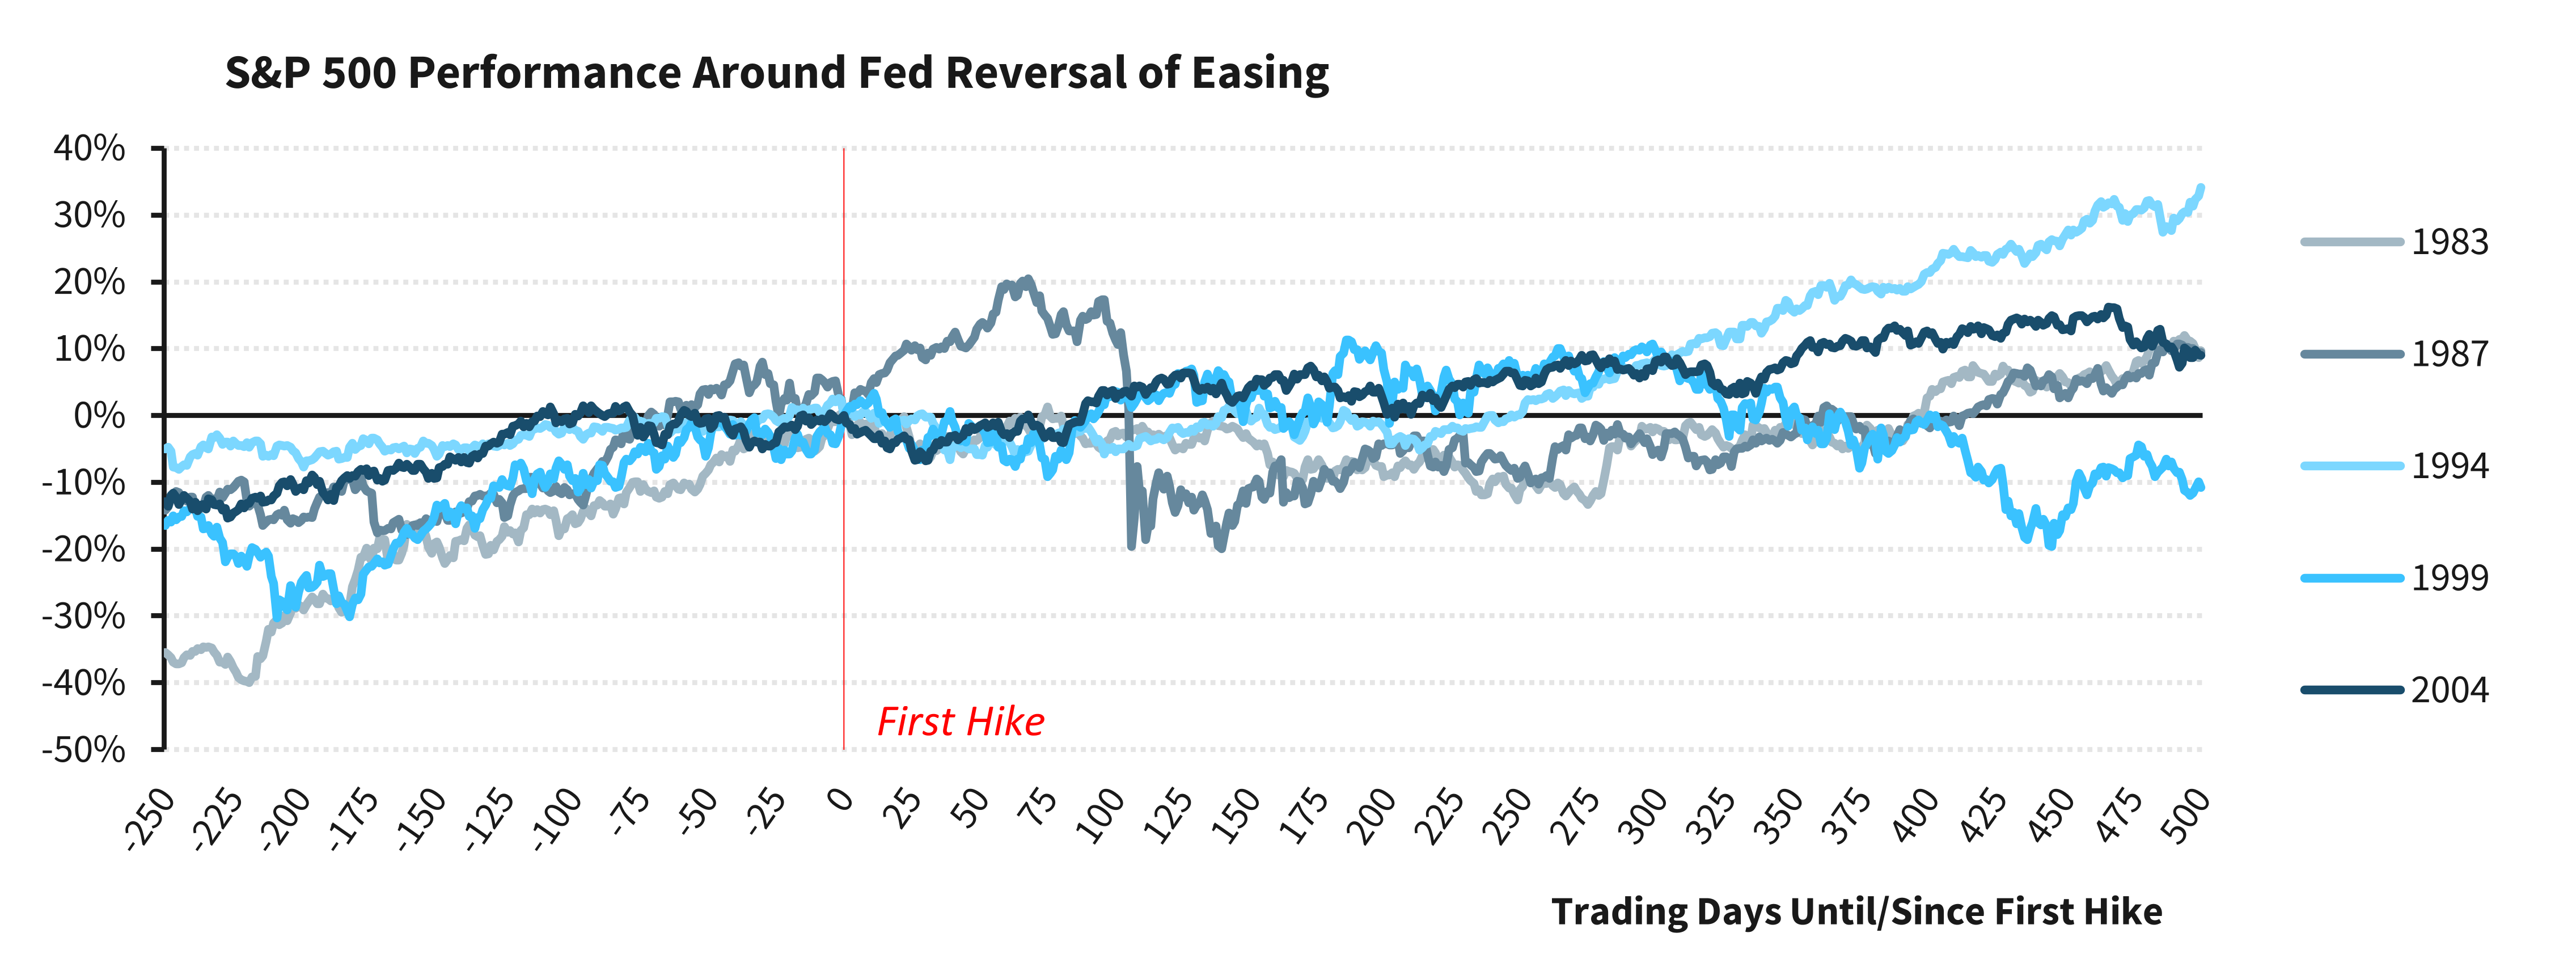
…This makes the path of interest rates from here especially consequential. Even in an environment of broadly stable growth, upside surprises in inflation could challenge the durability of the recent rally if they lead to a durable repricing of the policy path. Markets are already assigning some probability to additional Fed tightening by year-end, at odds with our more benign baseline expectations for policy. While the historical record surrounding Fed "reversal of easing" suggests that the mere prospect of the Fed resuming hikes has not typically derailed equities ahead of the event, the weeks and months following the event could be a different story.
Figure 3. The prospect of resumed hikes has not typically derailed equities ahead of the event
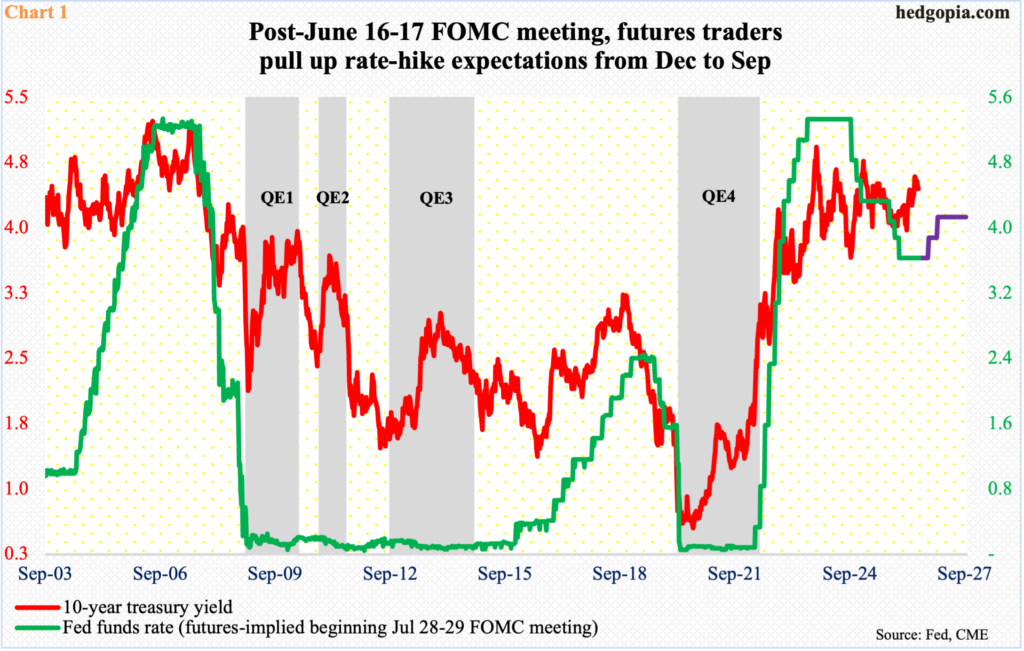
…The federal funds futures market is now fully pricing in a 25 bp rate hike by the September 16 FOMC meeting. At one point during today’s session, the market was pricing a 43% probability of a rate hike on July 29 – up from 6% before last week’s FOMC meeting. While a small, non-zero probability of a rate hike next month is fair, we’re skeptical that the Fed will have sufficient cover to raise rates as soon as July 29. Frankly, we’d view odds above 1-in-3 as stretched given the facts as they currently stand. Sure, Warsh didn’t explicitly rule out a rate hike in July, but he also didn’t give the impression that Fed action is imminent. When asked why the Fed didn’t hike on Wednesday, Warsh said, “That judgment you expressed was not expressed by any of the 19 people around the table. We’ll be meeting in six weeks and we’ll take up the issue again.” After all, half the Committee penciled in at least one rate hike for 2026, yet the Committee voted unanimously to keep rates steady in June…
…Technical Analysis 2s – Daily and weekly stochastics have crossed in favor of lower rates in the 2-year sector. Should we see another leg lower in rates, 4.0% is first resistance. Through there, 3.984% represents the Bollinger Band bottom and the lower-bound of the local trading zone. Below, 3.935% is the 50-day moving average, then we see an opening gap at 3.906% to 3.885%. Conversely, first support is a volume bulge around 4.10%, then the Bollinger Band top at 4.164%. Overhead, the fresh 16-month high reached on June 8 at 4.197% comes into view just before 4.20%…
Hawks in charge (and an early look at June #extensions — less than avg) …
Fed hike bets lifted USD and UST yields; US-Iran progress weighed on oil; UK politics settled around Burnham; AI mega-cap weakness hit indices; COP outperformed; DXY at 101.01 (+0.2%); US 10y at 4.51 (+5.6bp).
…US rates sold off across the curve as investors continued to price a more restrictive Fed reaction function after Chair Warsh’s debut. The move was broad, with the belly and long end rising in similar magnitude (2y: +5bp; 10y: +6bp; 30y: +5bp). The sell-off held even as oil prices declined, suggesting the dominant impulse came from policy-rate expectations rather than the energy channel. Treasury supply and a busy investment-grade calendar added to duration pressure. Breakevens fell despite the nominal sell-off, led by the front end, as lower crude prices reduced near-term inflation compensation…
Extension in Eurogovies at 0.05y; USTs to extend 0.04y, below the June average; UKTs to contract by 0.02y, below the June average; Eurolinkers extend by 0.02y, in line with June average of 0.02y; TIPS to contract by 0.03y, vs. the June average of 0.0y. JGBs to extend by 0.13y.
Key takeaways
June extension for the Eurozone index is estimated at 0.05y, above the historical June average of 0.04y.
Belgium is set to extend the most at 0.29y, followed by Italy (0.07y) and Netherlands (0.06y).
TIPS are expected to extend by -0.03y, with the 1-5y sector extending by 0.06y, driven by the re-issuance of 5y TIPS.
Notable sector-wise extensions in Belgium and Italy, largely due to bonds rolling out of the indices.
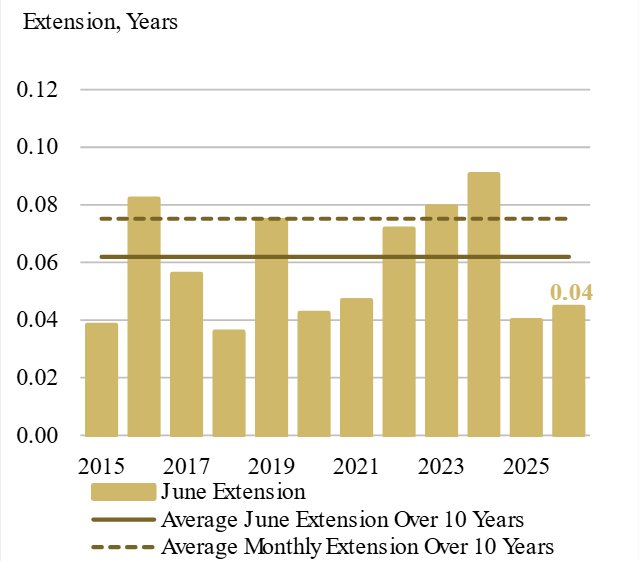
US nominal index is expected to extend less than its historical monthly average.
…US We expect the 1y+ UST index to extend by 0.04y, compared to an average June extension of 0.06y and an average monthly extension of 0.075y – Exhibit 8. A total of US$293 bn of supply (offered amount) will affect the extension, and the monthly issuance of 2y, 3y, 5y, 7y, 10y, 20y, and 30y will affect the respective maturity-wise indices. Multiple bonds will fall out of index, with a combined value of US$232bn.
In the context of the US-Iran MOU, we lay out key areas of uncertainty, routes for re-escalation, and signposts for implementation. Impacts are minimal to our economics & asset class views, but earlier Strait normalization vs. our outlook baseline should be marginally constructive across the board.
US Policy: US-Iran MOU in place for 60 days, but we see execution risk. For midterms, we see a slight buffer vs. a previously-worsening GOP position heading into November
Oil: The MOU should facilitate 50% of lost production back by September, 80% by December, but a physically tight market in the near term drives our forecast of $90/b for 3Q26
Global Economics: The US-Iran MOU and reopening of the Strait in mid-June are modestly constructive for the global economics outlook, but they do not materially alter our baseline
Cross-Asset: The MoU reinforces our constructive stance on risk assets. We maintain ourrecommendation for an OW in stocks, UW in core fixed income, EW in other fixed income, EW in commodities, and EW in cash
US Equities: We view the agreement as a near-term positive, primarily through lower oil-price risk, reduced inflation pressure, and improved market sentiment
EU Equities: We think SoH reopening is only partially in the price, as our SoH reopening stock screens have outperformed the index since the deal news but have only just begun to break out of their recent range
China Equities: Lower oil prices following the US-Iran MOU are positive in absolute terms but likely less supportive in relative terms
US Rates: We think the market is pricing too much weight on hawkish Fed tail risks, which seemingly discount oil price declines since the MOU & overweight investor optimism around US growth
USD: The US-Iran MOU is directionally supportive for our expectation for further USD weakness as it improves risk appetite and could enable a rotation within risk currencies
…UW core fixed income (-3% versus benchmark): We reduce USTs to EW and add to EGBs, leaving our overall government bond allocation OW. Our rates team forecasts stronger performance for EGBs vs USTs, with risks skewed towards lower yields for DBRs. While we have USTs at EW, we note that our macro team argues for investors to focus more on curve performance rather than outright duration. We keep our large UW in US IG as risks to spreads from AI-related issuance should weigh on performance. That said, we add to EUR IG given the better technicals for that market versus the US; excess returns are positive and total returns benefit from duration outperformance…
VOLmaGeddon … but far away so didn’t really happen …
23 Jun 2026 UBS: Equity volatility, economists’ indifference
Technology equities exhibited some volatility overnight (South Korea’s markets falling quite noticeably). This is not caused by shifting economic expectations, allowing economists to exhibit indifference. It is too soon to be talking about wealth effects, and for now, consumers’ desire to consume should outweigh any consequences of market volatility.
The situation in the Strait of Hormuz is about as transparent as the Lincoln reflecting pool, with the Financial Times reporting confusion amongst shipowners about whether to follow Iranian or US instructions on transiting the strait. The result is a slow increase in shipping volume, but investors were not expecting a rapid normalization…
Finally, FEMO … effort to push this one continues, am not a fan but lets see where it goes …
Jun 22, 2026 Yardeni: FEMO Lifting Economic Growth & Foreigners Lifting US Stocks
In the spectrum of bullish stock markets, there are two polar opposites. The first is driven by FOMO, the Fear of Missing Out, which inflates P/E multiples as investors chase hope and hype rather than fundamentals, creating the conditions for a bubble. The second is driven by FEMO, or Fabulous Earnings Momentum, which works the other way around: Corporate earnings grow faster than stock prices, compressing P/E multiples rather than expanding them, and analysts raise their estimates because the fundamentals justify doing so.
The current bull market has been in the middle of the spectrum, but has moved more toward the FEMO variety this year. It is being driven by real, measurable, and record corporate profits. And it is lifting not just stock prices but the entire economy. Consider the following:
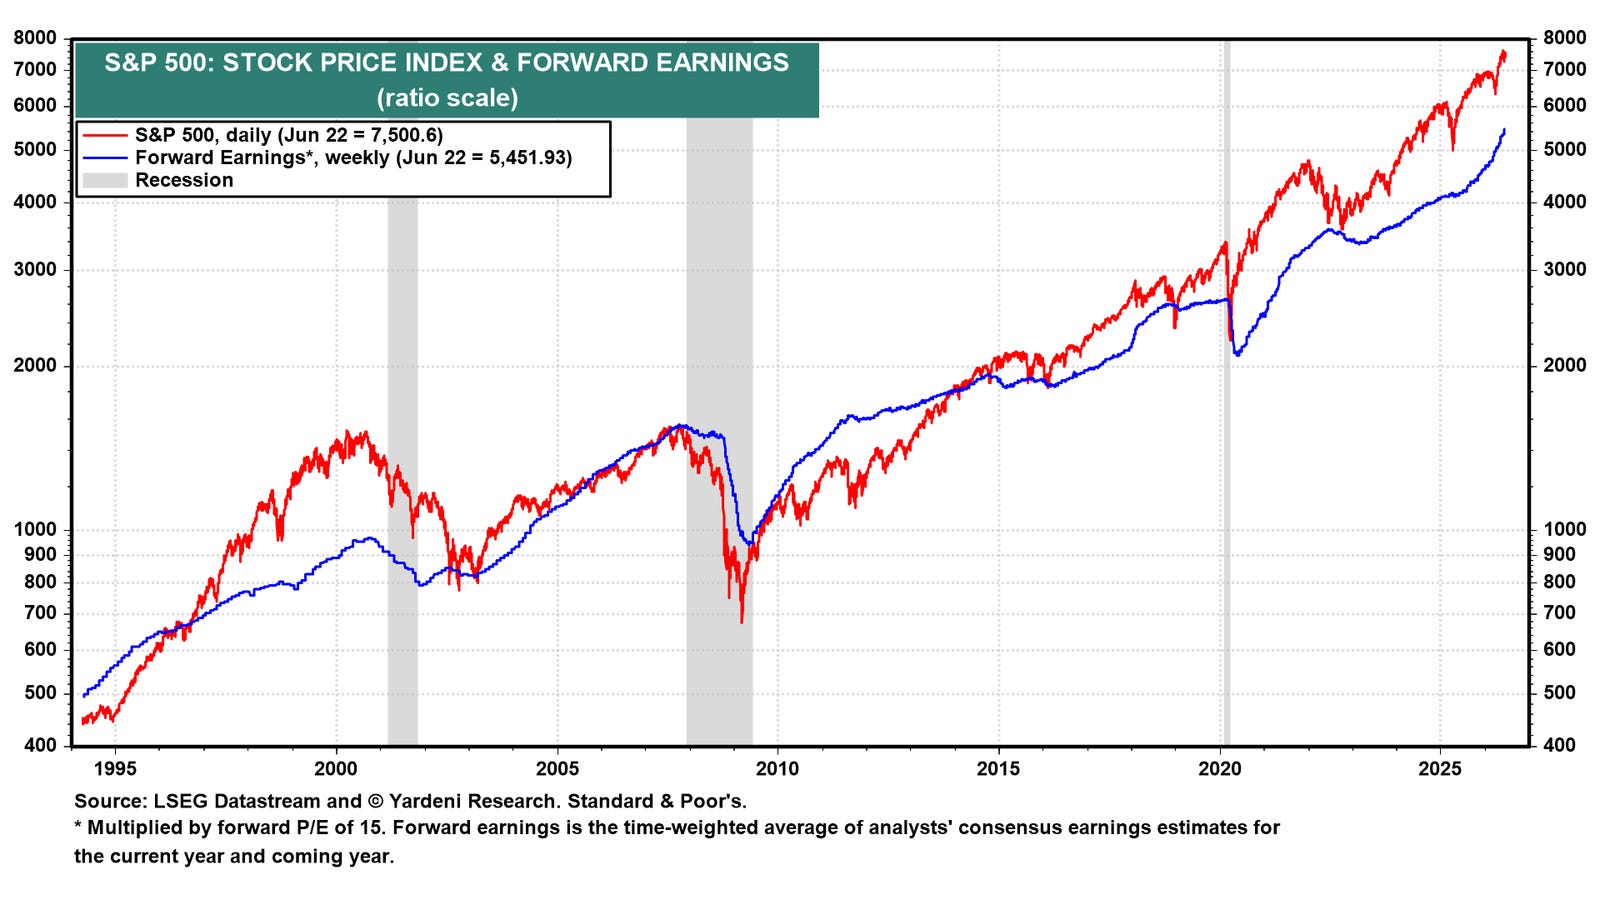
(1) FEMO & the Index of Coincident Economic Indicators. S&P 500 forward earnings multiplied by a constant forward P/E of 15.0 tracks the S&P 500 price index remarkably well over time (chart). The two series have moved together through every cycle since the mid 1990s, confirming that earnings drive the stock market. Since the bull market began in October 2022, the S&P 500 has risen above the forward earnings series multiplied by 15.0. That gap is multiple expansion: Investors are paying more per dollar of forward earnings as confidence in the upward trajectory has solidified.
The current bull market has been driven by rising forward earnings and also by multiple expansion. The index is up 105% since October 22, 2022, while forward earnings is up 56%. However, this year, the index has been led mostly by FEMO.
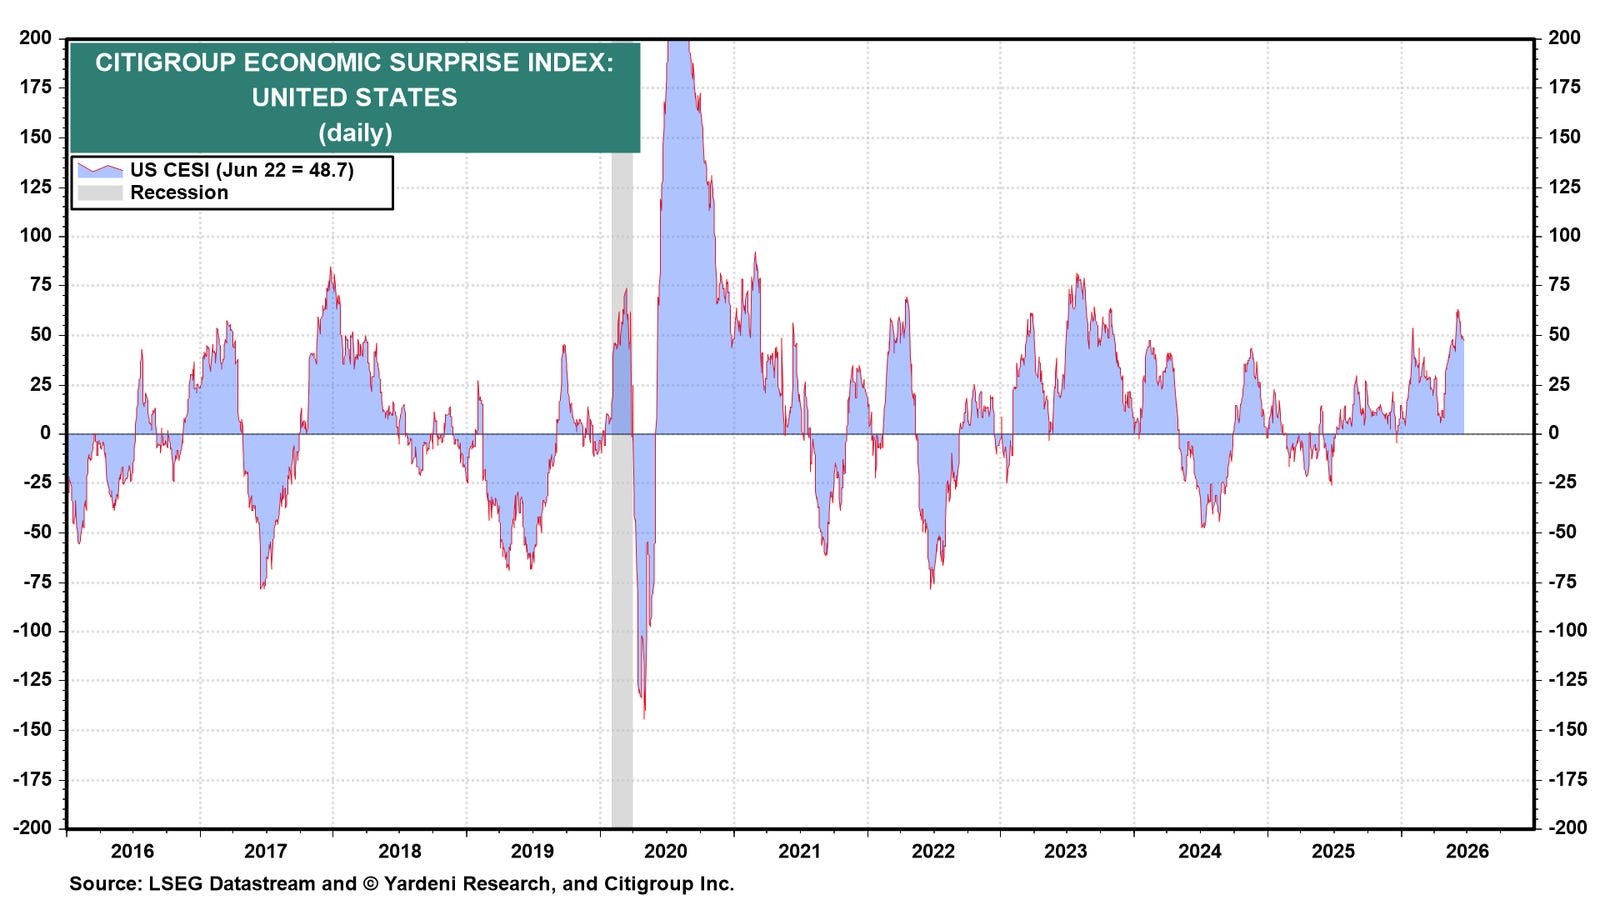
FEMO is lifting the economy through two channels. The first is the wealth effect: Rising stock prices increase household net worth, boosting consumer spending. The second is the profit channel: Profitable companies expand operations, hire more workers, pay higher wages, and invest in new productive capacity. Workers spend their wages, companies respond to demand, and a virtuous cycle takes hold. Both channels currently show up in the economic data. The Citigroup Economic Surprise Index stands at 48.7, firmly in positive territory (chart).
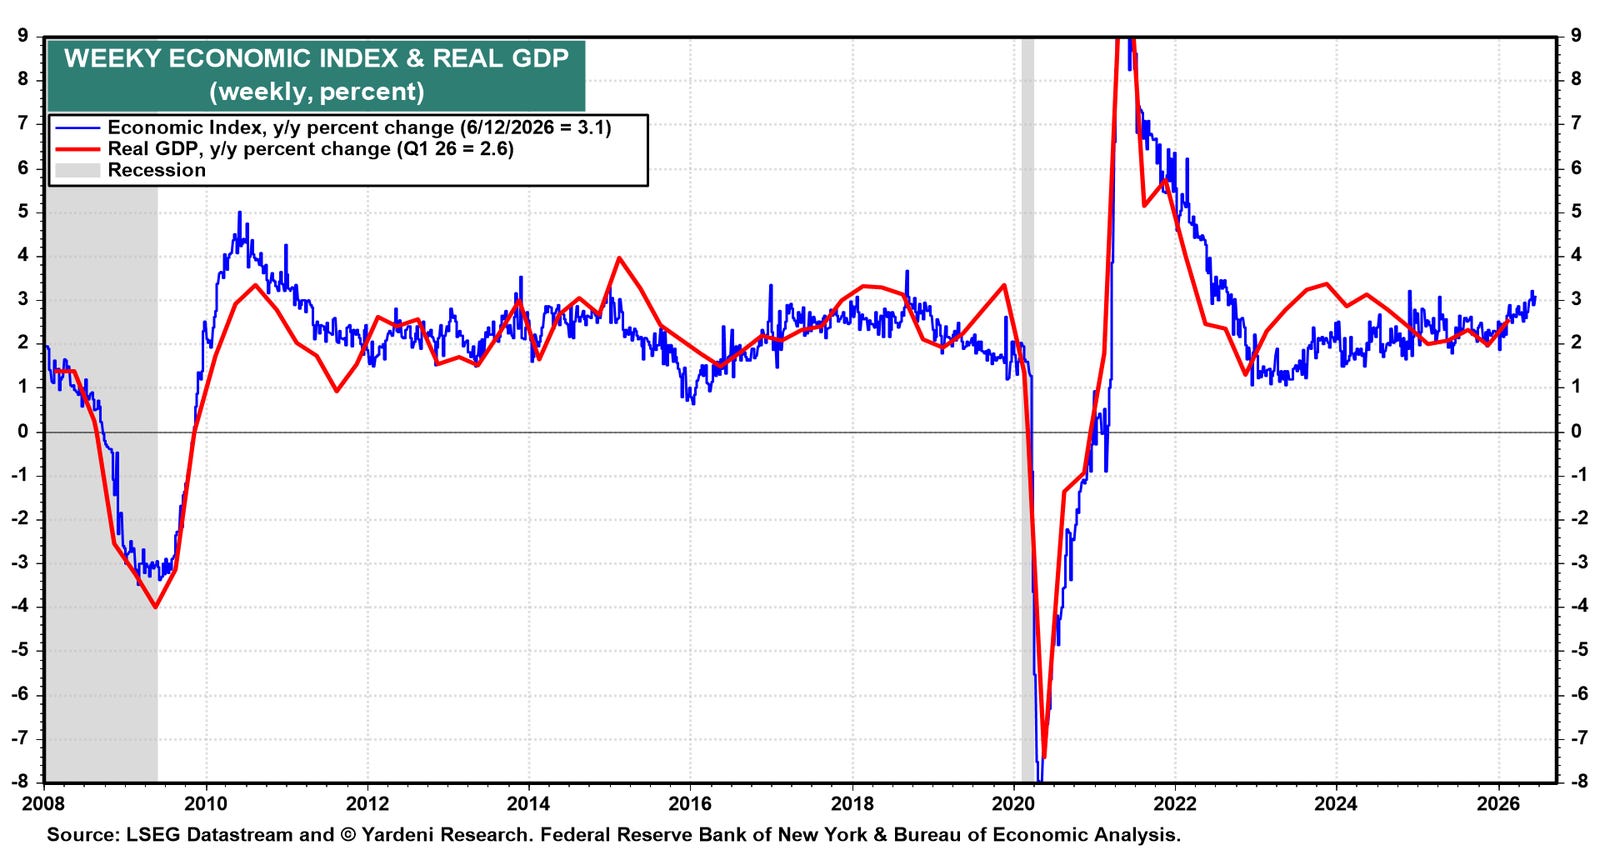
Meanwhile, the Weekly Economic Index has accelerated meaningfully, pointing to real GDP growth of around 3.1% y/y (chart)…
… Moving along TO a few other curated links from the intertubes. I HOPE you’ll find them as funTERtaining (dare I say useful) as I do … …
First up, the good Doctor SLOK opines on top 3 macro risks here / now …
June 23, 2026 Apollo: Top Three Macro Risks at the Moment
Here are the top three macro questions for investment committees today:
1) Middle East: What are the implications if some tanks reach critical levels somewhere in the world, including distillate fuels in the US? See the first chart.
2) AI: What happens if companies start limiting their token budgets meaningfully because they are only seeing weak ROI, and as a result, compute demand either slows down or shifts to Chinese models? See the second chart.
3) Inflation outlook: With inflation trending higher, what are the implications for equity and credit markets if the Fed hikes in September and December, as currently priced in fed funds futures? See the third chart…
Very little i’ve stumbled across on AG … chart on THE CONUNDRUM one of my favs … nothing special just speaks to me …
June 23, 2026 at 4:00 AM UTC Bloomberg: Greenspan’s legacy is as convoluted as his words His reputation no longer lies in post-crisis tatters, but should it inspire Trump 2.0?
…Treasury Secretary Scott Bessent has resurrected Greenspan’s decision to keep rates low as the bull market boomed in the late 1990s, with the aim of bolstering the case for rate cuts now:
The Fed needs to have merely an open mind. The open-mind maestro, former Fed Chairman Alan Greenspan, resisted premature rate hikes during the technology boom of the 1990s — and history proved him right.
Has it? Here is a first take, in charts.
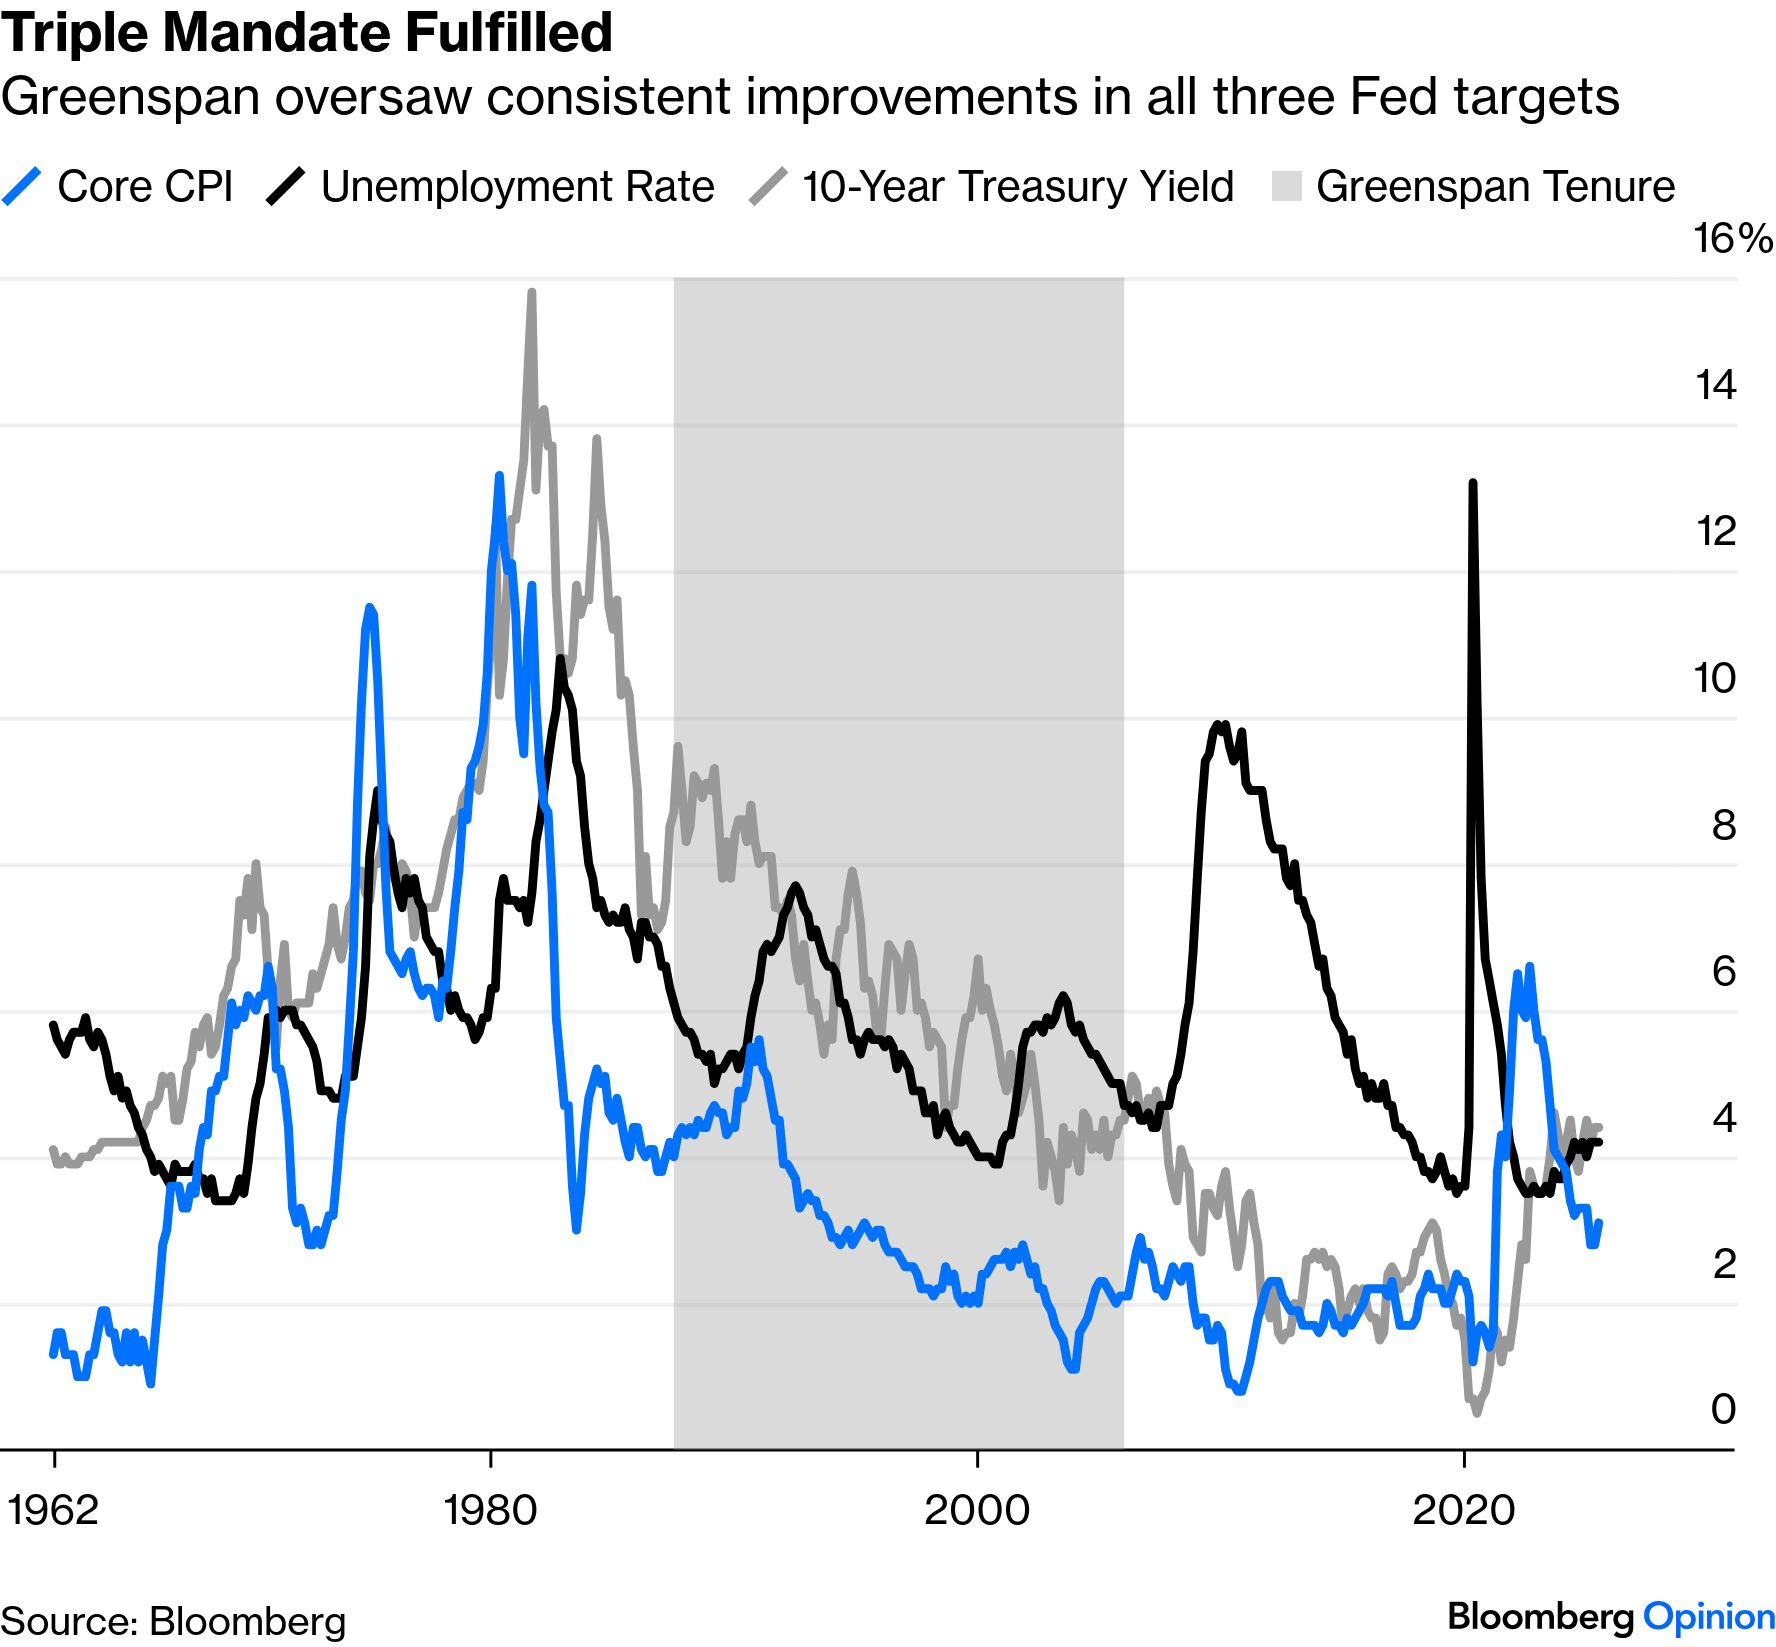
The Mandate
It’s indisputable that the Greenspan Fed fulfilled every part of its mandate of 1) low inflation, plus 2) low unemployment, with 3) low long-term interest rates. All three improved during his chairmanship:
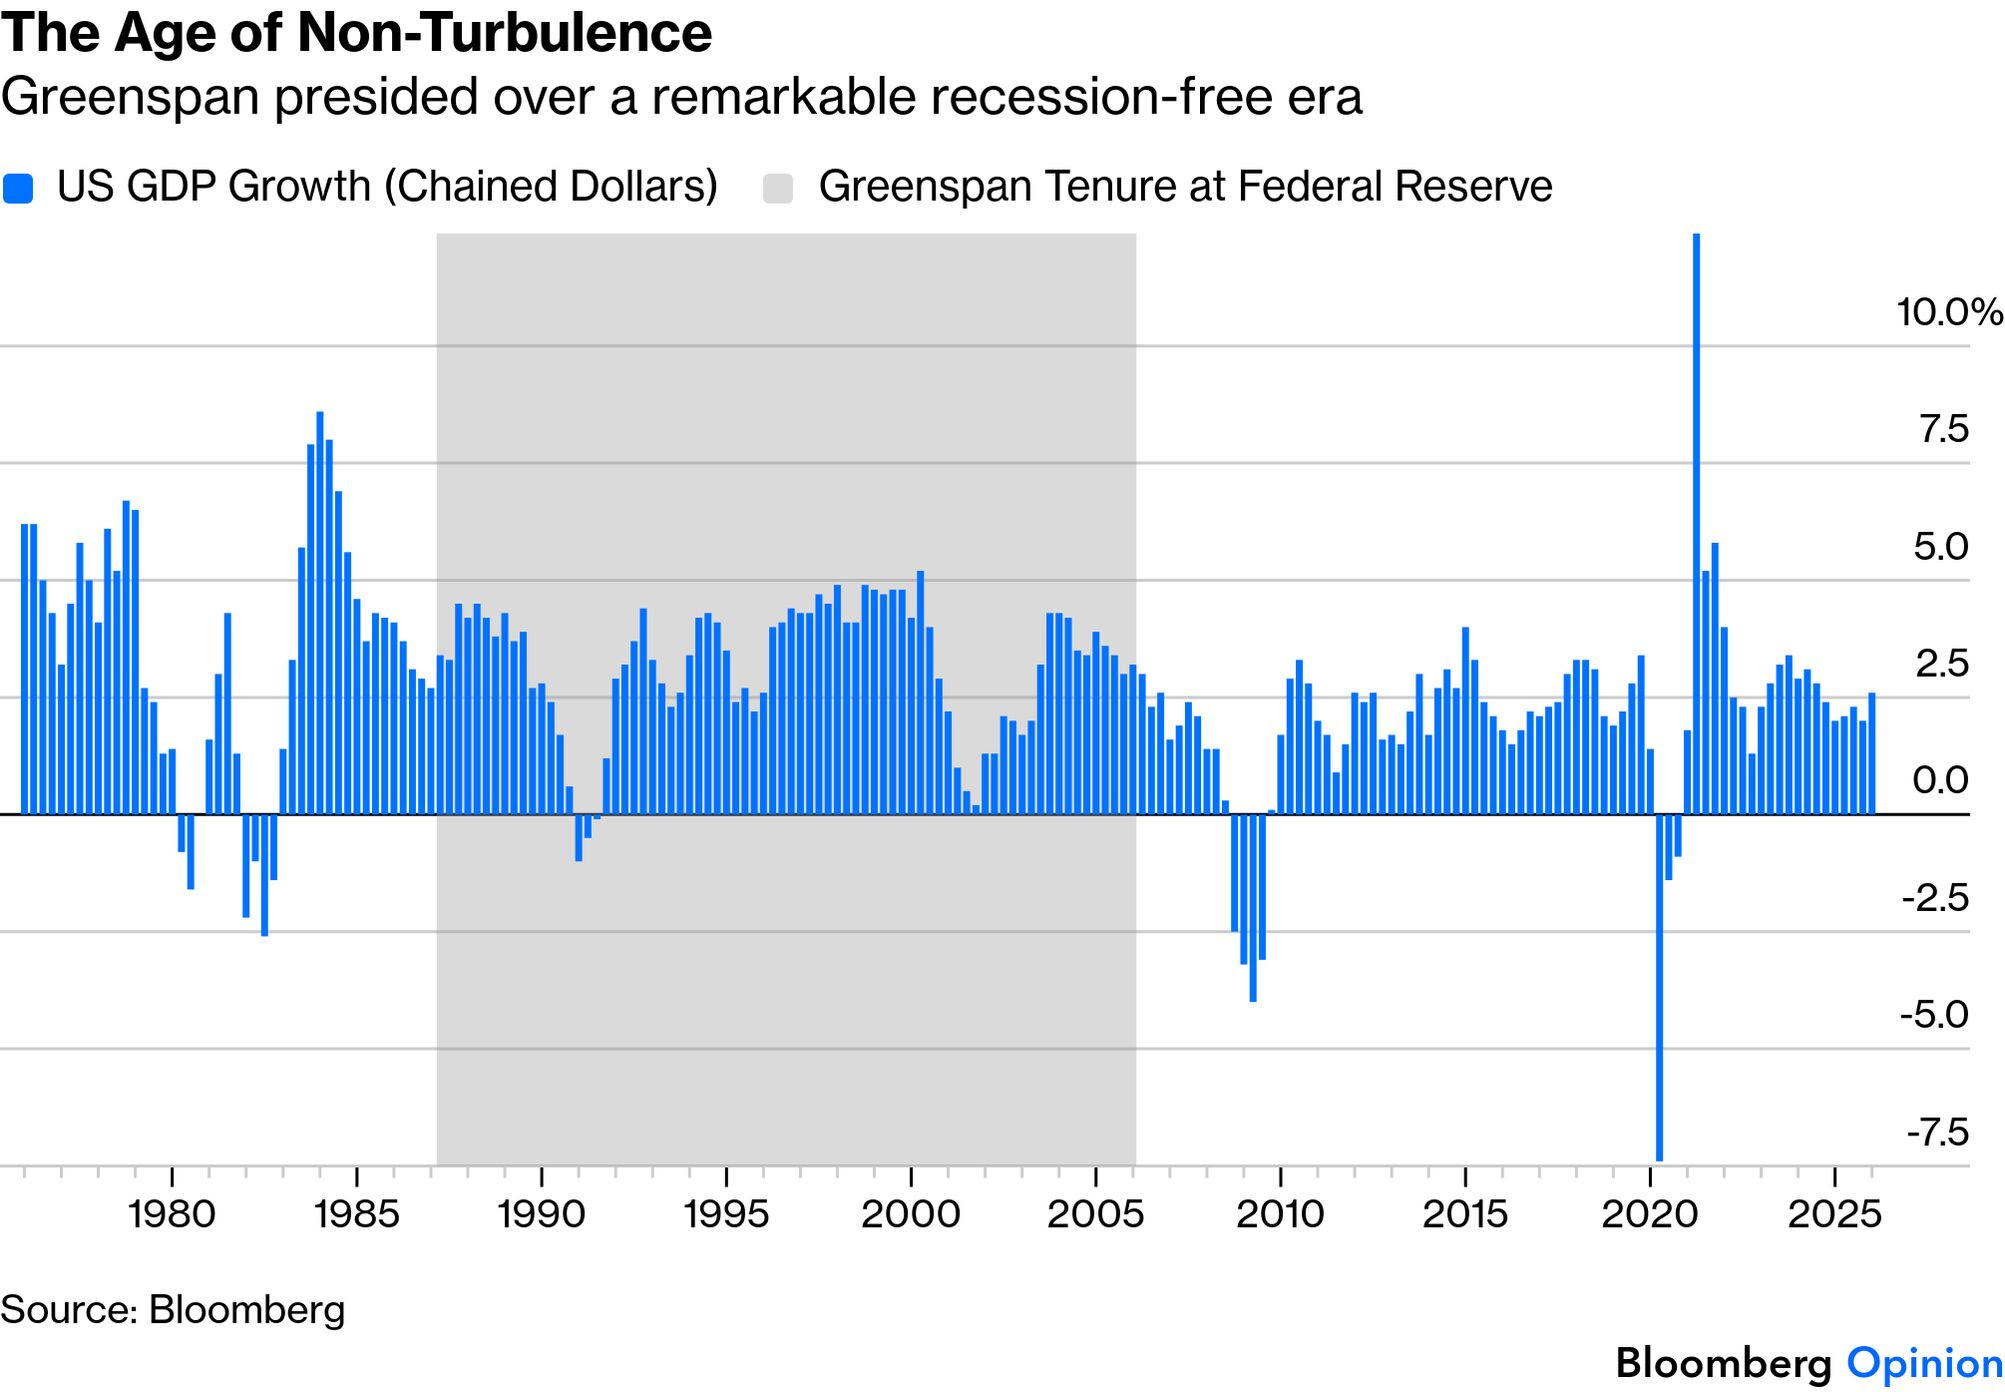
The Economy
Greenspan’s own memoir was called The Age of Turbulence, but US economic growth was anything but turbulent. Apart from a brief and shallow recession after Saddam Hussein’s invasion of Kuwait in 1990, the Greenspan Fed managed to avoid a single quarter of falling year-on-year GDP, even after the dot-com bust. Productivity improved, thanks to factors beyond monetary policy (globalization, the advent of the internet, and an influx of Mexican migrants), and the Fed did nothing to thwart it:
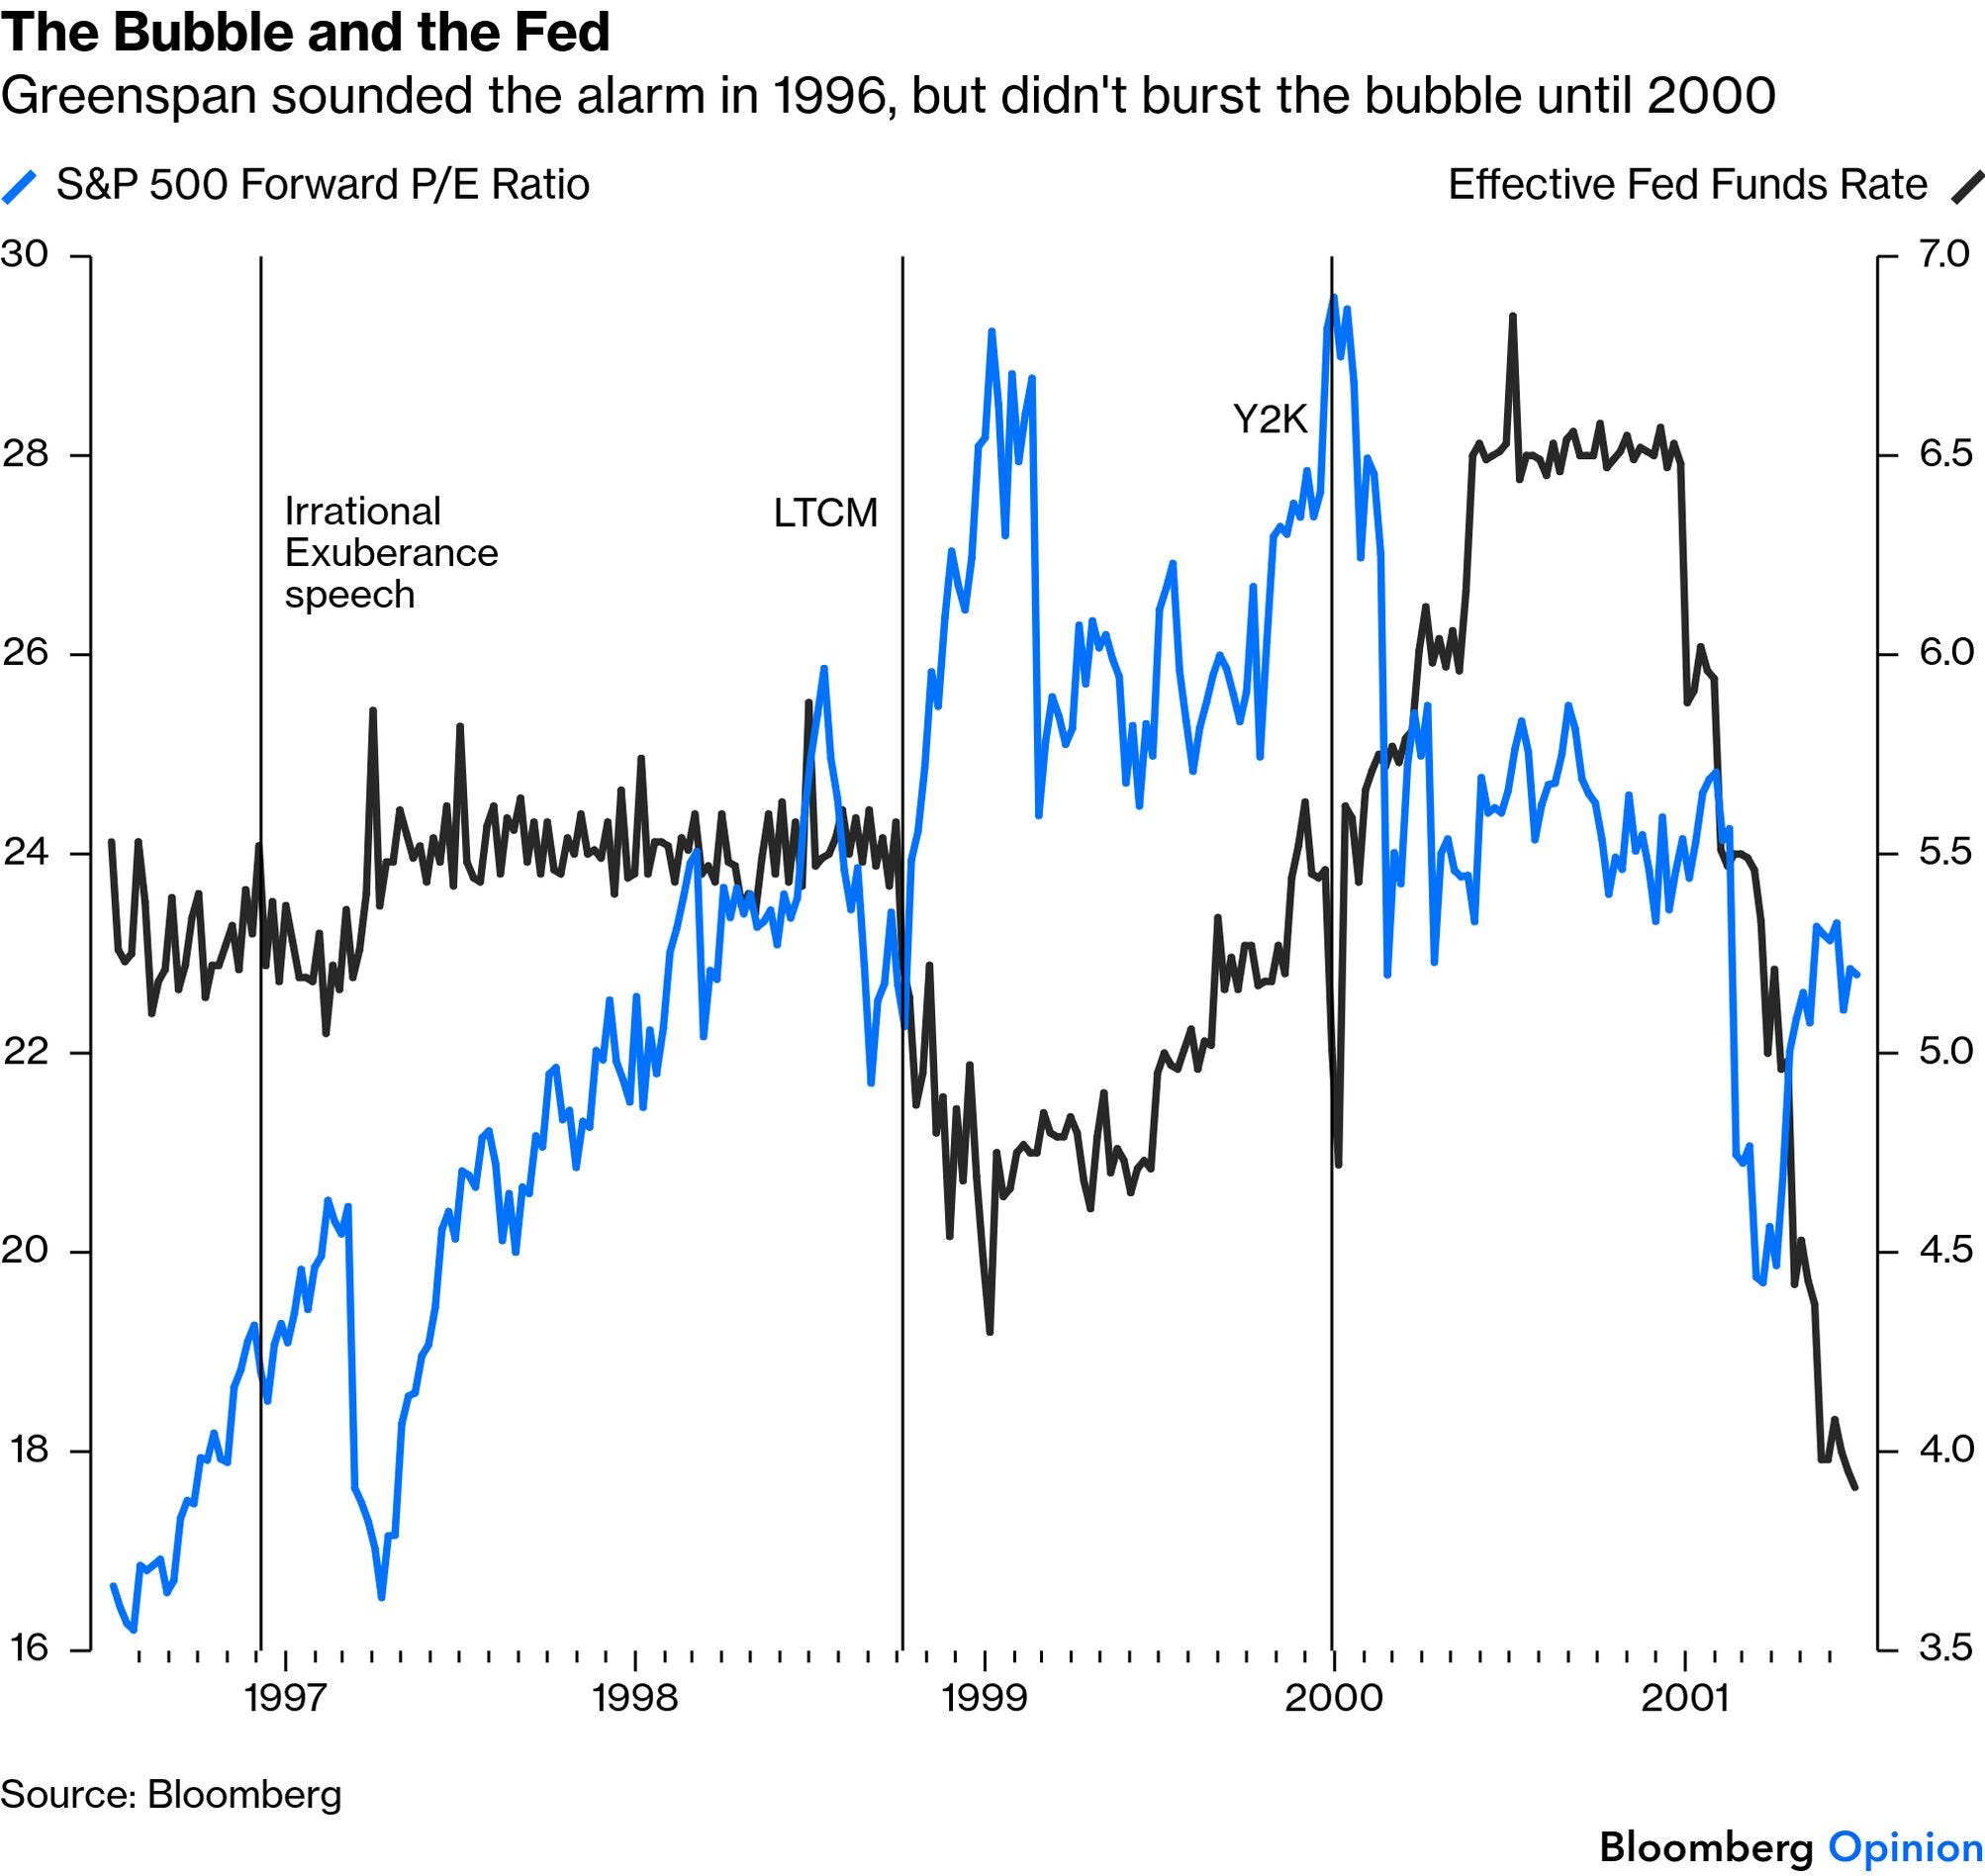
The Bubble
The turning point came a decade into his chairmanship. Until then, Greenspan was seen as a continuation of his predecessor, the inflation hawk Paul Volcker. He even provoked a bear market in bonds in 1994. In December 1996, he made a speech worrying about “irrational exuberance” in stocks, and followed with a rate hike that drove a brief correction.
But then he mused publicly about whether there was a “new economy.” In the fall of 1998, Russia’s debt default caused the meltdown of the Long-Term Capital Management hedge fund. Greenspan blinked, organized a bailout for LTCM (to Volcker’s public disgust), and cut rates. A stock market that looked to have peaked instead melted upward. In late 1999, worried by the “Y2K bug,” the Fed pumped more liquidity, before finally cutting off the spigot and bursting the bubble. Then it drastically reduced rates again. Has history really proved Greenspan right about this, as Bessent suggests?
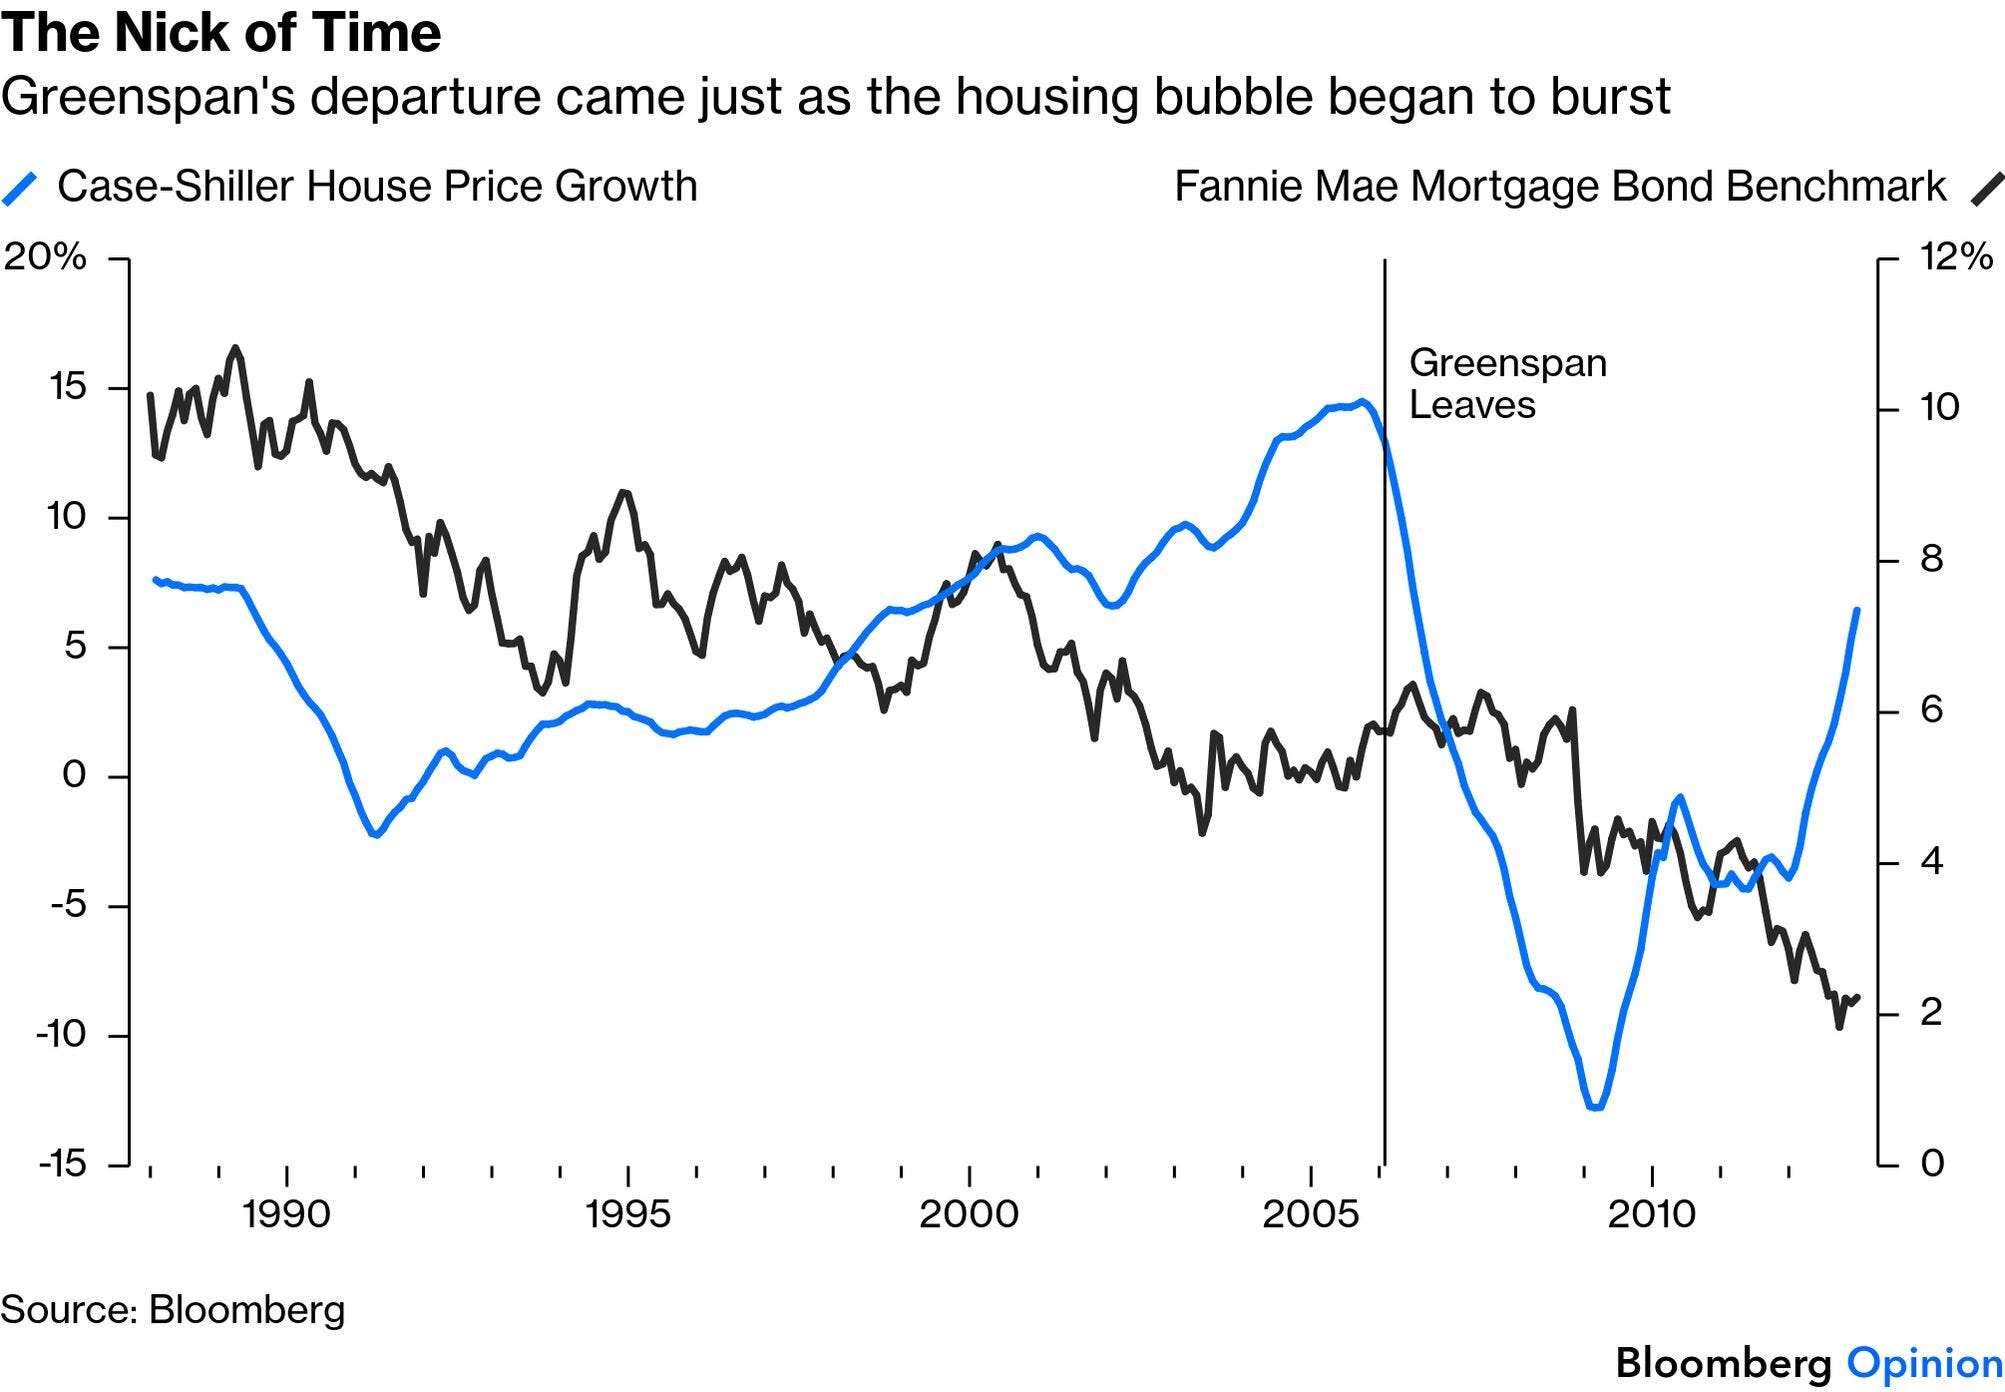
Another Bubble
Money is fungible. Funds to ease the economic impact of falling stock markets found their way into housing finance. As mortgage rates continued to fall, a historic bubble in house prices formed, which peaked on the eve of Greenspan’s departure in 2006. Everyone knows what happened next:
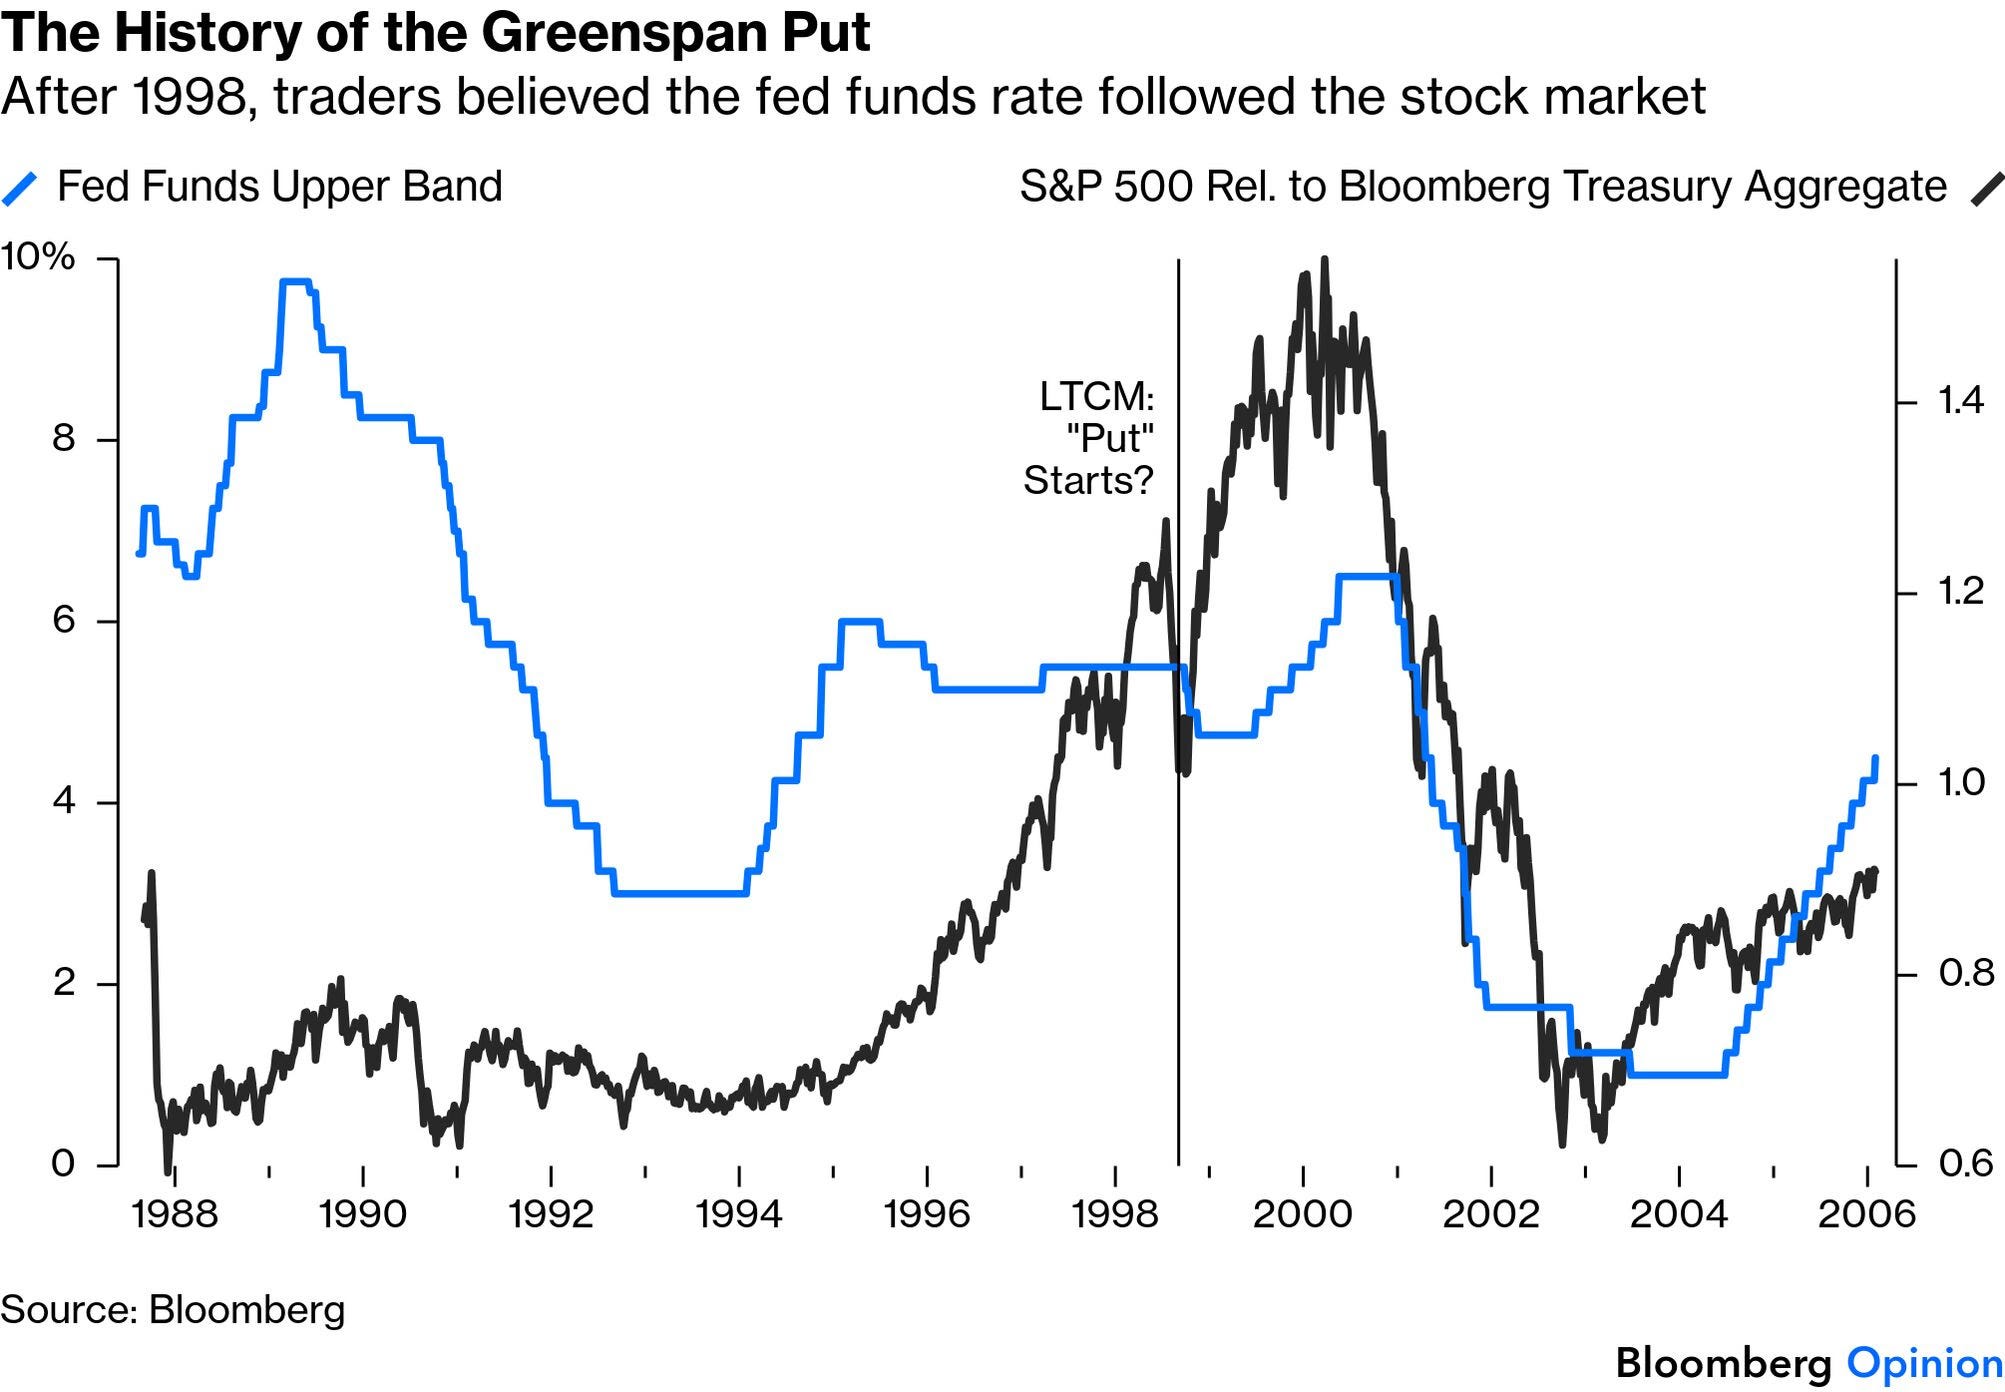
Moral Hazard
More damagingly, from LTCM onward a new phrase joined the market lexicon: the “Greenspan Put.” The idea was that 401(k)s and high asset prices in general had become so critical to the economy that the Fed would let the stock market drive rates. And indeed, circumstantial evidence points that way. The sense was that any fall in stocks would be greeted by lower rates, and that created what’s known as moral hazard — the recklessness that comes when actors believe they will be bailed out from the worst consequences of their actions:
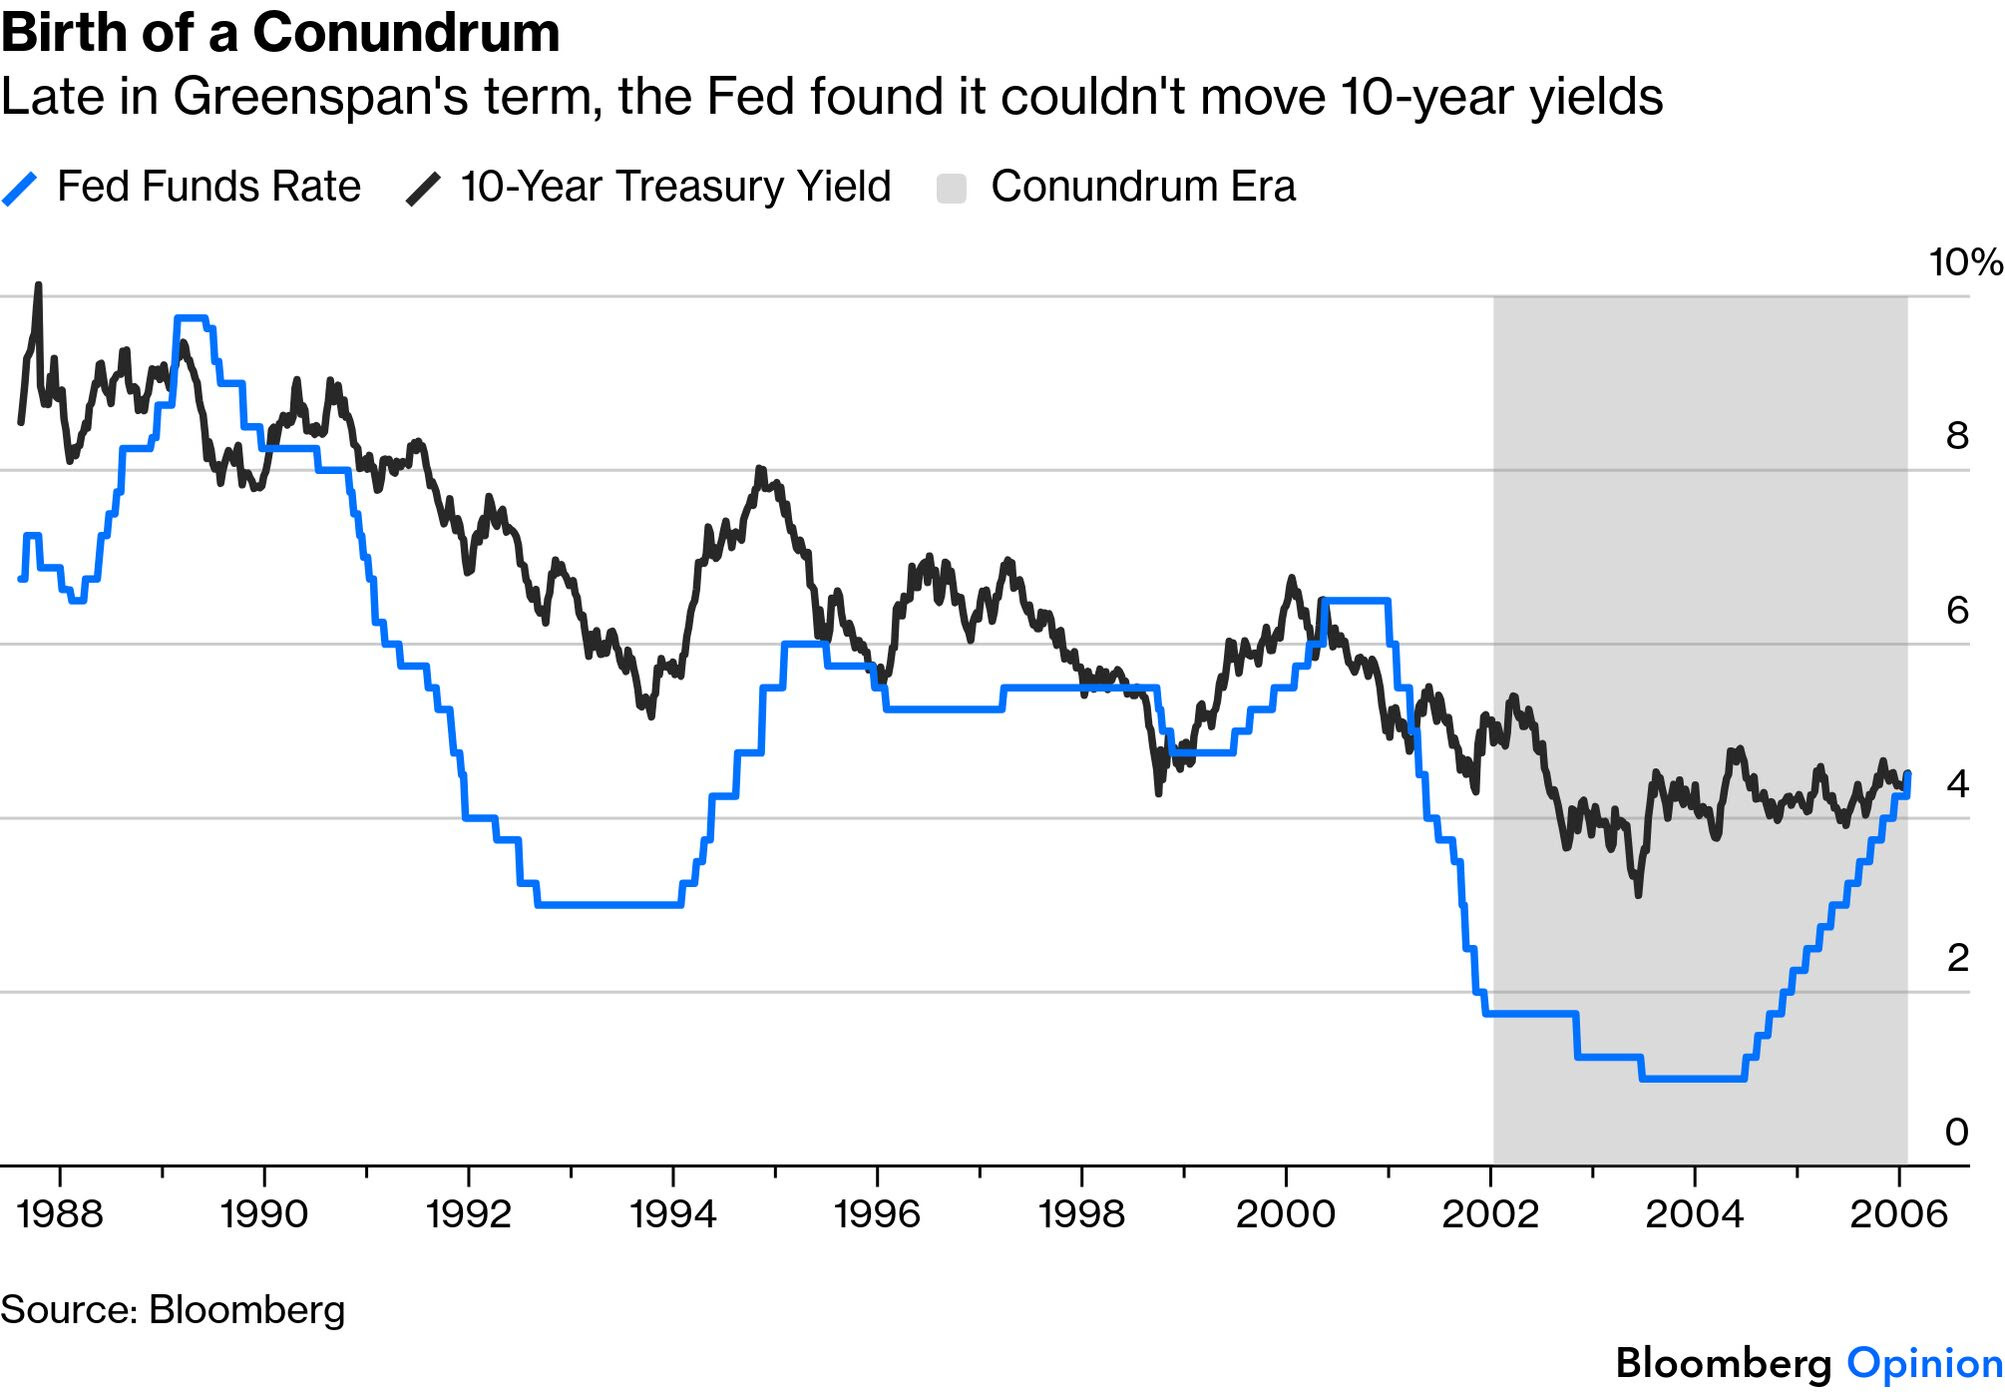
The Conundrum
Greenspan’s last years were dominated by what he labelled a “conundrum”; the Fed hiked short-term rates repeatedly, but the 10-year Treasury yield scarcely ever budged. That helped to exacerbate the housing finance bubble. That conundrum set in after China’s accession to the World Trade Organization in 2001. Its buildup of reserves, mostly in US Treasuries, didn’t help:
Greenspan was an extraordinary human being. His 100 years on the planet cannot be reduced to a few charts. But they make clear his legacy’s relevance to the world we now inhabit, and can structure a vital debate as Warsh takes his chair.
In 2000, when the economy was booming, the doyen of Washington journalists, Bob Woodward, published a book with the self-explanatory title: Maestro: Greenspan’s Fed and the American Boom. He asserted that all the roads to explaining the great American economy of the 1990s led to Greenspan. He was right about that. But did those roads lead from that boom to the ensuing bust? That’s the enduring question about Greenspan’s tenure and we still need to answer it.
Love me a good QE chart …
22 JUN 2026 Hedgopia: Warsh Fed To Focus More On Price Stability; Equities, With Huge Gains From Mar lows, Not Likely To Keep Tuning Out Risks Of Higher Rates
Post-FOMC statement last Wednesday, equities sold off, but only to recover quickly. Investors have been preconditioned to buy the dips, with repeated success. The difference this time is that prospects for higher rates are real.
Federal Reserve Chairman Kevin Warsh made it official – just about – that short rates are headed higher; rates on the long end of the yield curve have been higher than the lows of March. Warsh’s hawkish self was very much evident last Wednesday as the FOMC meeting he maidenly chaired concluded…
…Concurrently, margin debt just hit a new high in May. At $1.4 trillion, it was up a massive $111.3 billion month over month, coming on the heels of gains of $83.4 billion in April from the preceding month (Chart 5). Again, equities bottomed in late March, and the gains in the major indices since have come on the back of a massive rise in leverage, which incidentally cuts both ways.
Right now, leverage is on the side of the bulls, that is for sure. It has been the right trade to bet on the long side and do so levering up, but things will not remain this way forever. There will come a time when this trade reverses and the bears will take over, as margin debt contracts.
FINALLY, I’ve figured it out (ok, I didn’t but this dude did) … HERE’s the chart pattern etched out by SPCX price action … CFA and CMT level 8, amIright?
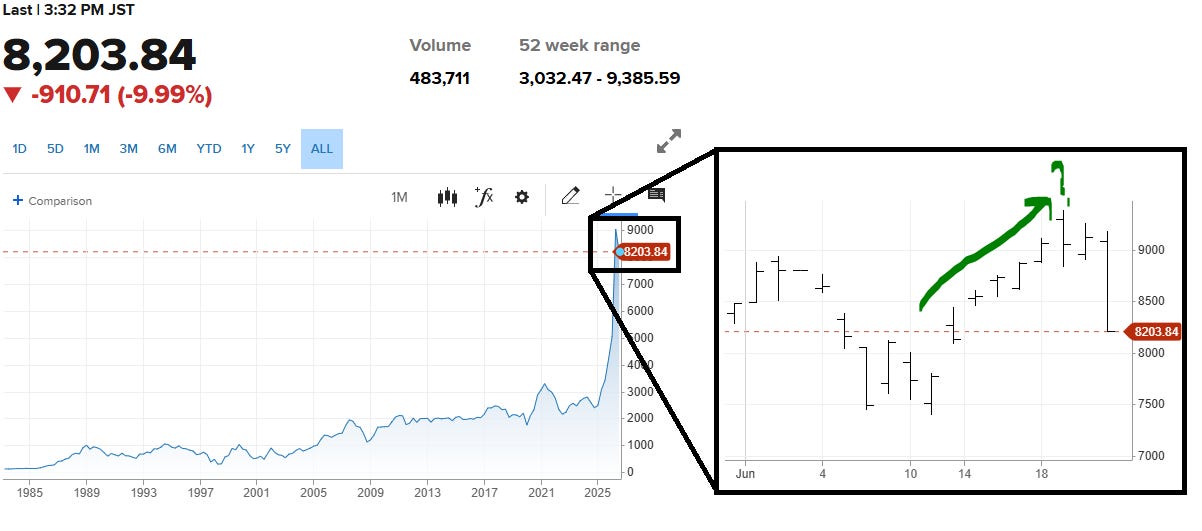


The KOSPI was up almost 100% this year.
About time they take some profits..