Good morning … ahead of this mornings ($58bb 3yy) #UpcomingAuctions
3yy DAILY: ‘support’ up nearer 3.60%, bearish momentum
… with that in mind, a few visuals from someone (CHARTbeat) with a terminal …
… AND moving away from #UpcomingAuctions focused back on stonks … here’s NOT why the stock market bounced yesterday BUT funTERtaining, at least IMO …
ZH: Inflation Expectations Rise Over Medium-Term As Delinquency Fears Unexpectedly Hit 4 Year High
… and by end of day, stocks BID, bond yields bouncing …
ZH: Stocks Bounce After Brutal Week Despite Apple Unveiling A Dud\
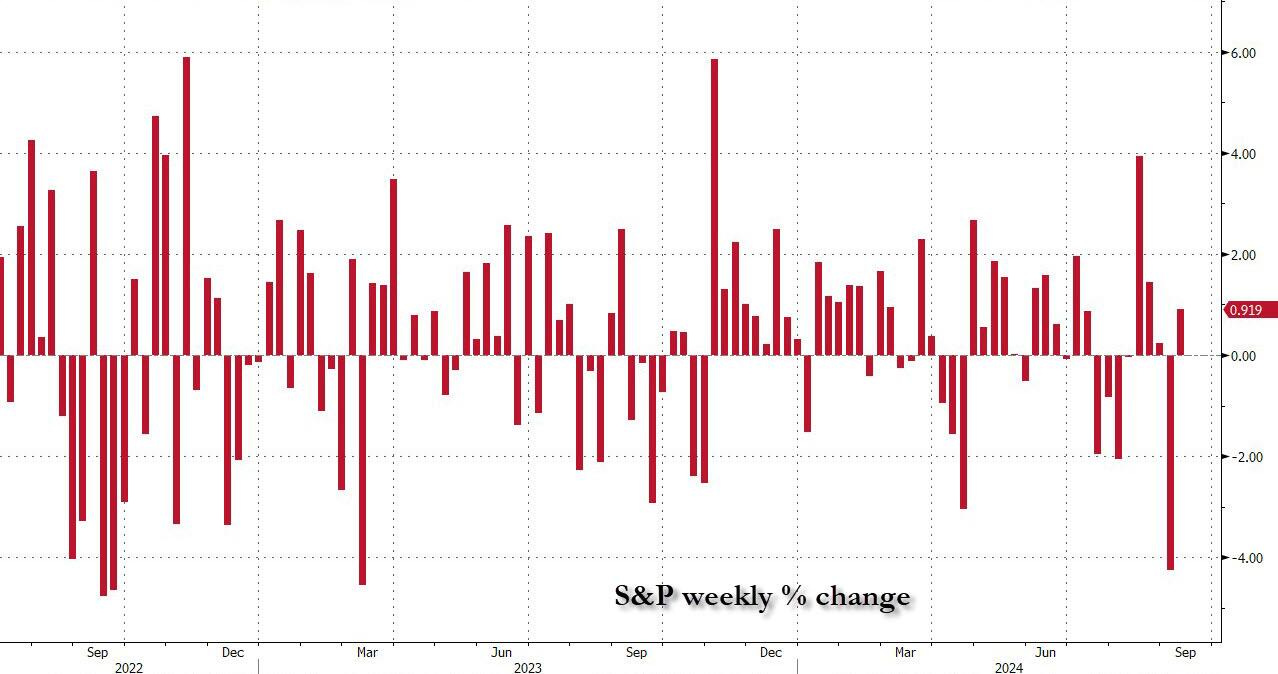
After the worst week for the S&P since the March 2023 bank crisis...
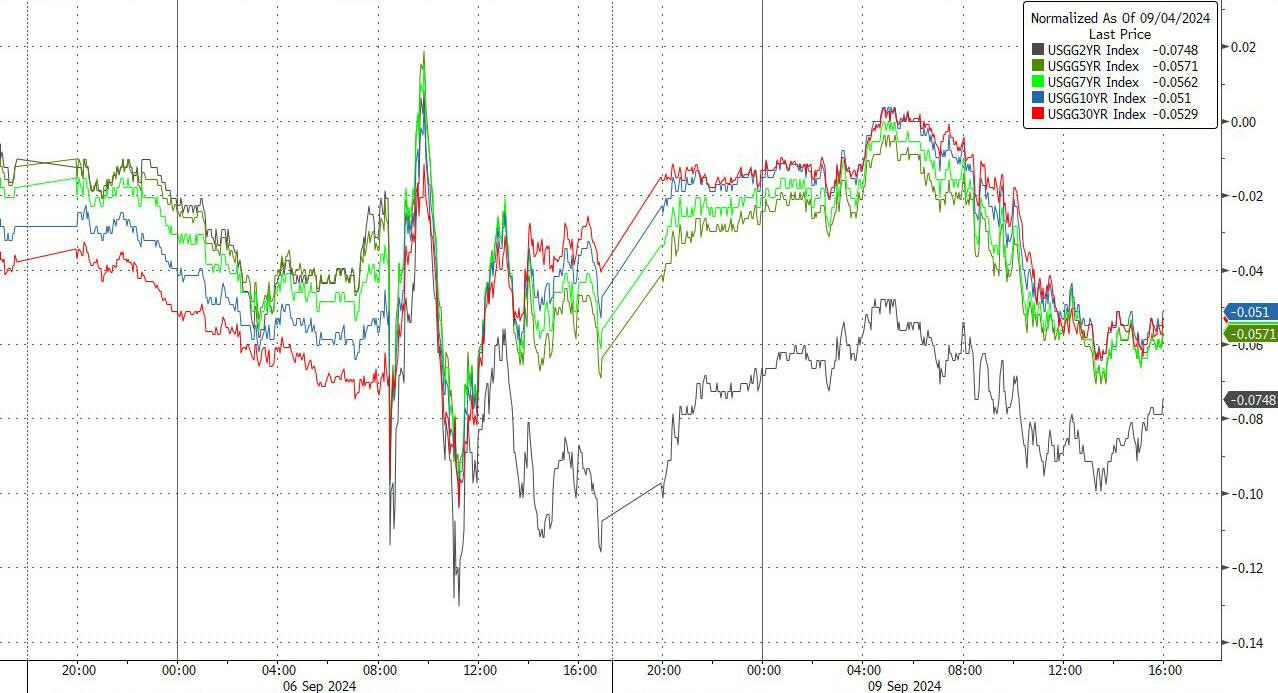
… While stocks staged a comeback, the rest of the market was quiet, with bond yields failing to rebound, and after rising in the early morning, yields gradually faded all day only to closer down on the day...
… and this written / noted B4 Consumer Credit data hit and so …
ZH: In "Last Hurrah", Credit Card Debt Unexpectedly Soars Despite Record High APRs As Savings Rate Hits Record Low
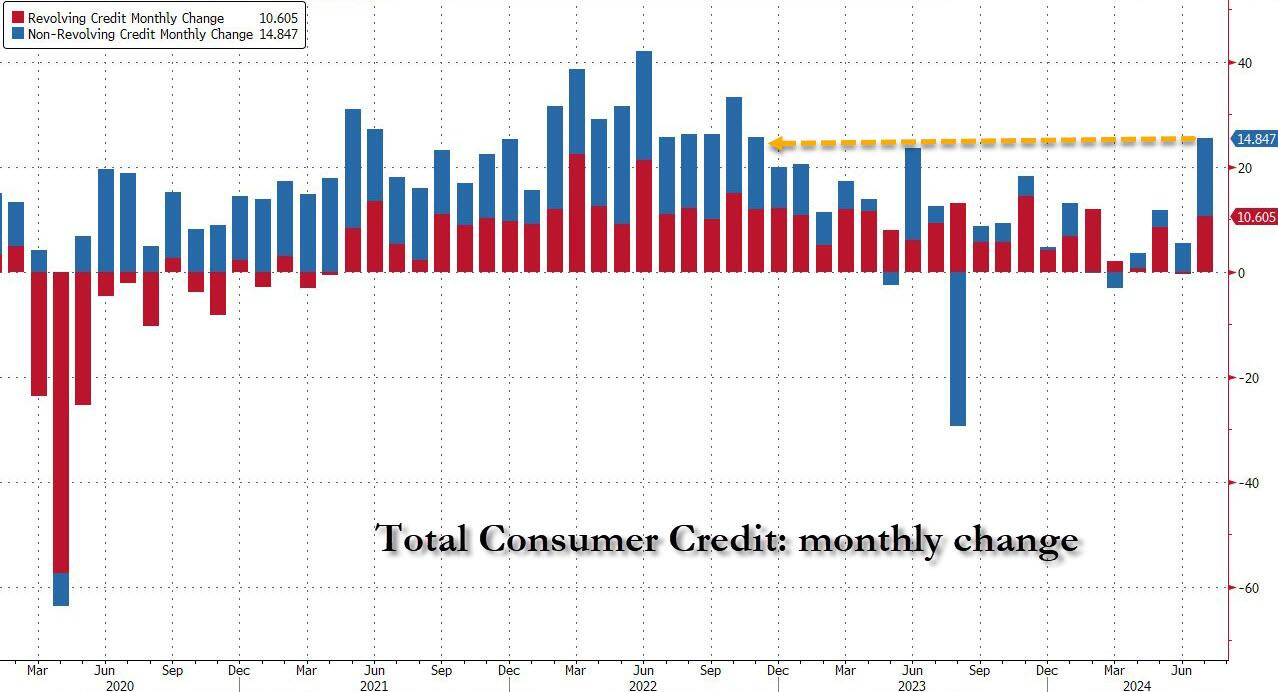
… But fast forwarding just one month later, when in a stunning reversal, July consumer credit growth unexpectedly reversed the dramatic June slowdown, and soared more than $25 billion, to a new record high of $5.093 trillion.
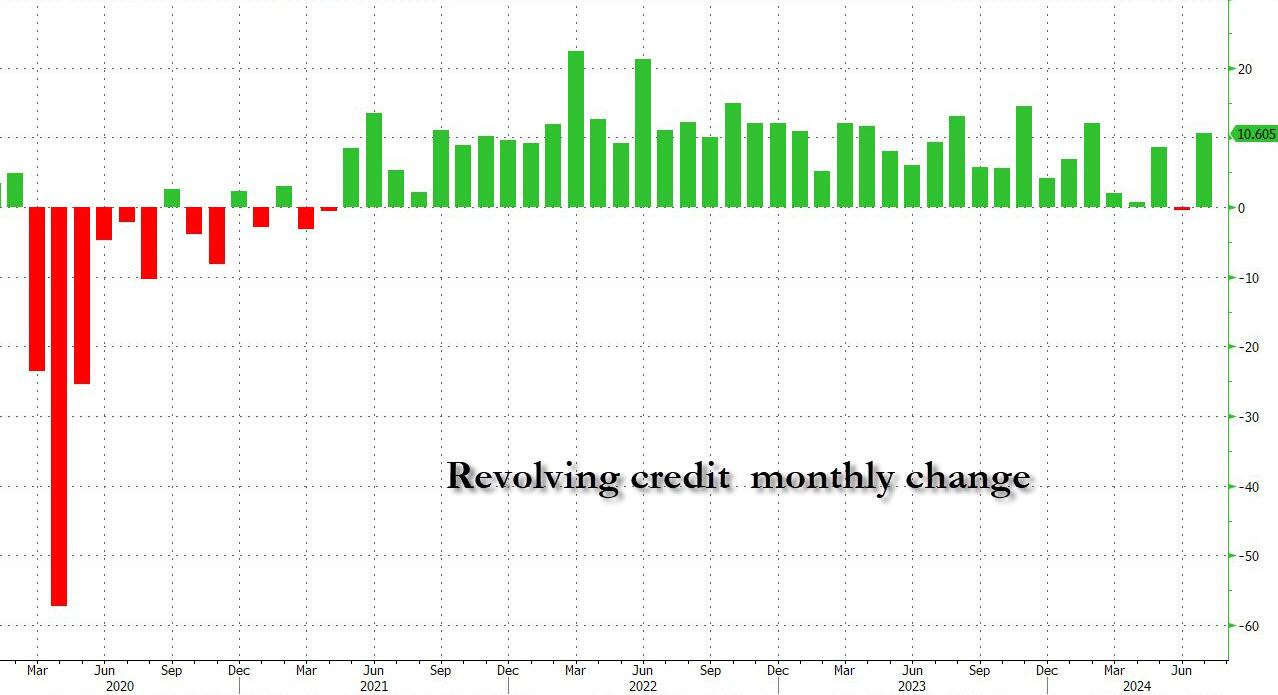
Looking at the components, the sudden spike in revolving credit was most notable as credit card debt growth suddenly reversed its recent slowdown, surging by $10.6 billion, the biggest monthly increase since February and the 2nd biggest of the year.
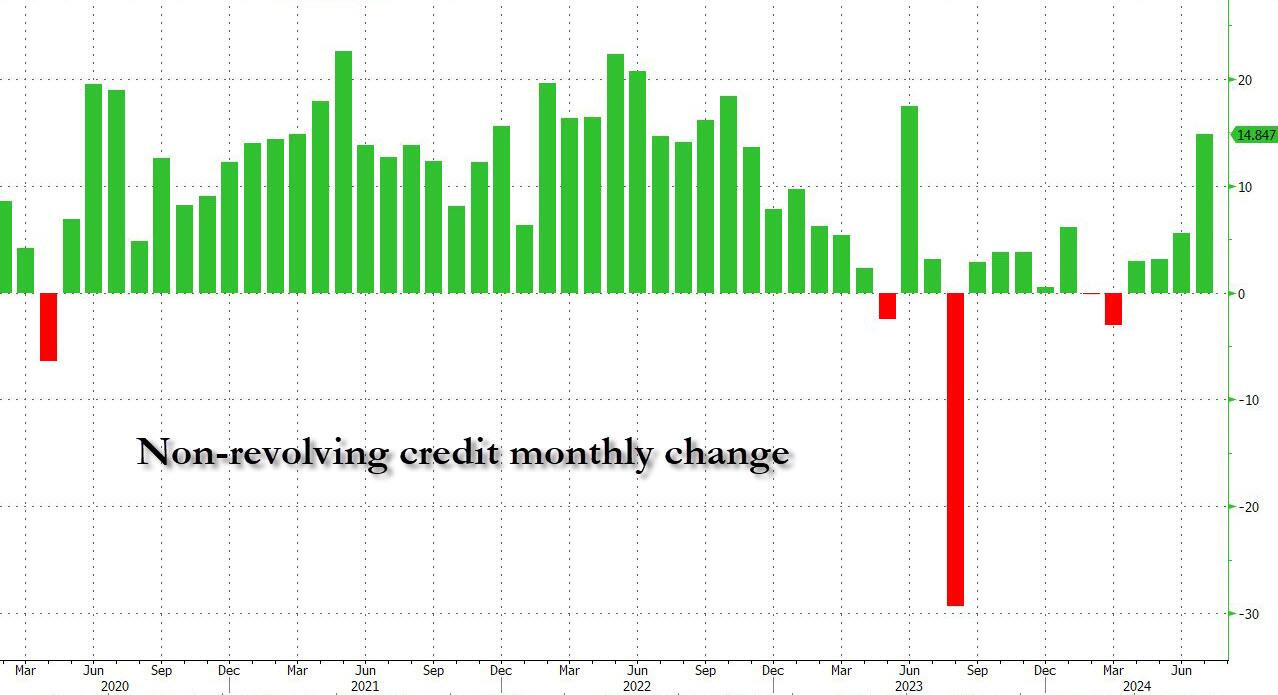
But what may be even more notable is that after two years of gradual declines in the monthly rate of increase, non-revolving credit suddenly surged by almost $15 billion, ir biggest increase since June 2023 and second biggest since late 2022!
…
AND lets get to it … here is a snapshot OF USTs as of 658a:
… HERE is what this shop says be behind the price action overnight…
… WHILE YOU SLEPT
… and for some MORE of the news you might be able to use…
NEWSQUAWK: US Market Open: European equities are mixed whilst US futures tilt lower, DXY is flat & GBP benefits post-jobs data … Bonds are very modestly softer; Gilts are weighed on by the region’s mixed jobs report … USTs have pulled back a touch in-fitting with some of the downside seen in European peers. Tonight's US Presidential debate could offer some impetus, whereby a strong showing from Trump could reignite some of the bear-steepening bets seen post-his debate with Biden in the summer; US2s10s is still in positive territory whilst the 10yr yield is currently sitting within yesterday's 3.691-763% range.
Finviz (for everything else I might have overlooked …)
Moving from some of the news to some of THE VIEWS you might be able to use… here’s SOME of what Global Wall St is sayin’ …
As we know, POSITIONS matter …
BARCAP: Long & Short of It One Step Back, One Step Forward
Discretionary funds are re-grossing; systematic funds rebuilt some equity exposure after the August selloff but now face unwind risks; skew & options flow dynamics point to still-full positioning; retail interest in equities is losing steam with outflows last 2 weeks; Tech still the favorite but a less extreme overweight.
… Long Treasury futures positions pushed to extremes as investors remain uneasy
…CTAs to maintain elevated bond longs but equity longs at risk
… CTA bond longs likely to stay elevated: With the cooler-than-expected US labor market data continuing to put pressure on yields, CTA Treasury longs continue to remain elevated (Figure 14), led by longer tenors, and likely to stay that way particularly against the backdrop of upcoming rate cuts. Notably, CTAs are long bonds across regions, with allocation to Bunds, Gilts, etc. likely to increase further in upcoming weeks.
…from positions TO DOTS <GO> … from Germany, a veritable WHOS WHO (guess) …
DB: Fed dot plot projections, what's your (reaction) function?
In this piece we expand upon our previous work gauging Fed officials’ hawk / dove policy leanings (see Mapping the dot plot mavericks). That analysis leveraged the individual-level historical forecasts from the Federal Reserve to quantify how frequent an official put his or her dot above or below the median. One shortcoming of that measure is that it abstracts from officials’ economic outlooks and therefore does not provide insights about their reaction functions.
This note attempts to quantify each official's reaction function by estimating Taylor rules using the historical individual-level forecasts. Our new hawk-dove metric is then defined as the ratio of the coefficient on the inflation gap to the coefficient on the unemployment gap. A higher value would be associated with a more hawkish reaction function, i.e. one that puts relatively more weight on inflation than unemployment.
While the identification of hawks and doves on this new metric largely aligns with our prior analysis, there are also some interesting divergences. We discuss these differences in some detail.
… The results based on this new measure of hawkishness are presented in Figure 2. Similar to our findings for the estimates of each coefficient, there is a wide range of estimates across officials. After accounting for the economic projections, many officials have hawk-dove sensitivity scores ranging between 1 and 2, while the score derived from the median forecast was 1.18, i.e., the median forecasts put a weight on inflation 1.18 times the weight on the unemployment gap.
Consistent with our priors, a few officials that were usually viewed as more hawkish stayed to the left of the chart and are thus hawkish on this metric as well, such as Mester, Rosengren, and Fisher. One notable exception is Brainard, which we discuss in some detail next. Symmetrically, officials that were typically viewed as more dovish have lower sensitivity scores, including Tarullo, Evans and Bernanke. The unexpected negative scores for Bostic and Kocherlakota appear to be associated with negative coefficients on the unemployment gap, which were insignificant and in Kocherlakota’s case, likely distorted by the presence of the ZLB over his term. The average score among all officials was 1.8, roughly consistent with the academic literature which estimated the same reaction function but with the median SEP median forecast for FOMC meetings from 2012 to 2015 (see Language after Liftoff: Fed Communication Away from the Zero Lower Bound).
… day(s) late but perhaps of SOME funTERtainment value, JPM one of many favoring steepeners BUT WITH SOME CAVEATS … adjusting of exposure booking of some profits and, well …
Front-end yields declined to their lowest levels in 2 years and the curve steepened amid further labor market softening and dovish commentary from Fed leadership
We think ongoing labor market softening, amid a more dovish Fed reaction function, supports 50bp cuts in September and November, but we recognize the whole Committee may not yet be ready for such aggressive action
Even so, with Fed leadership not wanting to see further softening in labor markets and potentially supportive of more front-loaded easing, we think risks skew toward more aggressive easing in coming months
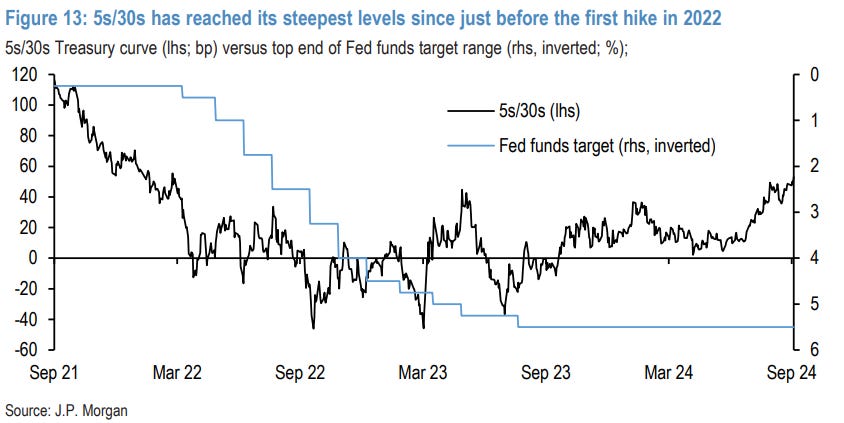
Against this backdrop, we continue to favor steepeners as a core representation of our strategically bullish view: steepeners trade like a long-duration exposure, but with a better carry profile, and should be supported by rising term premium as the growth of the Treasury market continues to outstrip demand from traditionally price-insensitive investors like the Fed, foreign official institutions, and US banks
We have been carrying 5s/30s steepeners since late last year, and continued easing supports further steepening at the long end, but we also added 3s/5s steepeners earlier this week to hedge for more labor market weakness...
...Given the backdrop described above, we recommend taking profits on our 5s/30s steepeners that have rolled down the curve and our recently-established 3s/5s steepeners and initating 3s/30s steepeners to better position for further broad front-end led curve normalization
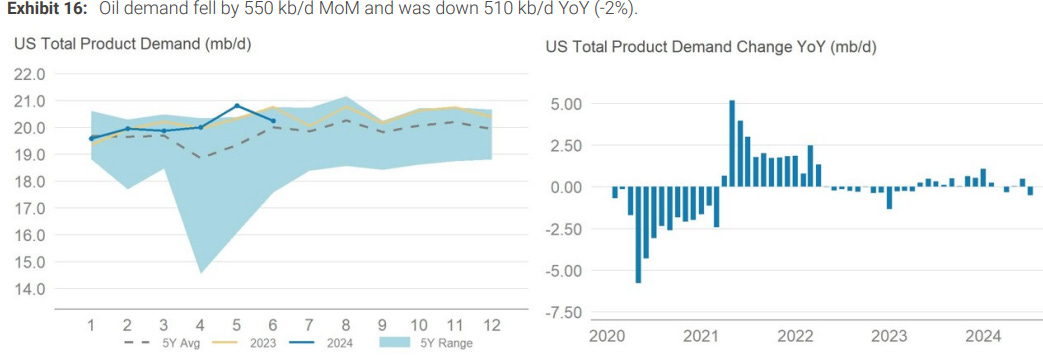
… as a reaction function of the economy is an angle of commods USAGE and so, in support of Team Rate CUT(s) on to this EARLY …
US oil demand posted negative YoY growth in June, as demand fell by 510 kb/d on weak appetite for gasoline and diesel. US shale production reached a new record, but declines in Alaska and the other Lower 48 offset this. Refinery runs crept higher while crude imports fell, driving crude stock draws.
… from Earl to some good ‘ole fashion TA w/levels to watch ahead of tomorrows 10yr …
2y UST has extended its pullback after faltering near graphical hurdle of 4.11%. It has approached potential support zone of 3.55%/3.48% representing lows of 2023. Daily MACD is within deep negative territory denoting a stretched decline, but signals of reversal are not yet visible. Last week’s high of 3.94% should be a near term hurdle; inability to cross this would mean persistence in downtrend.
In case 2y UST fails to defend 3.55%/3.48%, this phase of correction could extend. Next projections are located at 3.41% and 3.29%.
10Y UST: AUGUST LOWS NEAR 3.67%/3.65% REMAINS INTERIM SUPPORT.
10y UST has so far defended the trough formed last month near 3.67%/3.65%, which remains an intermittent support. Daily MACD has started posting positive divergence denoting receding downward momentum, but signals of a meaningful up move are not yet visible. In case a short-term rebound develops, recent pivot high near 3.92%/3.94% could provide resistance.
Move below 3.67%/3.65% will lead to next leg of downtrend towards projections of 3.60% and 3.50%.
… And from Global Wall Street inbox TO the WWW,
This one attempting to calm nerves after what was a less than optimal (?) start to September …
After an all-around bad week for stocks, markets are looking to rebound this morning with the Nasdaq leading the way higher. There's not much in the way of a catalyst for this morning's bounce and little in the way of economic data. The New York Fed's survey of Consumer Expectations has been an important report in recent months, but now that the Fed has shifted its focus from inflation to employment, it doesn't have the heft it used to have.
September didn’t start well. Since 1953 when the five-day trading week in its current form began, this year ranks as the worst first week for the S&P 500 on record. As shown in the chart below, there have only been four other years where the S&P 500 dropped 2.5% or more to kick off the month. Before this year, the record for worst start to kick off the ninth month of the year was 2001 with the other years being 1987, 2008, and 2015. To use a basketball analogy, these years are to bulls what the Detroit Pistons were to the rest of the NBA in the late 1980s and early 1990s.
In the next chart, we show the S&P 500’s performance from the close on 9/7 (or the most recent close before that) through the end of September. For all years since 1953, the median performance was a decline of 0.56% with gains just 44% of the time. In the four other years when the S&P 500 was down 2.5%+ in the first week, the rest of the month tended to be even weaker with the S&P 500 down three times and up just once.
We all know that September is typically weak, so the numbers above shouldn’t be a surprise, but what about the rest of the year? The next chart shows the S&P 500’s performance from the close on 9/7 (or the most recent close before that) through year-end. For all years since 1953, the median rest-of-year performance was a gain of 4.16% with gains 76% of the time. In the four prior years shown, the rest of the year was evenly split between gains and losses, but the magnitude of the gains was much less than the losses. In the two years where the S&P 500 rebounded through year-end, the S&P 500 was up 5.74% (2001) and 6.39% (2015), but in the years when it continued lower, the losses were four times larger in magnitude with declines of 21.98% (1987) and 27.29% (2008). Gulp.
…next up from someone I’d view as a modern day Lacy Hunt …
EPB Macro: How Far Behind The Curve Is The Federal Reserve?
Plotting the change in Federal Reserve interest rate policy before and after a trigger of the Sahm Rule.
… If we follow the more modern, non-inflationary historical path, which I think is appropriate, we can see on the left chart that the Fed is behind the curve.
The right-hand chart shows the path of inflationary recessions.
If we take the average of 2008, 2001, 1990, and 1960, the Fed Funds rate is down about 200bps when the Sahm rule is triggered.
This implies the Fed should have the policy rate at 3.5% today.
The 1970s had a secular inflation problem that required multiple recessions to cure. It remains unclear whether the burst of inflation in 2021 and 2022 was the start of a secular inflationary phenomenon or if it was a giant cyclical burst of inflation within a multi-decade disinflationary trend…
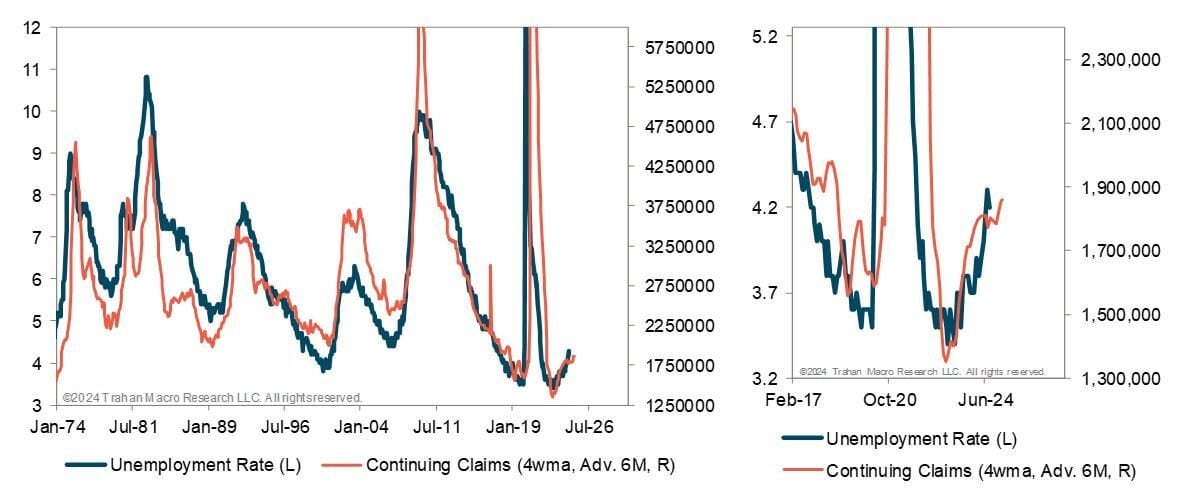
The August employment report felt a bit like New Year's Eve. There was a lot of excitement going into it given last month's experience, but it was really a non-event. Yes, the unemployment rate ticked lower (not enough to negate the Sahm Rule), but downward revisions to the employment data in recent months are not exactly encouraging. We will have to wait a full month to see what happened with September's payrolls, but there will be lots to chew on for the markets before then. We have a Fed meeting this month (and likely rate cut) and the focus between now and then will be on leading indicators of employment, like continuing claims in the above chart. It tends to lead the unemployment rate by a couple quarters, so it is forward-looking and one to keep an eye on.
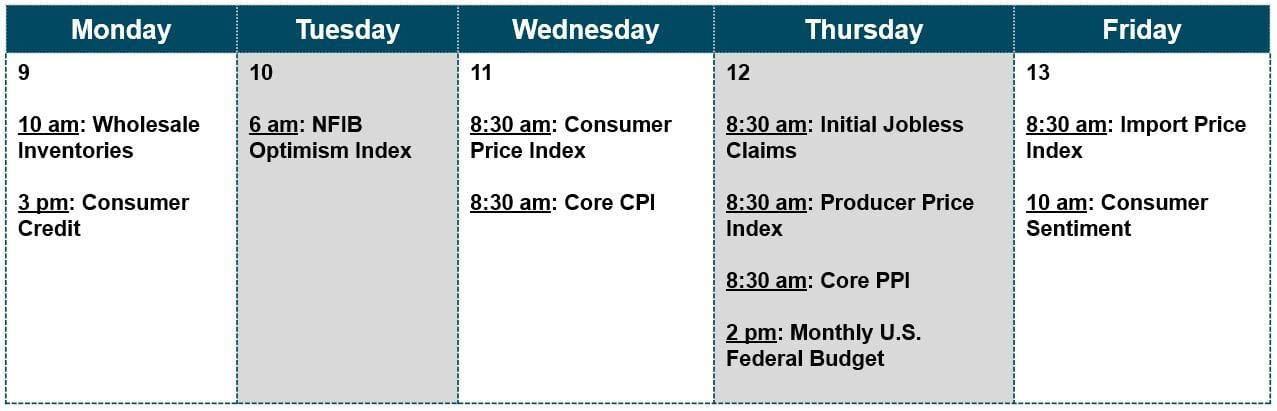
The Macro Week Ahead
… finally a sector of un de / disinflation percolating …
WolfST: This May Be the End of the Massive Deflation in Used Vehicles that Pushed Down Core CPI: Wholesale Prices Surge for 2nd Month amid Strong Sales Growth & Tight Inventories
Wholesale prices jumped across the board but spiked the most for EVs.