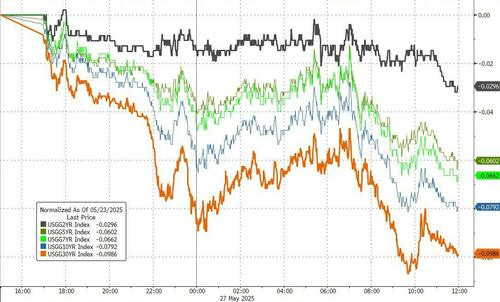
while WE slept: USTs are 'twist-steepening' on heels of weak 40yr JGB; "Should the Fed Funds rate be higher?" (DB); not yer dad's ‘Widow Maker’ (dip buyers TLTs delivers gains...)
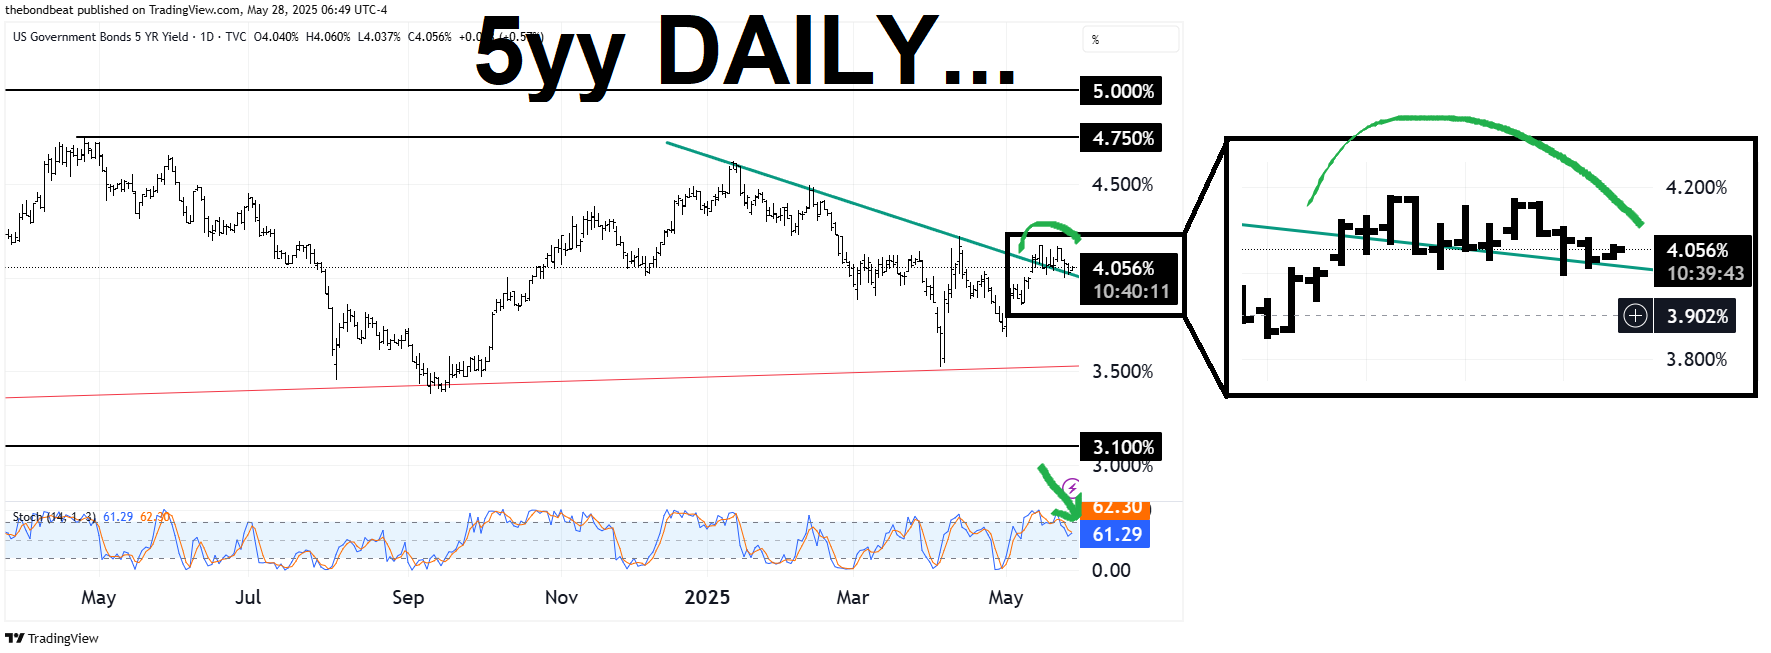
5yy DAILY: TLINE (resistance, at moment) comes in ‘round 4.01% …
… as shorter-term (ie DAILY) momentum continues to roll over from overSOLD levels and suggest LOWER yields ahead … watching then ‘resistance’
5yy WEEKLY: watchin’ 4.00 and 4.05% … 50% of the (circled) range — 5.00 to 3.10 …
… here, momentum a bit different and suggesting path of least resistance towards HIGHER yields as opposed to more bullish DAILY …
… Now in as far as YESTERDAY came and went, well, what a great day to be alive (or long of … markets)! Even those buyers of 2s got lucky …
ZH: Yields Near Session Lows After Strong 2Y Treasury Auction Stops Through
… um, it would seem to have been VERY short-lived good vibes and feel as overnight, well, the story seemed to have changed or reverted back to … well … something else …
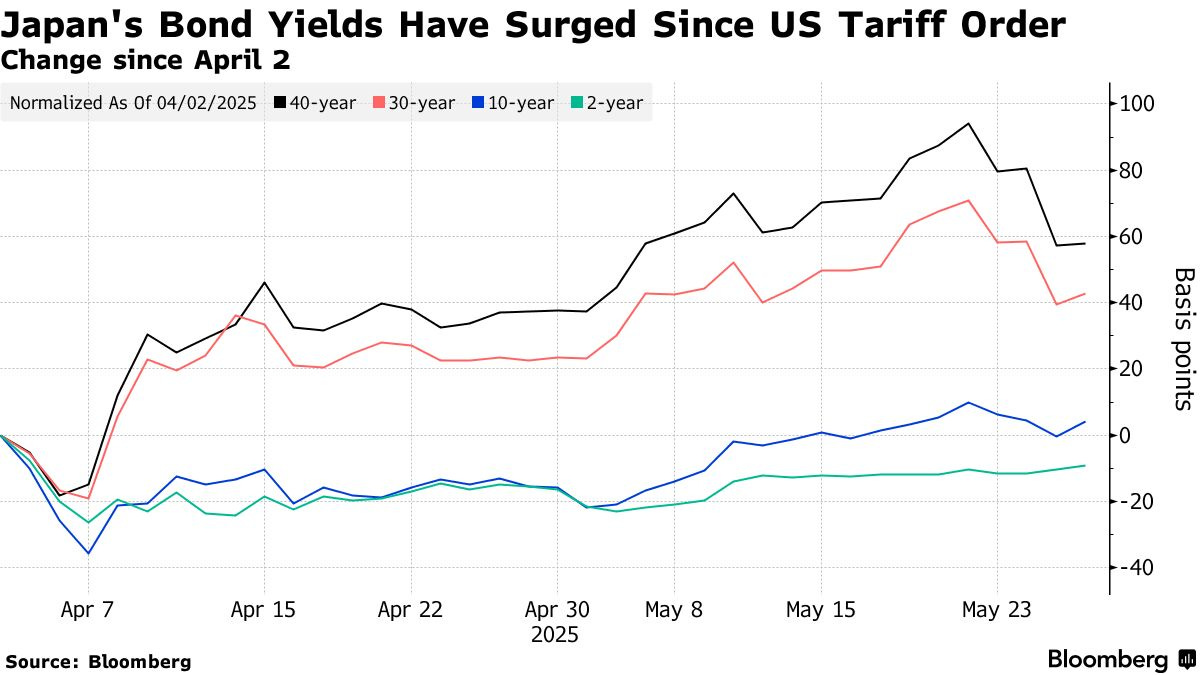
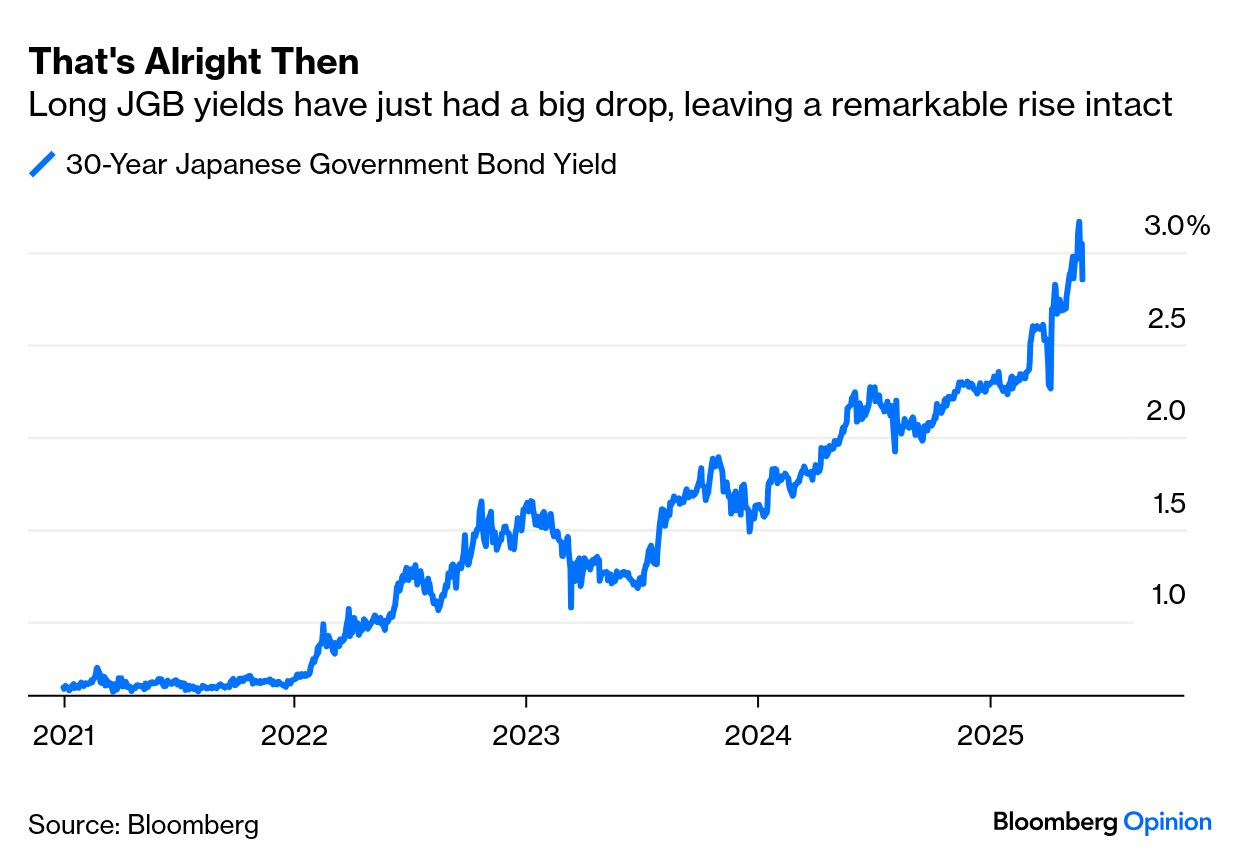
Bloomberg: Japan 40-Year Bond Sale Demand Weakens on Volatility Surge
Japan’s auction of 40-year government bonds Wednesday met demand that was the weakest since July, as investor appetite fell after volatility surged in global debt markets.
The 40-year yield rose 9 basis points to 3.375% following the sale, as the 30-year tenor jumped 10 basis points.
“Given we have just had a yield shock, I don’t think anyone was expecting a really strong sale,” said Stephen Spratt, rates strategist at Societe Generale. Spratt said demand was unimpressive.
The sale was a key test globally for longer tenors amid concern that rising government spending will take budget deficits into dangerous territory. In Japan it was also being viewed as an important gauge of appetite from large institutional investors, who have not filled the gap left by the central bank reducing its purchases.
… AND as far as WHY this may be all so important …
Bloomberg: Why Investors Are Worried About Japan’s Bond Market
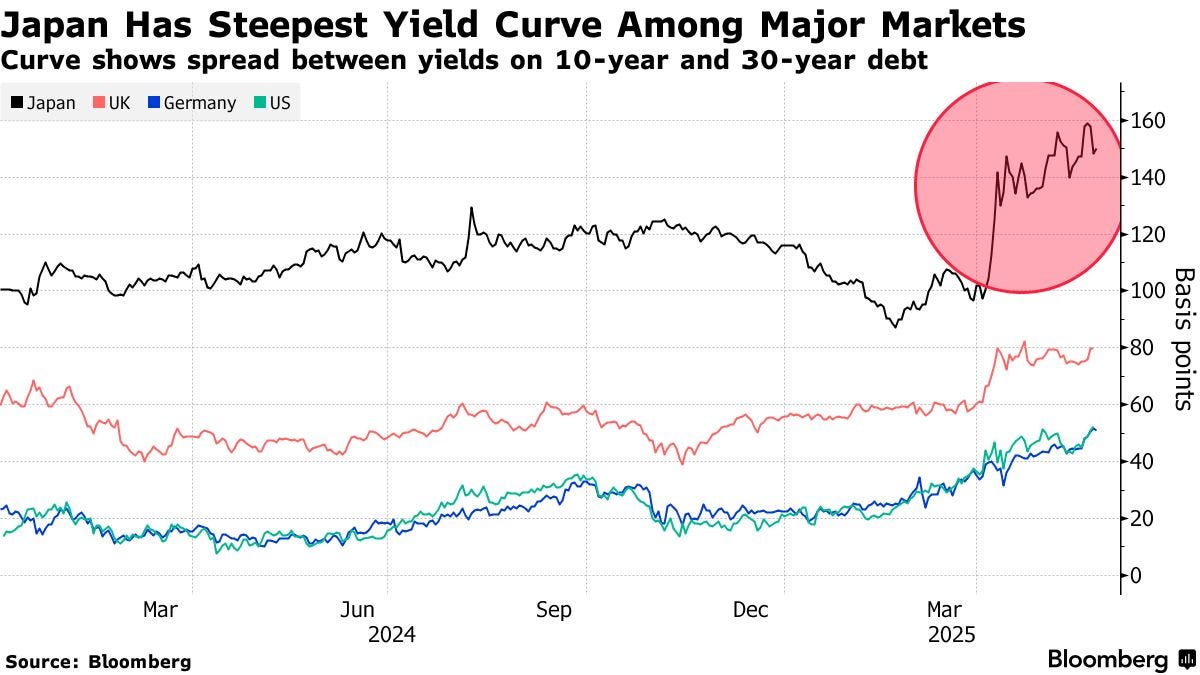
Global bond jitters are spilling into Japan, a corner of the market that for decades experienced barely any volatility — and it’s worrying investors already spooked by frictions in US Treasuries.
Japan’s central bank—the Bank of Japan — seen as a “whale” of the domestic bond market because it owns more than half the nation’s sovereign notes, has been gradually trimming its balance sheet and scaling back its bond purchases. But the question is: Who else is interested in buying?
On May 20, a sale for 20-year notes fizzled out with demand at its weakest in more than a decade. The auction of 40-year bonds on May 28 was met with the weakest demand in 10 months.The rout in Japan’s $7.8 trillion government bond market has been building since US President Donald Trump unveiled his “Liberation Day” tariffs in April…
…Why has demand been weak? Japan’s central bank has long been the biggest holder of Japanese government bonds. The country had, until recently, been in a cycle of deflation since the 1990s, known as the “Lost Decades.” Buying bonds, which allows the government to issue more debt and spend more as a result, had been part of the BOJ’s strategy to stimulate the economy.
Now that Japan is exiting deflation and is no longer focused on bolstering the economy through bond buying, the central bank can concentrate on trimming its significant holdings. In November 2023, the BOJ’s debt holdings reached a record high. So far it has slashed ¥21 trillion ($146 billion) from its balance sheet and has been cutting purchases by ¥400 billion worth of debt each quarter.
Normally, available super-long bonds with attractive yields are snapped up by Japan’s insurers and other institutional investors, but they’re not filling the gap this time. Many are waiting for volatility to ease from the trade war started by the Trump administration in early April and uncertainty over the BOJ’s rate-hike path.
There has been some demand from foreign investors, although their holdings pale in comparison to large Japanese players. Foreign funds in April bought a record ¥2.29 trillion of Japanese debt with maturities of more than 10 years. That followed record purchases in February and March, too. This may have been due to a “Sell America” trade that is gaining momentum in markets, with US bonds’ haven status being called into question.
What’s happening globally to bonds? The rout in longer bonds has been building momentum in many major markets around the world since Trump unveiled his “Liberation Day” tariffs in April. Uncertainty around the duties, whether they will require governments to spend more as a result and what effect that might have on their economies are all of concern. In the US, a bond selloff in May was amplified after Moody’s Ratings stripped the country of its last top credit rating. Still, the moves in Japan’s long-maturity bonds have been particularly acute.
… Japanese bond yields tumbled, as according to Reuters, Japan's Ministry of Finance (MOF) will consider tweaking the composition of its bond program for the current fiscal year, which could involve cuts to its super-long bond issuance...
Source: Bloomberg
...and that helped drag UST yields lower, with the long-end dramatically outperfoming...
Source: Bloomberg
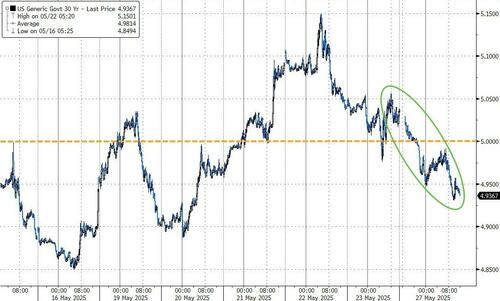
...with the 30Y UST back below 5.00%...
… Now in as far as some of the pieces of the puzzle, well … aDURable goods and home PRICESwere a victory for Team Rate CUT(s) while confidence and other ‘soft’ data, was, well …
ZH: US Durable Goods Orders Slumped in April As Tariff-Frontrunning Furore Fades
ZH: US Home Prices Dropped In March For First Time In Over 2 Years
ZH: Conference Board Consumer Confidence Surges Most In 4 Years After Tariff 'Pause'
ZH: 'Soft' Data Soars As Dallas Fed Manufacturers' Uncertainty Plunged In May
… here is a snapshot OF USTs as of 700a:
… HEREis what this shop says be behind the price action overnight…
… WHILE YOU SLEPT Treasuries are twist-steepening after a relatively quiet overnight session. The desk noted better fast$ steepener interest in 5s10s, receiving in 2s5s10s, and 2-way activity in 5s10s30s. SFR spreads are heading into US hours a touch tighter with dealers selling into the overnight richening in London, with issuance expectations building into the NY open. S&P futures are flat, Gold +0.4%, Crude +1%, and the DXY -0.1%. US 2s10s is ~4bps steeper, with the 2s5s10s fly +2.6bps cheaper.
… False Break Risk, UST Momentum Turns Bullish - In the wake of the UST downgrade & EU 50% tariff pause, the technical px-action has been anything but intuitive. This has seen 5y yields trace out a potential ‘double-top’ pattern from the 4.17% horizontal support, guiding yields back towards the 200dma (4.03%) which now represents range resistance. 10y yields have seen an even sharper retrace after initially breaking long-term ‘bull channel’ pattern support at ~4.51% last week, only to return towards the lower-end of the multi-week range at ~4.41%. With daily momentum studies now confirming a bullish shift across the curve, there is risk that the ‘false break’ above 4.51% could extend lower towards the mid-point of the March-May range ~4.25%. One positioning impetus could be systematic/CTA-derived: as we show in our first attachment, the distance to move TU and FV model ‘max shorts’ into covering mode is shortening, with TUM5 ‘flipping long’ above 103-18 (ref 103-10) and FVM5 ‘flipping long’ above 108-00 (ref 107-25). TYM5 contracts have a bit more room to go before a ‘flip long’ above 110-30 (ref 110-09).
Minutes Risk Skews Modestly Hawkish - After the Fed’s Barkin stated Tuesday that “there has been no evidence of a drop in sentiment affecting spending data”, the CB consumer confidence index rebounded to 98.0 in May (vs 87 expected), though labor market indicators remain on the softer-side (‘jobs hard to get’ climbed further to 18.6%, from 17.5%). Overnight, the Fed’s Williams also drew a sharper line on the incumbent rise in near-term AND longer-term inflation expectations, suggesting the post-pandemic environment has “changed people’s perceptions of inflation,” and in policy circles, “the thing you want to avoid is allowing inflation to become highly persistent, because highly persistent can kind of become permanent,” he said. This leaves a shade of hawkish nuance heading into the May FOMC Minutes, where calendar guidance may be lacking (as was the case in Powell’s post-meeting press conference), but renewed focus on inflation expectation may incentivize a longer-stay in the ‘good place…with policy modestly to moderately restrictive’. Williams suggested in a speech last week that the Fed will not have a clear picture until after the June or July Meeting, while President Bostic (NV) felt it might be “three to six months” before the Fed can respond with a policy move. In the absence of clearer weakening in labor markets, the path of least resistance is non-action.
… for somewhat MORE of the news you might be able to use … a few more curated links for your dining and dancing pleasure …
NEWSQUAWK US Market Open: USD steady & US equity futures lower awaiting NVIDIA & FOMC Minutes, NZD bid post-RBNZ … 40yr JGB auction weighs, awaiting US supply & FOMC Minutes … JGBs pulled back at the start of APAC trade after the marked upside seen on Tuesday after reporting around the MOF. An acceleration of this occurred after the highly anticipated 40yr JGB auction. Overall, the outing was a disappointment, featuring an elevated yield and weak cover … USTs fell alongside JGBs after the 40yr auction results. Pressure which took USTs to a 110-07+ base and essentially eroded the strength seen after the US’ robust 2yr tap. The results of this helped to drive the complex to a 110-18 high. Ahead, the docket features a 5yr auction, FOMC Minutes, the latest executive order signing by POTUS and NVIDIA earnings.
Finviz (for everything else I might have overlooked …)
Moving from some of the news to some of THE VIEWS you might be able to use… here’s some of what Global Wall St is sayin’ …
A few words on aDURables and tariffs…from the Netherlands …
27 May 2025 ABN AMRO: US - Tariffs have entered the hard data
‘Soft’ consumer and business confidence data deteriorated rapidly due to US government policy. ‘Hard’ data has held up better, partly due to frontloading effects from the tariffs. But now the negative impact is starting to show in the hard data as well.
A few MORE words on aDURables, tariffs, confidence AND POSITIONING … from the UK …
27 May 2025 Barclays: Durable goods orders turned downward amid April's new tariffs
New durable goods orders fell 6.3% m/m, with normalizing orders in the volatile nondefense aircraft component helping to unwind March's 7.6% m/m surge. The April estimates seemingly highlight tariff frontrunning effects in Q1, with capital goods orders dropping off sharply following April's tariffs.
27 May 2025 Barclays: Consumer confidence: Households agree that tariffs are stagflationary
The Conference Board's consumer confidence index rose 12.3pts in May, to 98.0, reversing course following favorable tariff developments. Today's jump, which was mostly in expectations, is a stark reminder that consumers view tariffs as stagflationary and that sentiment will be tied to trade policy.
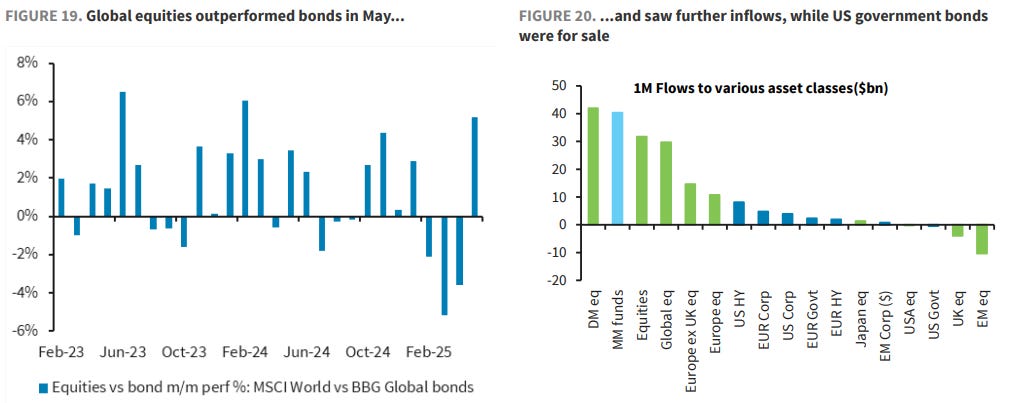
28 May 2025 Barclays: Who Owns What Muted re-risking, but more rotation into ROW
…Earnings and liquidity cushion equities against rates vol, but bond positioning cleaner now
…Bonds for sale, but positioning looks quite bearish now As the market narrative changed from tariff relief to debt sustainability in the US, bond vigilantes returned, putting US (Japan and UK) duration under pressure, as mutual funds and CTAs turned short treasuries. Long-end bonds in DM markets sold off sharply, as term premia rose significantly. Consequently, the equity bond correlation also flipped, with safe haven treasuries struggling, causing challenges to the typical 60:40 portfolios. However, our fixed income strategists note that the US 30-year yield embeds a significant term premium already, and believe that declining policy uncertainty over time would lower long-term yields (see US Rates Research 30y USTs: In the endgame, 22 May). So amid depressed positioning, tactical risk-reward for bonds may well have improved.
… best in show on aDURables, confidence and as dust settled …
Durable Goods Orders declined -6.3% MoM in April vs. +7.6% in March and -7.8% expected. Ex-transportation, the move was +0.2% MoM vs. -0.2% prior. Orders of nondefense ex-aircrafts were -1.3% MoM vs. +0.3% prior and -0.2% forecasted. Shipments of nondefense ex-aircrafts slipped -0.1% MoM vs. +0.5% MoM March and -0.1% MoM anticipated. Overall, it was a mixed read between revisions and the disappointing core orders figures.
There was an initial bond-bearish impulse driven by the smaller-than-expected drop in orders, although the bid in the longer end of the curve has re-emerged…
May 27, 2025 BMO: Conference Board Surprises Higher
Conference Board Consumer Confidence outperformed expectations in May at 98.0 vs. 85.7 in April and 87.1 consensus. This was the first increase in sentiment since November. Present Situation improved to 135.9 vs. 131.1 prior. Expectations surged to 72.8 vs. 55.4 previous. The Labor Differential slipped to 13.2 from 13.7, the lowest since September 2024, and second lowest since March 2021. Within the details of the report, the observation was made that, “The cutoff date for preliminary results was May 19, 2025. About half of the responses were collected after the May 12 announcement of a pause on some tariffs on imports from China” … “The rebound was already visible before the May 12 US-China trade deal but gained momentum afterwards.” Overall, it was a notably stronger-than-expected print that speaks to the relevance of the bounce in US equities to consumer sentiment and forward expectations…
…Treasuries put in a solid performance on Tuesday in a move that was decidedly driven by the long-end of the curve as 30-year yields pushed down to 4.93% – an impressive rally in the wake of last week’s peak at 5.15% … after establishing local yield peaks in 10s and 30s, the retracement process has been a clear flattener – although one that has held to the confines of the recent range. Said differently, last week’s steepening move received more attention and focus than the in-range reversal. While it’s a dynamic to be expected, the price action served as a reminder that the curve is nothing more than a directional trade.
In outright terms, we suspect that the bullish move still has further to extend before running into any technical resistance. This is decidedly the case for 10s and 30s given that the magnitude of the selloff kept potential dip-buyers on the sidelines as investors erred on the side of caution, preferring to wait-and-see as opposed to adding duration…it is a refunding month, and the Treasury index extension is +0.11yr (12-month average is 0.08yr)…
… 5s have managed to trade well above the 200-day moving-average of 4.028% -- which now serves as resistance in the event of a modest bid. Daily stochastics are in oversold territory and despite just recently crossing in favor of lower rates, have now recrossed and point toward further weakness. 4.25% is an obvious support level and it corresponds well with the Bollinger top at 4.247%. We’re also tracking the mid-April yield peak at 4.221% as interim support. Further resistance comes at an opening gap of 4.000% to 4.009% as well as the handle-change below 4.0%. The Bolling mid is 3.976% and then there is little before the 3.862% low yield close.
Live from the French Open sponsors …
27 May 2025 BNP US: Vehicle prices to test our inflation call
KEY MESSAGES
The auto sector will provide a key test of our longstanding view that (1) US inflation will accelerate on account of tariffs and (2) the Fed will remain on hold this year.
Early evidence suggests movement in the direction of higher inflation. Tariff front-running has pulled forward demand and inventory/sales ratios are moving toward levels that promoted sharper price gains during Covid.
We expect new and used vehicle prices to rise 5pp (relative to a non-tariff baseline) by end-2025.
A lack of sustained pricing power could challenge our thesis, as would signs that businesses are choosing to manage rising input costs with job cuts (which is not the case so far).
Here’s one which caught my eyes as the title, well, does it’s job … one of Global Walls fan favs asks and attempts to answer … and I can almost SWEAR I’ve seen / shared this one before BUT in the case you missed, if Jim’s reiterating it, well, it’s worth being reiterated …
27 May 2025 DB: Should the Fed Funds rate be higher?
There’s been a lot of good work from my research colleagues in the last week on US debt sustainability and how term premia and r* plays into that.
Joint work from the US Economics and Rate Strategy teams here argue that a 1.2% primary deficit is now the maximum the US can run to stabilise its debt. A year ago it was around double this with the change being mostly down to a c.100bps rise in term premia over the period. With the tax bill going through Congress, and the future deficit outlook, its hard to see this upward pressure on term premia going away.
Head of Rate Strategy Francis Yared often ties this into the equity/bond correlation, and how it influences r* (the real neutral rate). In a world of a persistently negative bond/equity correlation, where for example, bonds rally when equities fall, the real neutral rate can be lower with extra demand for bonds. However, as has been the case in recent years, the correlation has flipped, as bonds are now more positively correlated to equities. There has been less flight to quality attraction to bonds since inflation returned around 2022, and ever higher deficits don’t help.
So as today’s CoTD, borrowed from Francis shows (short note here), the bond/equity correlation estimates that r* should now be back to pre-GFC levels in the US, at around 2.5%. So if correct you could make an argument that the Fed Funds rate should now be nearer 5% given where current inflation expectations are. We shouldn't take estimates of r* too seriously but we can be pretty confident that equilibrium interest rates are rising and it shows how much harder the Fed’s job is becoming.
For the entirety of virtually everyone’s career reading this, we’ve been used to the Fed riding to the market’s rescue when it needs to. While that still might be the case to some degree, their room for manoeuvre has arguably diminished significantly in recent years and is getting harder as deficits march ever higher.
…same shop with an updated update on last nights 40yr JGB auction action …
… That rally in Japan then echoed around the world, with long-end bond yields seeing a significant decline. For instance, the 30yr Treasury yield (-8.6bps) was down to 4.95%, which helped to ease fears about the US debt trajectory. And in Europe, 30yr yields fell back in Germany (-6.1bps), France (-5.6bps) and Italy (-5.8bps) as well.
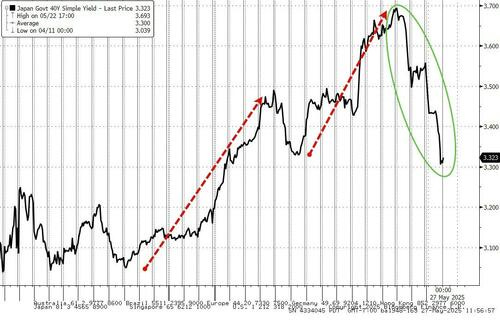
However JGB yields have reversed some of their rally this morning as demand at a 40yr auction fell to its lowest since July, with the bid-to-cover ratio at 2.2 from 2.9 at the previous sale in March. 10 and 30yr JGB yields are up +7.4bps and +9.0bps respectively as I type.
Nevertheless yields are still comfortably lower than where they started the week and that has supported risk over the last 24 hours, with US equities seeing a strong recovery after the long weekend…
… next up, better late than never, I suppose?? I just stumbled on last weeks RATES TRADER from Goldilocks and title did what it was supposed to … catch my simpleton’s attention … as did a chart / a few words regarding Moody’s Blues and the 20yr …
23 May 2025 | 7:31PM BST Goldilocks: Global Rates Trader Duration Hot Potato
Global long-ends were under pressure this week, with ongoing rises in Japanese 30y yields, focus on US fiscal issues, and high UK inflation. Re-emergence of trade and tariff risks toward the end of the week offered only a limited reprieve. While weakness in 20-40y JGBs remains relatively localized and thus likely reflects technical factors, it also reduces the urgency for policy shifts. Against a backdrop of higher global inflation and elevated deficits, we think the risk of spillovers from long-end JGB sell-off is unlikely to subside quickly. In the US, we think the parallels to 2023 will limit the scope for relief at the long-end of the Treasury curve, instead preferring skewing any longs toward shorter maturities. Unlike in 2023 however, deficit expectations are more sustainable, suggesting that the key signals for the market will be on the demand side. The upside inflation surprise in Canada still needs to be balanced with soft underlying activity; receive July BoC meeting OIS. In Europe, we think that the front-end steepness is justified by the combination of near-term downside risks and future fiscal expansion. Rather than receiving terminal rates, we think 5y inflation longs offer macro value. The bear-steepening response of the UK curve to an upside inflation surprise indicates the UK long-end is not yet out of the woods, but we think the global weakness in duration exacerbated the move. We continue to recommend long 10y10y Gilts vs UST…
… 20s bear the brunt. The reaction to Wednesday’s 20y auction—which tailed by 1.2bp but didn’t require the sort of elevated dealer award that would have suggested overly cautious end-user demand in the process—aligned with a rates market that is highly sensitive to any signal of weak duration demand. The 20y point has been a particularly poor performer on the curve, cheapening versus 10s and 30s in both swaps and cash space. To an extent this reflects the properties of 20s, which, due to the mix of duration extension being large vs 10s and convexity benefit being small vs 30s, tend to suffer in periods of higher vol and rising term premia. However, even accounting for both factors, 20s have underperformed, overshooting what the usual relationship with vol and term premia would imply in both cash and swaps (Exhibit 2). While there are reasons to remain cautious that the drivers of recent long-end rates volatility persist, the 20y point on the curve may offer value for investors looking to position for a reprieve or some consolidation following the recent volatility.
Charts. I love ‘em and here are some excellent ones from a mid-year outlook … and a recap from same shop …
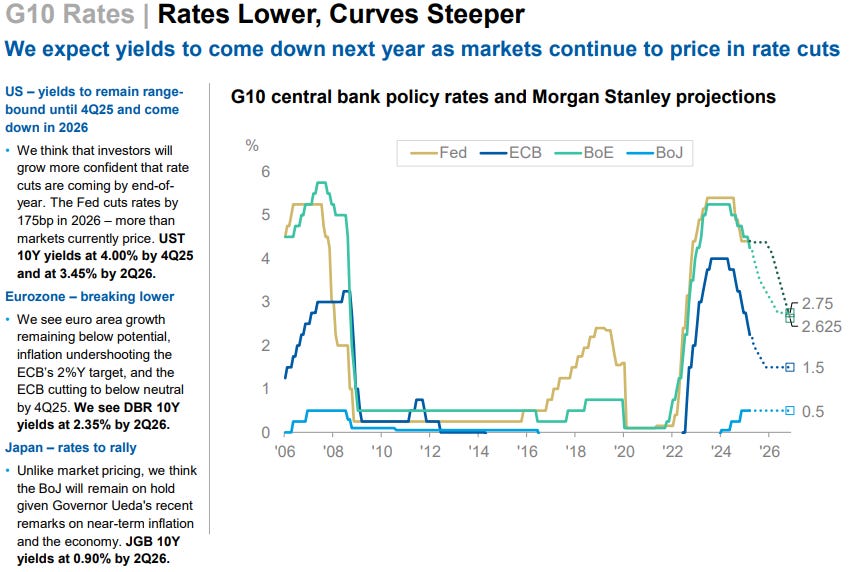
May 27, 2025 MS: 2025 Mid-Year Outlook in Charts – All Eyes on US
Macro – No global recession in our base case Despite policy uncertainty, the global economy is still in expansion mode, albeit with slowing growth. We expect that tariffs will not end at the extreme levels in the aftermath of Liberation Day. Substantial monetary easing – 175bp of fed cuts - is ahead, along with the benefits of deregulation.
Markets – Persistent USD weakness Uncertain macro means risk assets should be cheaper. But the recent sell-off has been so severe and sentiment turned so bearish that we expect some relief over the short term. That said, shifting patterns in fund flows and correlation show markets are grappling with what “quality” in “flight-to-quality” mean. The debate around USD assets’ safe-haven status, who holds USD assets, and how that may impact outflows will likely remain, as will recession concerns.
Allocation– US > RoW, EW in global equities, OW in core fixed income Macro is not the markets, and the delta in expectations matter more for risk assets in our view – less bad is constructive for markets that had been pricing for abysmal. We see best upside to US within global equities, and US high-grade fixed income to post good total returns on duration rallying.
Sharp super-long JGB rally amid speculation for lower long-end issuance; positive EU and US trade developments support US assets; USTs bull-flatten; miss in France CPI; LatAm currencies outperform; Fed's Barkin warns of effects of uncertainty; DXY at 99.58 (0.5%); US 10y at 4.444% (-6.7bp)
Reports of the MoF sending a questionnaire around views on the JGB market and issuance heighten speculation that the MoF may reduce super-long JGB issuance; long-end JGBS rally sharply (40y: -25bp) and USD/JPY rises 1.2%.
Appetite for US assets increases (S&P 500: +2.1%; DXY: +0.5%;30y UST: -9bp) as the US and EU signal a willingness to work towards a trade deal with President Trump delaying the 50% EU tariff.
USTs bull-flatten even as economic data come in better-than-expected with consumer sentiment rebounding; long-end USTs rally sharply (30y: -9bp) in sympathy with the JGB move with front-end USTs extending strength (2y: -1bp) after a solid 2y UST auction…
Swiss weighing in with a statement we could all agree on …
Equity markets seemingly rallied on optimistic comments from US President Trump around trade. So much focus on the words of one individual is unusual. Trump has the power to limit future economic damage from new trade taxes, but cannot undo the damage of past policy swings. For example, comments in yesterday’s sentiment data highlighted that companies are delaying decisions in the face of policy uncertainty, even as Trump retreated from some tariffs.
The minutes of the 7 May Federal Reserve meeting are due. This meeting left policy unchanged. The Fed has little choice but to adopt a “wait and see” approach on policy, which risks decisions being taken late. But it is impossible to know where administration policy will land, or how exactly consumers and companies will react to policy volatility…
… oh, nevermind … when HE said POWER, I thought it was going to be about NVDA … Covered wagons circling … aDURables and confidence …
May 27, 2025 Wells Fargo: Sign of Post-Tariff Air Pocket in Durable Goods Orders
Summary The best that can be said of today's durable goods report for April is that there are signs of life in spending on info-processing equipment, and the drop in civilian aircraft orders was not as big as feared. But underlying orders activity is sputtering after firms frontloaded orders pre-tariffs.
Underlying Orders Losing Ground Durable goods orders fell 6.3% in April amid a drop in civilian aircraft orders (chart). Coming on the heels of a 158% surge in aircraft orders the prior month and amid fairly soft orders data from Boeing, we had been expecting a larger decline than the 51% drop in aircraft that was revealed in today's report (chart).
May 27, 2025 Wells Fargo: Consumer Confidence: Not Optimistic, but Less Pessimistic
Summary After five straight monthly declines, consumer confidence rebounded in May amid a cease-fire in the trade war. Even after the bounce, confidence remains near the low-end of the recent range and further improvement may depend upon continued deescalation of trade hostilities.
… And from the Global Wall Street inbox TO the intertubes, a few curated links …
Terminal dot COM with a story providing flashbacks …
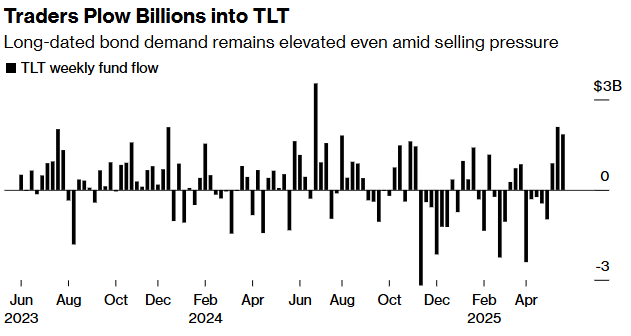
May 27, 2025 at 2:11 PM EDT Bloomberg: ‘Widow Maker’ Bond-ETF Trade Delivers Fast Gains for Dip Buyers
Dip buyers in the dangerous world of long-dated Treasury debt are enjoying a rare pay day — and fast.
Investors over the past week poured $1.8 billion into BlackRock Inc.’s iShares 20+ Year Treasury Bond ETF (ticker TLT) — the most among all the 630 ETFs that Bloomberg tracks — just as longer-maturity government bonds sold off on fears over America’s debt trajectory.
The timing has proved fortuitous. In Tuesday trading, Treasuries rallied — pushing the 30-year yield below 5% — on optimism about trade negotiations between the US and the European Union, and as Japan signaled it may adjust debt sales to stabilize its bond market. TLT jumped 1.7% during the session, on track for its biggest daily rise since February.
It’s a rare win for an ETF trade that has earned a reputation as a so-called widow maker. True to its infamy, TLT has attracted some $49 billion in the past five years despite shedding more than 40% in that time horizon.
“Investors aren’t letting TLT’s widow-maker reputation scare them off,” said Athanasios Psarofagis, ETF analyst at Bloomberg Intelligence. “They’re still buying in, holding on to hope that long-term Treasuries will finally bounce back.”
For some time, bond investors have been demanding extra compensation for the risk of investing in longer-duration debt as Republican lawmakers haggled over President Donald Trump’s signature tax-cut bill that would add trillions of dollars to already bulging budget gaps. Benchmark 30-year Treasury bonds surged above 5.1% last week to trade near the highest in almost two decades.
But last week’s buying streak in TLT suggests that a growing cohort of traders are betting that yields are high enough to entice buyers and compensate for the risks. Long-maturity bonds are most exposed to interest-rate risk, so they tend to rally the most when borrowing costs fall.
“Dip-buyers are trying to pick the bottom,” and long-term bonds give investors “the biggest bang for your buck” because they are exposed to the most volatile part of the yield curve, said Byron Anderson, head of fixed income at Laffer Tengler Investments Inc.
The iShares 10-20 Year Treasury Bond ETF (TLH) was also among the ETFs that attracted the most inflows over the past week, along with the iShares 0-3 Month Treasury Bond ETF (SGOV).
Peter Tchir of Academy Securities is among those recommending long-bonds, saying the pessimism is overdone. Adding heft to his belief is the rally in global bonds after Japanese authorities signaled they are considering adjusting their debt plan.
“The situation wasn’t as bad as the narrative,” said Tchir who recommended investors add duration last week. “Positioning had swung from too bullish to too bearish fairly quickly, too.”
Of course, TLT — which is almost as volatile as US stocks — isn’t for faint hearts. In the options market, traders remain wary of further declines in long bonds. It costs more to buy put options in TLT than to purchase calls, a sign there is demand for downside protection.
“We believe the long end will continue to see term premium increase,” said Lindsay Rosner, head of multi-sector fixed income investing at Goldman Sachs Asset Management. “It’s all about the fiscal, what is the right level to lend at to countries whose balance sheets are trending the way they are.”
And … a room (website) with a VIEW …
May 28, 2025 at 4:00 AM UTC Bloomberg: The Fallacy of Market Narratives When something happens to cast doubt on a particular story, there is money to be made.
… The Bond Vigilantes Have Gone Away
This is a reversal of last week’s “The Bond Vigilantes are back, and this time they really mean it” story. Both infer the narrative from the price; long bond yields spiked across the world a few days ago because the vigilantes were balking at governments’ excessive demands. Now that yields are down, there’s a twist in the tale and supposedly vigilantes aren’t so bothered.
An immense buildup in JGB yields remains intact, but US investors were heartened. Then Tuesday’s auction of Treasuries was much better received than last week’s, and bond investors decided the danger was over. They were helped by a reappraisal of the narrative surrounding the One Big Beautiful Bill, which involves both large tax cuts and significant spending curbs on politically sensitive programs like Medicaid. Last week, that was seen as irresponsibly boosting the deficit.
Matthew Klein of the Overshoot newsletter points out that expectations of a much higher deficit were based on the technicality that the first-term Trump tax cuts were due to end. As everyone assumed that a Republican Congress would extend those cuts, the likely impact of this package is much tougher on the deficit than expected — even more so if tariffs really generate some revenue:
Some of the cuts look politically untenable, and the package must survive the Senate. But the most accurate narrative for now might be: “Bond vigilantes are stirring, but governments can still just about keep them in check.” …
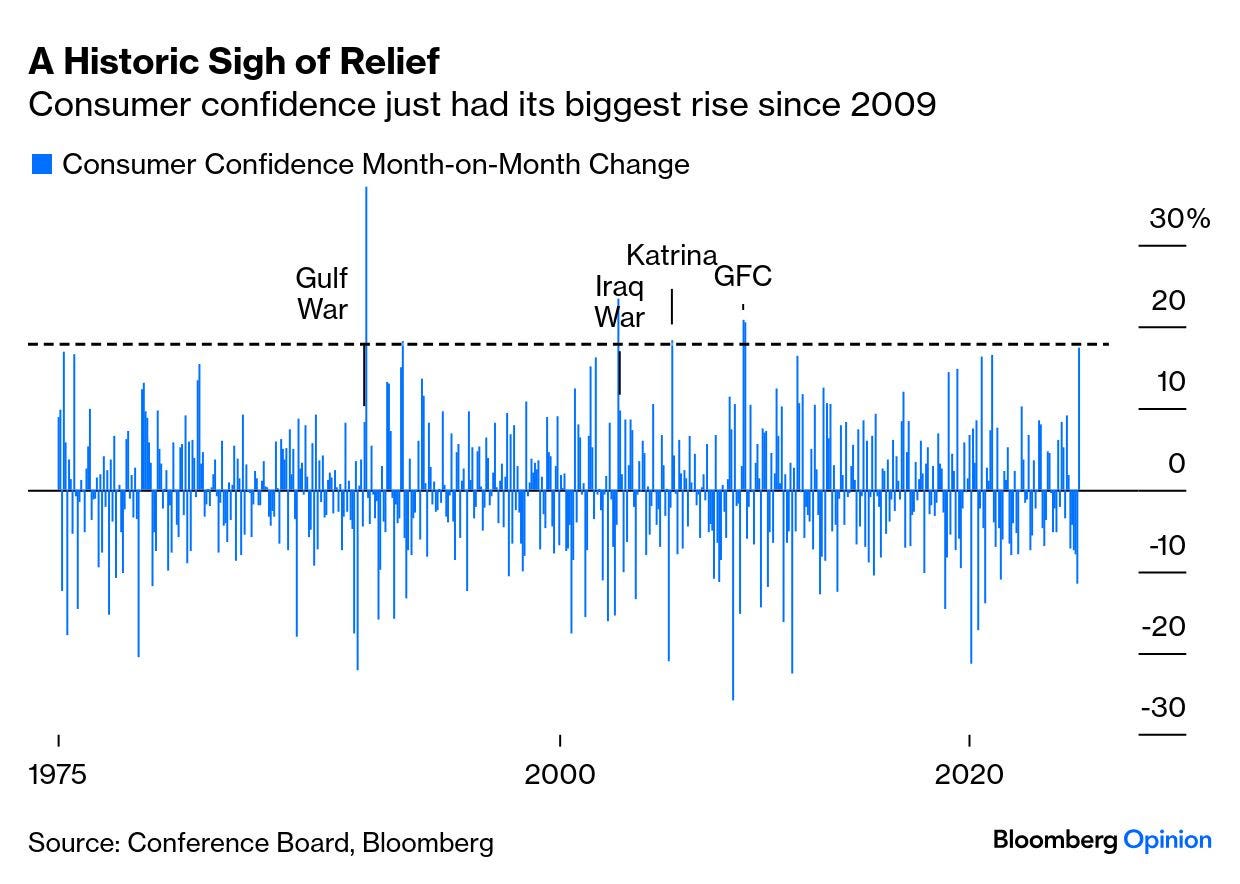
US Consumers Are Back Americans continue to be the world’s spenders of last resort, and opinion surveys suggest they are angry and confused. After startling declines in consumer confidence that troughed in April with tariffs dominating the news, the Conference Board showedthe biggest monthly leap of confidence since 2009. Beyond that, in the last 50 years only the months after the end of the first Gulf War, the fall of Saddam Hussein’s statue in Baghdad, and Hurricane Katrina have seen bigger rebounds:
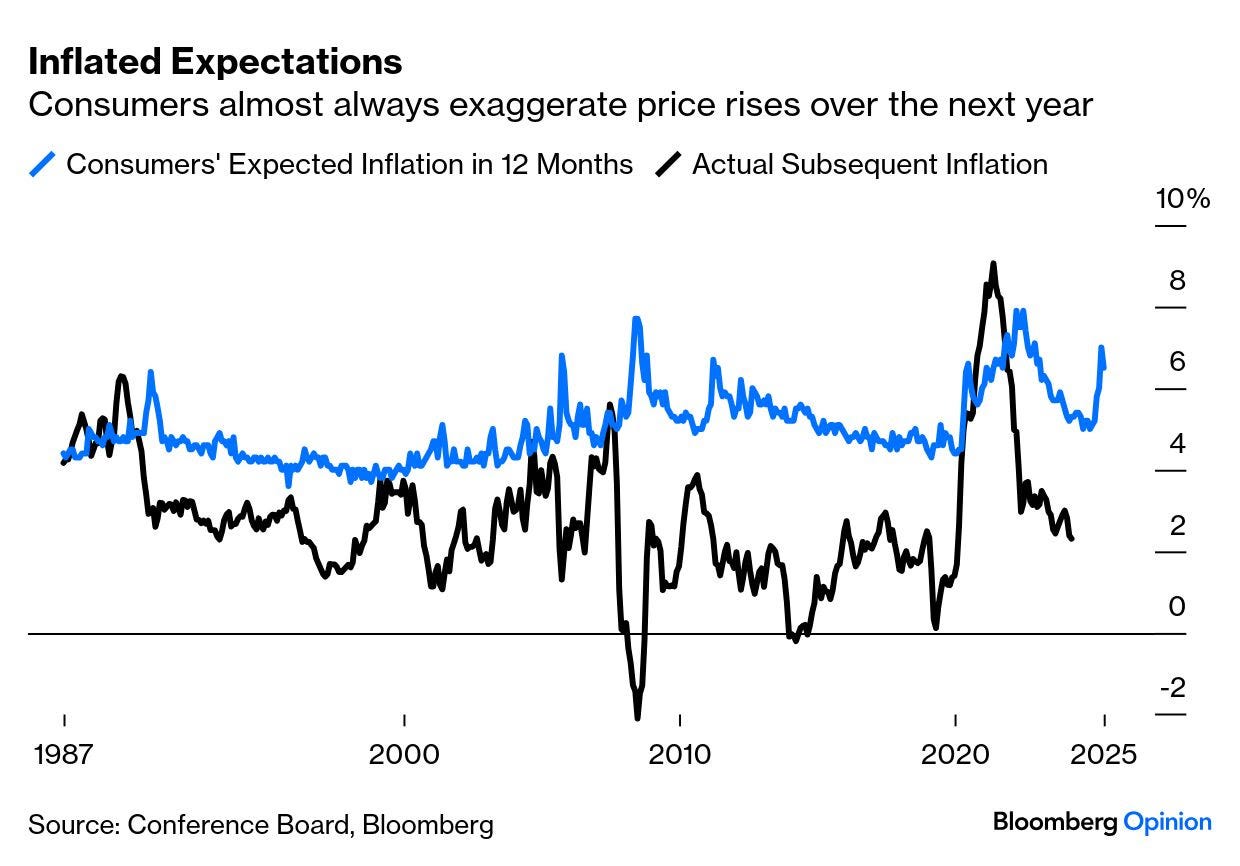
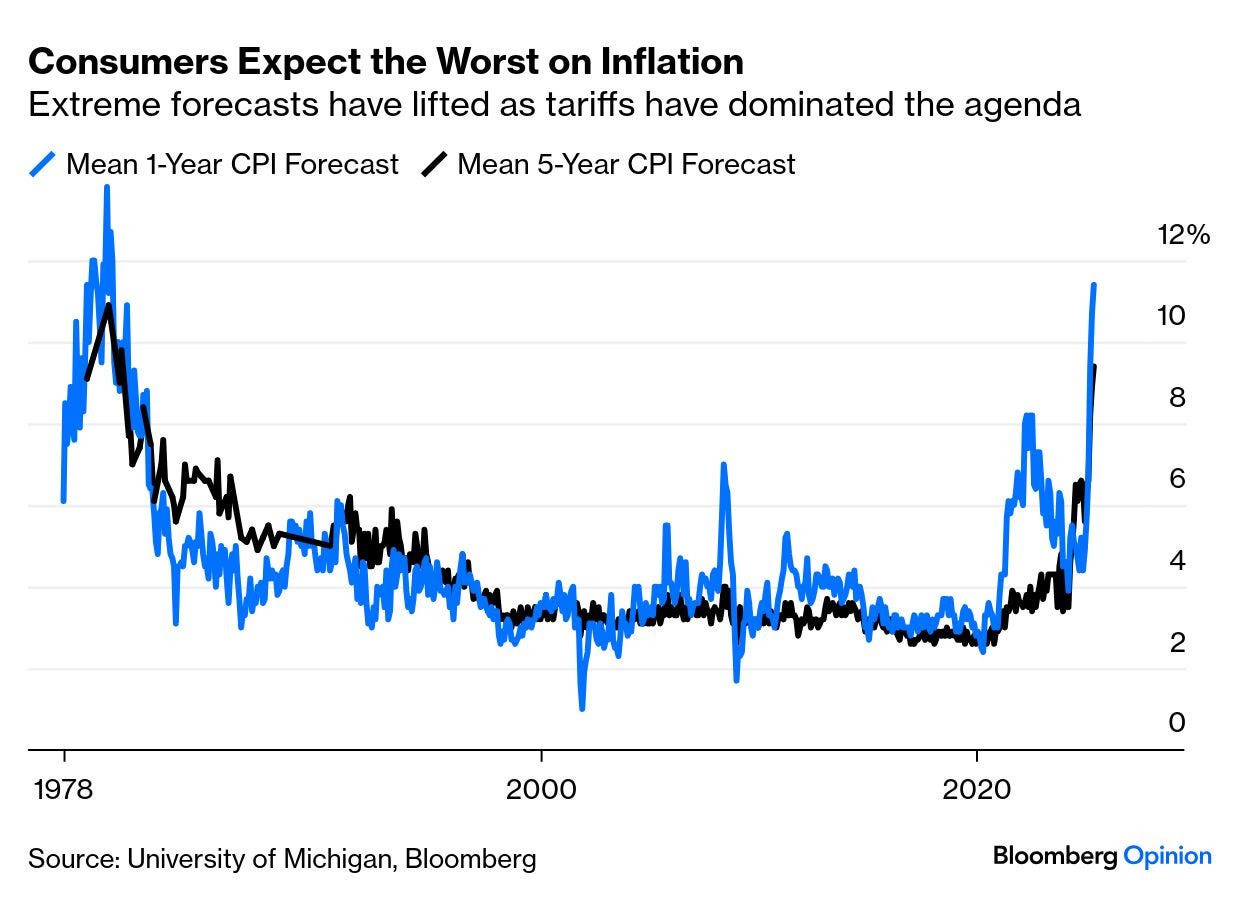
Rather than by a war or a hurricane, confidence this time was driven by one politician’s plan, and then his change of mind. The Conference Board also had decent news on inflation expectations, which ballooned after the “Liberation Day” tariff announcements. Forecasts remain uncomfortably high, but consumers almost always predict worse inflation than actually results:
These numbers are at least more palatable than the frankly horrifying predictions that consumers gave to the University of Michigan. Those numbers showed consumers bracing for a repeat of the 1970s:
That’s a scary narrative, and people are only happy for an excuse (such as the Conference Board data) to abandon it. They have another excuse, too...
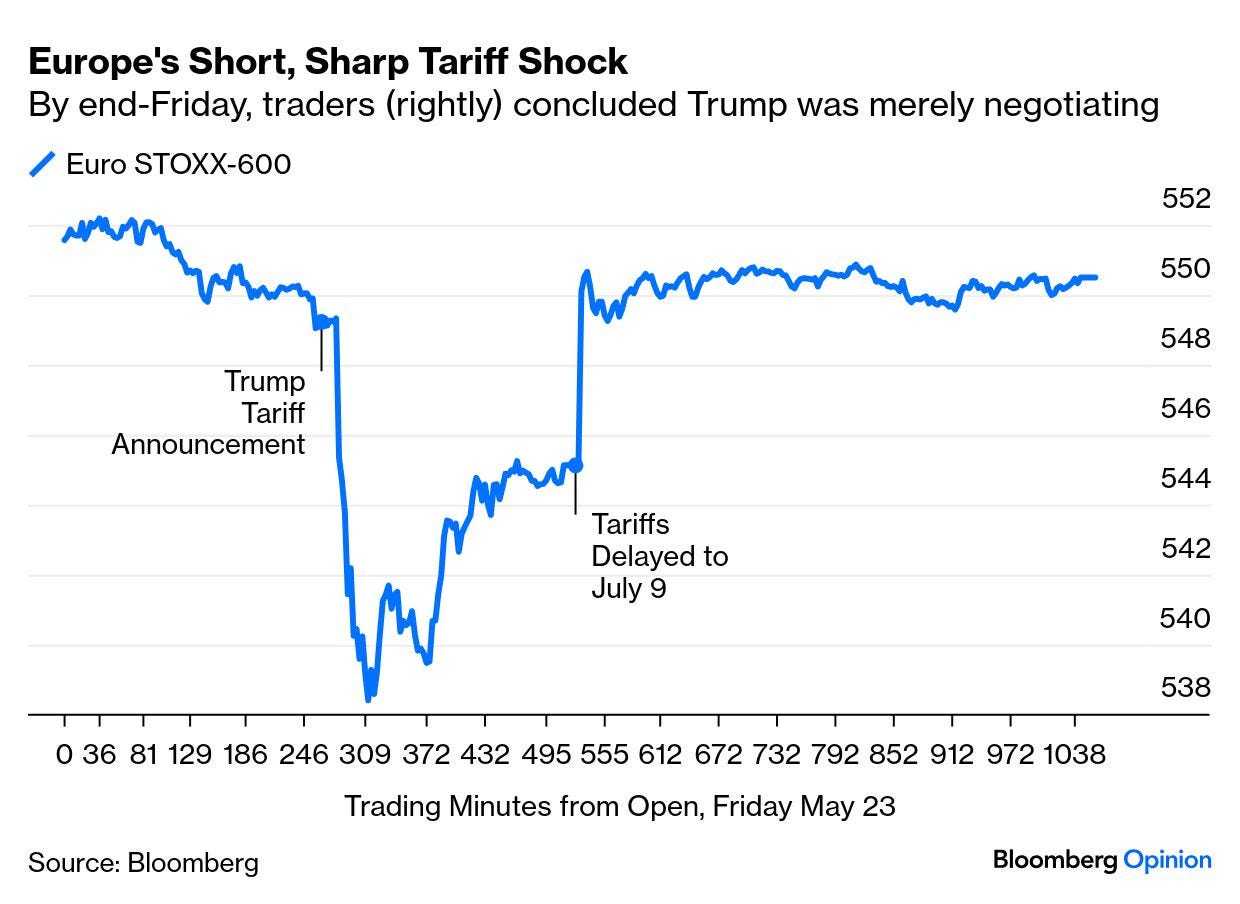
The TACO Trade Is On This one was christened by friend and former colleague Rob Armstrong of the Financial Times. TACO stands for Trump Always Chickens Out. I wish I’d thought of that one. Traders have noted the president’s propensity to make threats, scare the market, and then pull back. Now they are skipping the selloff, and assuming that Trump always caves. The fast-disappearing 50% tariffs on the European Union was the greatest example, as we showed yesterday:
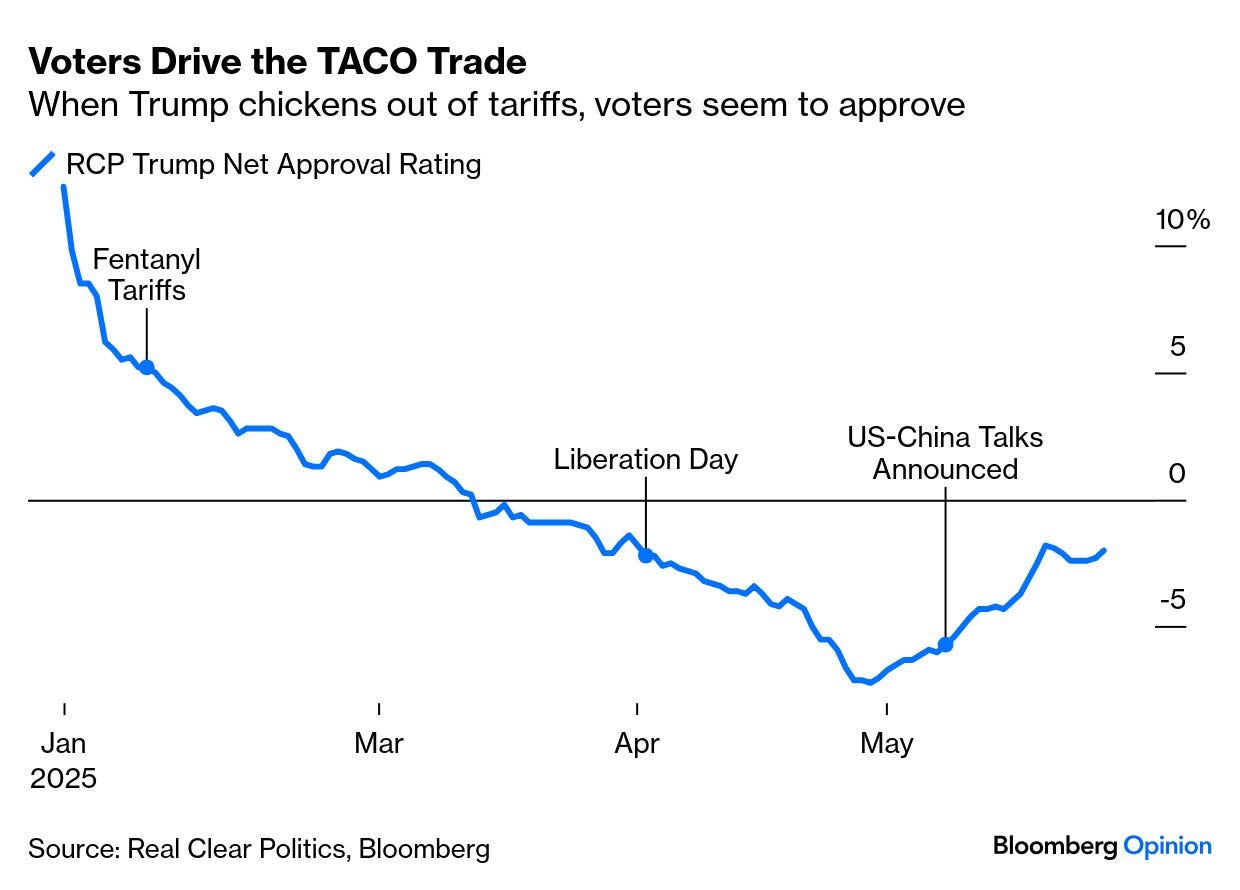
Adding ballast to the TACO case is the link between consumer confidence, angst over tariffs, and presidential approval. Voters approve of Trump chickening out on tariffs, and traders assume that the president has also noticed this. Maybe his improving approval rating emboldened him to threaten a new tariff on the EU:
The TACO assumption is that henceforward Trump 2.0 will be like Trump 1.0: tax cuts, deregulation, and fiscal largesse. One problem with this is that if the bond vigilantes have really been appeased, that implies no fiscal stimulus for everyone to feast on; two positive narratives are in direct conflict.
There is another problem. If his threats are merely negotiating tactics and seen as such, then they’re useless in a negotiation. Trump has broadcast his enthusiasm for tariffs for decades before he entered politics, and even after his climbdowns, tariffs are the highest in decades. It’s not clear he will always back off. Which leads to a third problem: that TACO traders are too confident by half. Peter Atwater of Financial Insyghts suggests the trade is now so brazen as to signal trouble ahead:
The open air grifting feels like it has now reached bubble status. The collective invulnerability is palpable with participants at all levels believing it is unstoppable. No one believes the crowd’s moral compass will swing back. Put simply, it feels like something big is about to happen.
So far, the year 2025 has been pretty wild, not least because of Hurricane Trump. I'm not the only pundit that has been struggling to make sense of things. Seven weeks ago global markets were staring into the abyss, reeling from Trump's tariff onslaught. Some degree of calm has since been restored, and even Trump is licking his wounds.
So it's time to take a step back and survey the landscape of market fundamentals as they appear in the 11 charts which follow. With the exception of the first, all are based on variables that are driven by the interaction of market forces, rather than forecasts or policy prescriptions. Think of them as market "tea leaves" that tell a story if you know how to interpret them. The story as I see it is reasonably healthy…
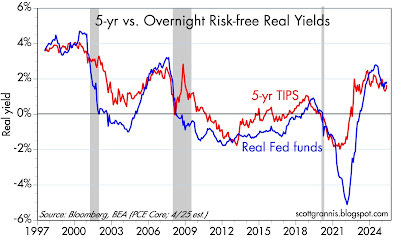
… Chart #8 compares the real yield on 5-yr TIPS (red) to the ex-post real yield on risk-free overnight yields (blue). Real yields on TIPS are determined by expectations for Fed tightening. That the two are roughly identical suggests the market sees Fed policy as being relatively stable at current levels for the foreseeable future.
Chart #8
Everything is bigger in Texas, they say … so too may be the revelations about the Fed and economic data …?
May 27, 2025 FRB Dallas: Has the Beige Book become disconnected from economic data?
But in the postpandemic period, observers note Beige Book economic characterizations were often weaker than what hard data such as employment and the gross domestic product (GDP) indicated, prompting questions about whether the Beige Book has diverged from official statistics. And, if so, why?
The Beige Book (so named for the color of its cover when it was a hard copy) is released eight times per year, before each Federal Open Market Committee meeting when officials set monetary policy. The information is collected by the 12 individual Reserve Banks through surveys, interviews and roundtables with business and community leaders and banking executives. The Beige Book also includes reports from business, higher education and nonprofit leaders serving on reserve bank and branch advisory councils and boards of directors. Contacts are asked about changes in demand, employment, prices and outlooks, among other topics…
…Economic data and Beige Book converge again Beige Books released in 2025 indicate growth nationwide has retreated since year-end 2024. The April 2025 report signaled flat economic activity in the U.S., with a handful of Fed districts noting slight declines. This is in line with the latest GDP data, which showed no output growth in the first quarter. Job growth remains resilient, and the Beige Book continues to report slight employment gains on net.
Looking ahead, the Beige Book highlights the extent to which uncertainty about tariffs and trade policy is weighing on prospects. Several districts, including the Dallas Fed, said growth slowed and business outlooks deteriorated in the March to mid-April reporting period. New findings from the Dallas Fed show that nearly 60 percent of the approximately 350 Texas company executives surveyed April 15–23 expect higher tariffs to negatively affect their businesses this year.
Regional Fed business outlook surveys released since the April Beige Book from the New York,Philadelphia,Richmond,Kansas City and Dallas districts broadly convey slowing demand and diminished expectations of future conditions, with readings indicating either a slowdown in growth or outright contraction in six months.
Not sure I think this is a good question BUT lots are asking and so …
May 27, 2025 LPL: Where Have All the (Duration) Buyers Gone?
It has seemingly been a one-way move higher in longer-term interest rates in May, with the 30-year U.S. Treasury yield above 5% again and higher by 0.36% this month alone. Additionally, the 10-year U.S. Treasury yield breached 4.5%, up 0.35% in May alone. The reasons for the sell-off are many: elevated inflation expectations, a Federal Reserve (Fed) on hold, foreign buyer boycotts, the recent Moody’s downgrade, and the potential for more debt and deficit spending (which are all likely exacerbated by an illiquid Treasury market).
But it hasn’t been just a U.S. problem, long-term interest rates have surged globally, with a significant sell-off in April and May pushing, among others, U.K. Gilts, Japanese Government Bonds (JGBs), and German Bund yields to multi-year highs as well. The synchronized yield spike reflects fears of debt saturation, fiscal dominance, and trade war-induced inflation. Trump’s tariffs, particularly on China, have raised inflation expectations, potentially constraining central banks. A brief yield dip followed Trump’s 90-day tariff pause (excluding China) in April, but underwhelming government bond auctions persist.
And with the recent global sell-off in duration, longer-term interest rates are higher in many non-U.S. markets, which may mean foreign investors (who make up 30% of U.S. Treasury ownership) may not be as willing to invest in U.S. Treasury securities. Non-U.S. investors, particularly from Europe and Japan, are increasingly disincentivized to own U.S. Treasuries on a currency-hedged basis due to rising home-market yields and high hedging costs. The yield differential between U.S. 10-year Treasuries (4.5%) and 10-year German Bunds (2.56%) or 10-year JGBs (1.50%) has narrowed as global yields have surged recently. For Eurozone investors, hedging via currency swaps involves costs tied to interest rate differentials, which reduce the effective Treasury yield below that of bunds or even U.K. Gilts. Japanese investors face similar challenges, with yen volatility and JGB yields at 1.5% making domestic bonds more competitive after hedging costs.
… Finally, some details from the aDURable goods data with some SPIN factor which caught my eyes AND I believe is worth consideration …
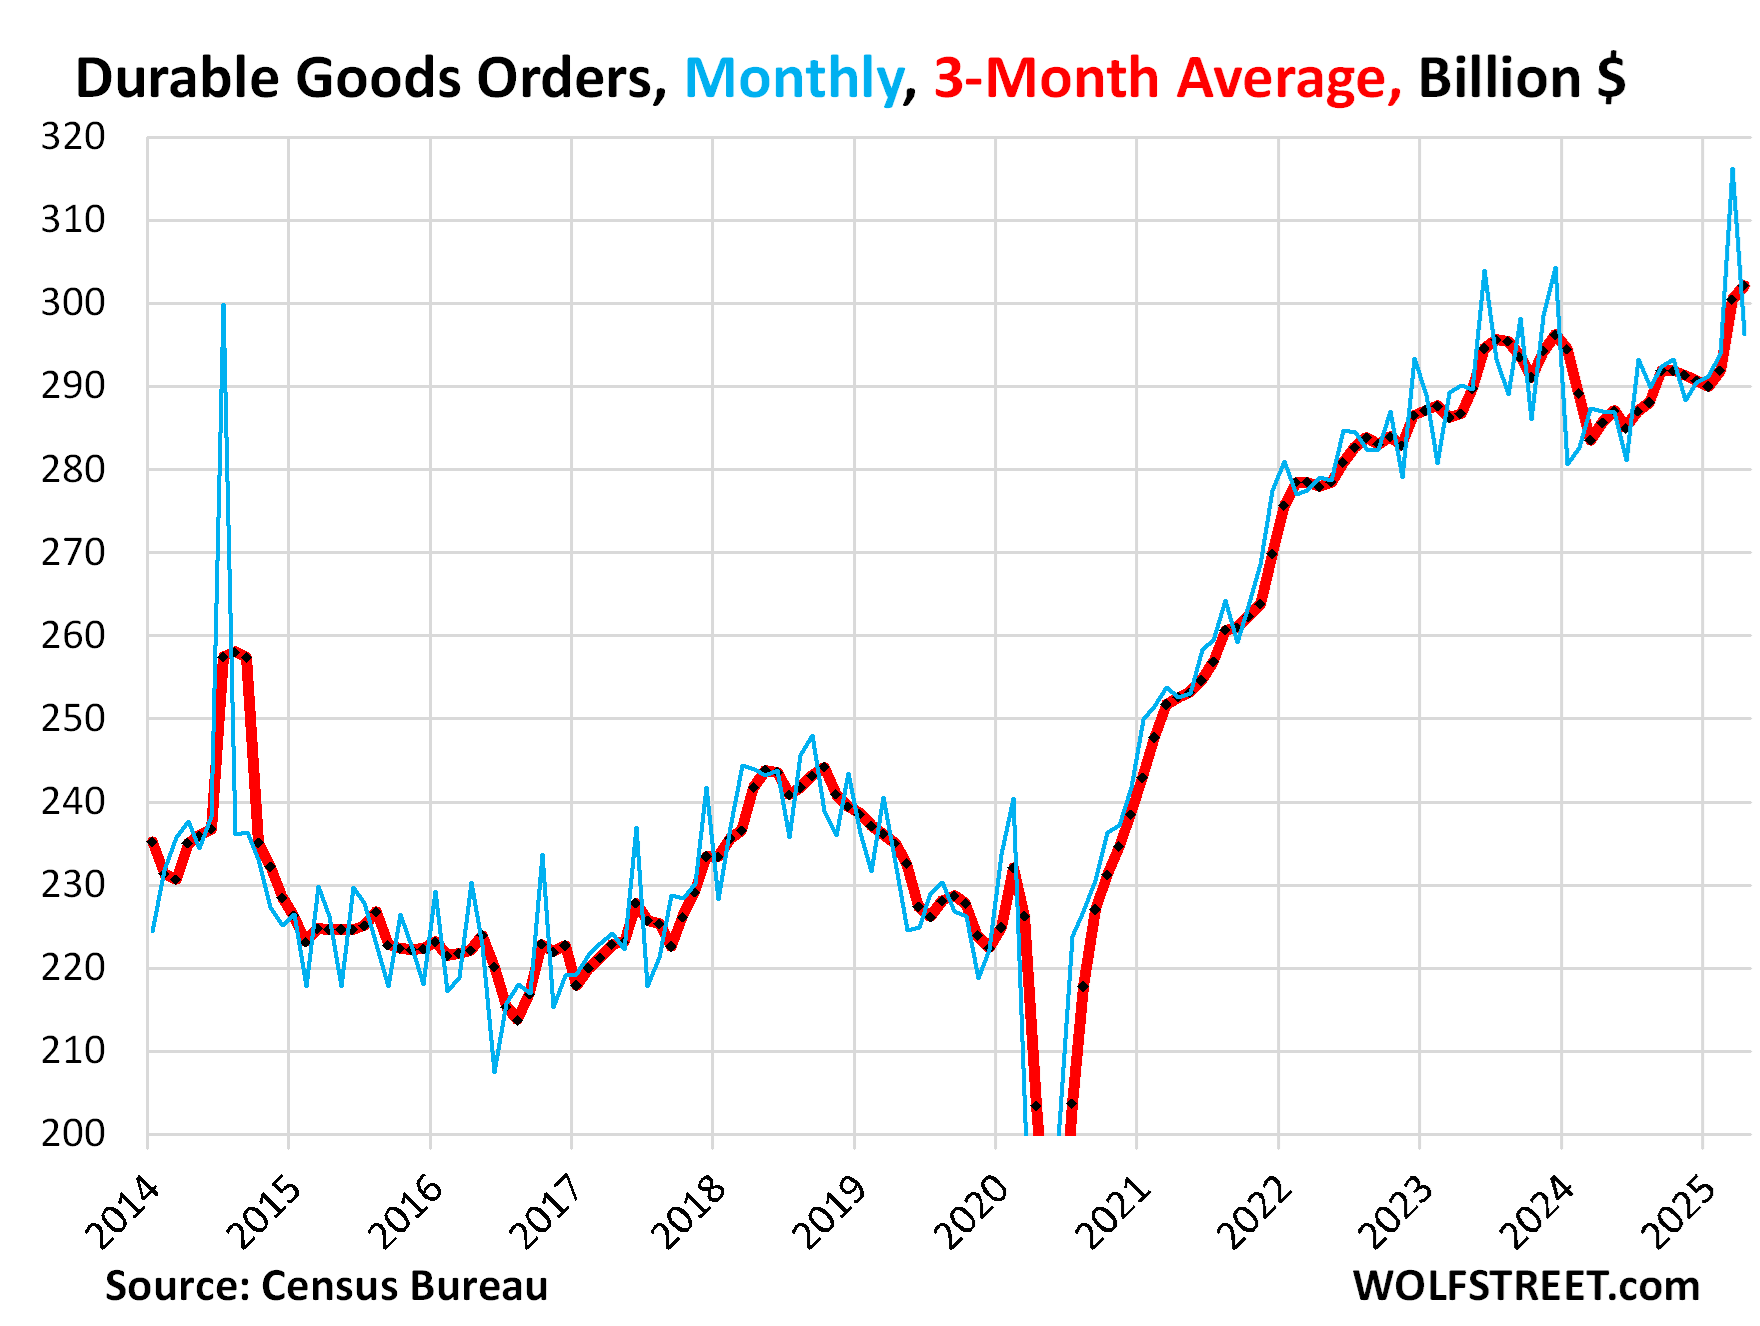
May 27, 2025 WolfST: Durable Goods Orders Made Ugly Headlines, but the 3-Month Average, which Irons Out Aircraft Orders, Rose to a Record
And the backlog of unfilled orders remained a record high
New orders for durable goods received by manufacturers in the US in April “plunged,” as the headlines had it, by 6.3% in April from March, on “Tariff Uncertainty,” or better yet, “as Trade Policy Swings Rattle Manufacturers,” or whatever, the worst drop since Adam and Eve, etc. etc.
But they’d jumped by 7.6% in March, driven by huge Boeing orders in March, and the plunge in April was driven by the lack of huge Boeing orders, because that’s what aircraft orders do, one month an airline orders dozens of jets, and the next month no airline orders dozens of jets, and then the next month, another airline orders dozens of jets, and huge month-to-month spikes and plunges are normal – and the three-month average irons them out.
And the three-month average of durable goods orders rose by 0.6% in April from March to a record $302 billion (red line).
… AND in as far as NVDA earnings today …
Ok so thats not at all related but I still found it kinda funny … sorry. NOT sorry.