while WE slept: USTs are essentially unchanged; "Could US tariffs result in higher equilibrium level of interest rates? Yes." -DB; (BBG equity) Model SAYS ...
Good morning … BoE CUT (but their house was divided), IJC refuse to skyrocket (for now) and Trump said what?? …
ZH: In 'Divided' Decision, BoE Cuts Rates, Plays Down Tariff Fears; Trump Trounces "FOOL" Powell For No Fed Cut
ZH: Initial Jobless Claims Refuse To Weaken In Face Of CEO Dissonance
… and so, the table was then set for the official UK / US trade deal announcement …
ZH: Trump Hails U.S.-U.K. Trade Deal As "Breakthrough", Says Lower Barriers Will Unlock Transatlantic Growth
… whichthen led to decent concession for the long bond auction BUT …
Thu, May 8, 1:06 PM BMO: 30-year auction tails 0.8 bp -- lowest indirects since Nov. '19
* Today's 30-year auction was soft with a tail of 0.8 bp and non-dealer bidding of 86.1% vs. an 83.2% 6-refunding average.
* 30-year auction stopped at 4.819% vs. a six refunding average of 4.572%.
* Bid/Cover was 2.31x compared to an average of 2.39x.
* Dealers took 13.9% vs. a 16.8% average.
* Directs claimed 27.2% vs. an 18.4% norm.
* Indirects were awarded 58.9% vs. an average of 64.8%.
* Before the auction, the long bond was under pressure on average trading volumes and 30-year yields headed into 1pm EST at the session highs. Since the result, bonds have sold off in the follow-through.
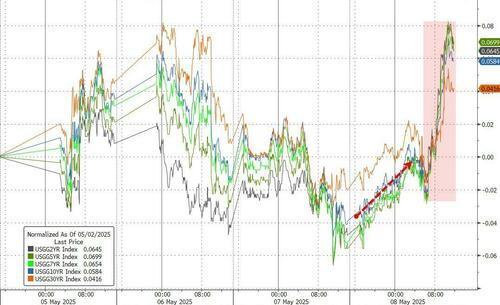
… it apparently wasn’t enough and / OR perhaps far more simple than all that. Stocks went UP (Trump comments, deal hope, NYPost) by days END, the bond market, well, got crushed and stocks were bid … Here’s a look at 5yy (many have exposure here) …
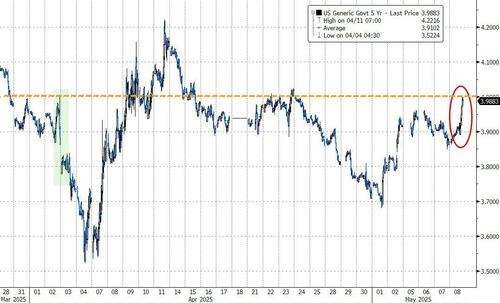
5yy DAILY: 4.00% on the radar screen …
… as momentum becoming overSOLD as we approach (daily) TLINE SUPP up nearer 4.10%, would be far more compelling at least to ME, if asked or I had to commit capital (mine or someone elses …)
… AND a couple more funTERtaining links / recaps for your dining and dancing pleasure …
ZH: Bitcoin & Big-Tech Soar As Beijing, Brits, & Better Data Spark Bond Bloodbath
"If you’re bearish, you’re consensus..." warns top Goldman trader Brian Garrett, adding that "doesn’t mean you are wrong, but you are in the majority."
The AAII survey has been published every week since 1987 (investors are either bullish, bearish, or neutral).
In the history of this survey, investors have *never* been this consistently bearish… for 11 straight weeks, >50% or respondents have been negative on the market...
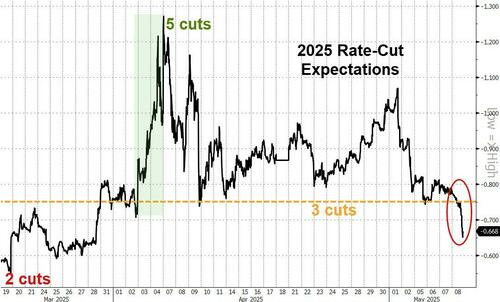
…All this 'good' news sent rate-cut expectations (hawkishly) plunging (now back below 3 cuts priced in for 2025 - less than before Liberation Day)...
…Treasuries were clubbed like a baby seal with yields up dramatically across the curve (led by the short-end 2Y +13bps, 30Y +6bps)...
Source: Bloomberg
The 5Y yield surged back up to 4.00% (the level it was trading at right before Liberation Day)...
ZH: Markets Soar As Trump Says "Better Go Buy Stocks Now"
… AND he said nuthin’ bout buyin’ 5s … standing by, waiting but for now … here is a snapshot OF USTs as of 705a:
… HEREis what this shop says be behind the price action overnight…
… WHILE YOU SLEPT Treasuries are twist steepening, pivoting around the 7yr point in mostly quiet conditions. Our desk saw some early demand out the curve from real money in 20s-30s, countering the initial steepening move with 2s30s ~3bps off the steeps’ of the session. Volumes remain light in the context of recent averages, with systematic accounts unwinding some auction plays. S&P futures are showing +0.3% here at 6:55am, Crude +2%, Gold +0.5%, DXY -0.2% and 2s5s10s -1bps richer.
… for somewhat MORE of the news you might be able to use … a few more curated links for your dining and dancing pleasure …
NEWSQUAWK US Market Open: US equity futures trade cautiously & DXY a little lower ahead of a slew of Fed speak & looming US-China talks … USTs are essentially unchanged as newsflow since Thursday’s flurry of trade updates, which weighed on the benchmark into/after settlement, has been a little lighter. USTs at the bottom-end of a 110-25 to 110-30 band and by extension towards Thursday’s 110-24 base. We await anything fresh on the trade front and confirmation/rebuttal from the administration on the piece in the NY Post (and other vendors since) that China tariffs could be cut to as low as 50% next week. Today's docket is light on the data front but will see a slew of Fed speakers throughout the day.
Finviz (for everything else I might have overlooked …)
Moving from some of the news to some of THE VIEWS you might be able to use… here’s some of what Global Wall St is sayin’ …
… thinkin’ bout next weeks CPI? yer not alone … a precap …
8 May 2025 Barclays: US CPI Inflation Preview (April 2025 CPI): April core CPI: Still too early for tariff effects
We forecast core CPI inflation accelerated to 0.24% m/m (2.8% y/y) in April, from 0.06% m/m in March, amid some unwind in price declines for volatile categories. We estimate headline CPI rounded up to 0.3% m/m (2.3% y/y), and the NSA index was at 320.876.
… somewhat related, same shop thinkin (global) stonks …
9 May 2025 Barclays: Equity Market Review Bring on the deals
A lot is baked in, but the 'don't fight Trump' mantra may still prevail so long as there is a path towards more deals & less tariffs. Although stocks have bounced, EU exporters/trade/China plays are lagging and dollar risk premium remains high. Rate cuts and trade deal improve the FTSE250 narrative.
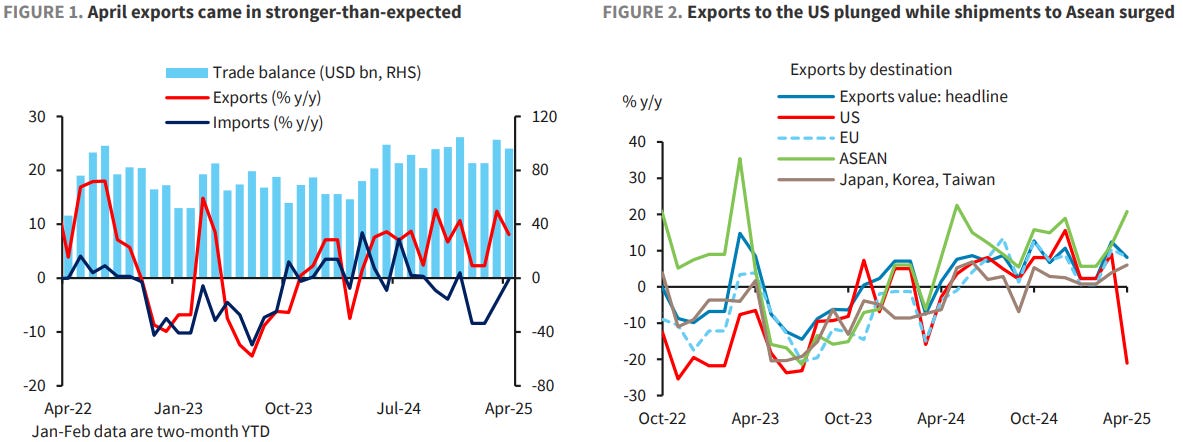
… and as ALL this relates TO … China and exports data o/n …
9 May 2025 Barclays: China: Still robust exports on trans-shipments
Stronger-than-expected exports likely due to exporters' increased trade rerouting via third-party countries (including Asean) given the 90-day tariff pause. But trans-shipments are facing rising US scrutiny. Exports data will likely be volatile in the near term.
April: 8.1% y/y for exports, and -0.2% y/y for imports (both in USD terms)
Bloomberg consensus (Barclays): 2% y/y (5%) for exports, and 1% y/y (-6%) for imports
March: 12.4% y/y for exports, and -4.3% y/y for imports (both in USD terms)
Here’s an interesting question posed by best in the biz as the days dust settled …
The tone of the conversations in the US rates market have shifted away from ‘is this really happening?’ to ‘could this really work?’ The US and UK have reached a new trade deal that is being viewed favorably by risk assets (primarily US stocks) and triggered a fresh round of selling interest in Treasuries. The 2-year sector has led the selloff. The logic is relatively straight forward; in the wake of Powell’s hawkish stance (or lack of dovish cues), progress on trade deals implies that the FOMC will have the flexibility to delay cuts longer than would have been the case had there been near-term negative fallout for the real economy. Of course, the strength of April’s employment data also once again demonstrated the resilience of the labor market. Investors are still grappling with the weakness in soft (surveybased) data versus the continued strength of the hard data. We’re cognizant that the primary concern limiting a more meaningful selloff further out the curve is that the impact from the trade war will be short-term inflationary but medium-term recessionary.
A US/UK trade deal and this weekend’s US/China trade talks have rekindled hopes that a dire impact on the pace of US growth might yet be avoided…
…It goes without saying that a lot can happen between now and July 8th – the end of Trump’s pause on reciprocal tariffs. Moreover, the magnitude of the trade imbalance with China leaves this weekend’s meeting as potentially far more relevant to forward inflation and growth expectations. It’s worth noting that breakevens widened on the news of the US/UK deal – a move that reflects falling odds of a recession versus revised estimates of the near-term inflationary impact.
The cheapening of the front-end of the market has been associated with falling odds of a June rate cut – which now stand at roughly 17% with 4.3 bp priced in. While we don’t think the FOMC lowers rates next month, it wouldn’t be surprising to see this probability increase in the coming weeks before trending down into the event itself. However, Friday’s wall of Fed-speak will most likely to reinforce the Chair’s sentiment that while the trade war has led to elevated uncertainty for the outlook, the Committee isn’t in a hurry to resume normalizing rates. As a result, the implied probability of a June cut will likely be pressured even lower ahead of the weekend, suggesting more bearish pressure on the 2-year sector…
… maybe, just maybe it’ll work? Moving along and thinkin’ bout next weeks CPI? yer not alone … a precap …
08 May 2025 BNP: US April CPI preview: Watching for tariff ripples
KEY MESSAGES
The April CPI release may be too early to see significant tariff-driven price increases, as US companies balance the push and pull between contending with increasingly high tariff rates and uncertainty over their persistence at current levels.
We expect accelerations in used vehicles and core goods excluding used vehicles to propel core CPI to a 0.26% m/m gain for the month. Anticipated declines in egg and gasoline prices may limit headline CPI to a 0.2% rounded print.
Risks look balanced. Car dealers may be more responsive to tariffs than our baseline, posing upside risks to used vehicle prices, while negative seasonal factors and lower fuel prices introduce suggest downside risks to airfares and hotel prices.
We maintain our long-held view that tariffs will translate to substantially higher US inflation. We see domestic prices heating up materially by summer, with y/y core CPI peaking at 4.4% by Q2 2026.
While tariffs and deals important, DJT say what …?
The most important words yesterday seemed to be Trump's comments when talking about Congress passing his tax bill. He said "If that happens, on top of all of these trade deals that we're doing, this country will hit a point - you better go out and buy stocks now". On cue, the market bought stocks and extended a rally that began 30 minutes earlier amid the announcement of a US-UK trade deal and Trump’s more conciliatory comments towards China. The rally lost some of its luster late on after reporting that Trump is pushing for a tax hike on very high earners with the S&P 500 (+0.58%) closing 1pp below its intra-days highs, while 2 and 10yr USTs spiked +9.7bps and +10.9bps on the day respectively. So as per usual, there is a lot going on at the moment ahead of the weekend US/China trade talks in Geneva…
…By contrast Treasuries sold off, with 2yr yields (+9.7bps) rising to their highest level in four weeks at 3.88%, while 10yr yields rose +10.9bps to 4.38%. Also contributing to the bond sell off was a slightly weak 30yr auction that followed a strong 10yr auction the previous day. The combination of higher US yields and stronger US risk assets saw the dollar index (+1.03%) post its best day since November 6, the day after Trump’s election win. This morning in Asia, 2yr ( -1.2bps) and 10yr USTs (-2.0bps) yields are reversing a little of yesterday's move…
They say tariffs are inflationary and so, will leave rates higher for longer … THEY as in this large German operation, for example …
Could US tariffs result in higher equilibrium level of interest rates? Yes.
As previously noted, r* isn't equivalent to potential growth. In the US, “other determinants" (i.e., the supply/demand of savings) account for ~80% of the post-GFC decline in r*, compared to only ~20% for potential growth. Tariffs represent a negative supply shock for the US that could lower potential growth (and thus r*). However, fiscal policy among key US trading partners has become notably more accommodative in response to US tariffs. Consequently, the "other determinants" component of r* is likely to increase.
Early evidence suggests that the shift in the global supply/demand of savings is outweighing the decline in potential growth. Bearing in mind the limitations of real-time r* estimates, the estimate derived from the bond/equity correlation continues its upward trend, reaching a post-GFC high following the US tariffs announcement.
.. in as far as uncertainty goes …
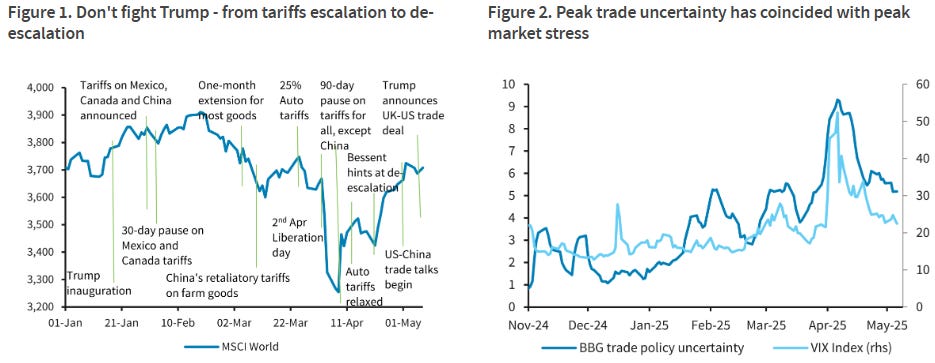
08 May 2025 DB: Trade policy uncertainty: There's too much confusion, I can't get no relief
In recent work we replicated and extended analysis by Federal Reserve staff which quantified the impact of trade policy uncertainty on the economy (see “Analysis of the paralysis from trade policy uncertainty” and “The short and variable lags of trade policy uncertainty”). At the time we warned that the results were a best-case scenario, as it assumed trade policy uncertainty would quickly revert to historical averages rather than persisting at elevated levels.
We update that analysis using data for trade policy uncertainty through April. Unsurprisingly, the April 2nd Liberation Day announcements which lifted tariffs to the highest level in a century, and subsequent partial reversal of some tariffs but further escalation with China, led to record readings for trade policy uncertainty last month.
Updated results suggest that annualized real GDP could be depressed by as much as 2.5 percentage points in Q3 and Q4 2025. This estimated drag is meaningfully larger than the 1-1.5 percentage points dent estimated using TPU data through February and March. These results are consistent with our forecast of near zero growth in H2 and still elevated recession risks.
…We update that analysis using data for TPU through April. Unsurprisingly, the April 2nd Liberation Day announcements which lifted tariffs to the highest level in a century, and subsequent partial reversal of some tariffs but further escalation with China, led to a further spike in TPU last month. Indeed, both the Fed staff and BBD measures of TPU jumped to record highs in April (Figure 1).
… somewhat MORE on Chinese exports data …
9 May 2025 ING: Reports of the death of Chinese exports have been greatly exaggerated
Chinese exports bucked expectations in a sharper slowdown in April, rising 8.1% year on year. This, despite a -21% YoY drop in exports to the US, showing efforts to pivot to other markets are paying off.
Stronger-than-forecast trade data across the board in April
...Trade with the US slowed sharply but by less than feared
BoE cuts rates by 25bp, but two members favor a hold; US-UK trade deal announcement; risk-on flows support a UST sell-off; USD gains and safe-havens underperform; USD/INR rises amid geopolitical uncertainty; BRL gains after BCB hike; DXY at 100.63 (+1.0%); US 10y at 4.379% (+10.9bp)
Same shop … thinkin ‘bout NEXT weeks’ CPI? yer not alone … a(nother)precap …
May 8, 2025 MS: CPI Preview: Before the tariff push
We forecast core CPI at 0.23% m/m in April (2.8% y/y). We don't expect tariffs to boost goods prices meaningfully yet: new cars accelerate but it is partially offset by another negative used cars print. Services inflation accelerates. We see headline at 0.23% m/m, 2.3% y/y, NSA Index: 320.838.
…USTs cheapen (5y: +12bp) as the sell-off in gilts, risk-on flows, and a 30y auction tail send yields higher; hawkish FED OIS repricing with the market implied rate for December 2025 rising 10bp d/d…
… same shop on the tax PLAN cometh …
May 9, 2025 MS: US Public Policy: The Tax Plan Cometh
Investors are increasingly focused on the impact of Congress's proposed tax & spending policy changes on deficits and the economy. Our base case is that a politically viable fiscal package will be composed of tax cut extensions with incremental tax cuts mostly offset by "pay-fors". The key driver of projected deficit expansion in 2026 is slowing economic growth & cost growth embedded in current policy, and this fiscal package would add modestly to that baseline. Accounting for potential tariff revenue as a mitigant, we expect a 2026 deficit of 7.1% of GDP (vs. 6.7% in 2025), an increase of ~$310B YoY.
… AND from tax plan TO the economy, Gapen’s latest weekly all ‘bout Fed on HOLD …
May 9, 2025 MS: US Economics Weekly: In a Holding Pattern
The Fed is on hold, waiting for clearer signals of inflation and employment. Imports were strong in 1Q, but we don't think they ease inflationary pressure from tariffs because front-loading wasn't broad-based. We expect the inflationary impulse to begin to show in May prices and to peak this summer.
Key takeaways
In line with our expectations, the Fed reiterated that policy is well positioned to wait before making policy adjustments.
Real imports surged in 1Q, rising 41.3% (q/q saar). The largest pickups were from Vietnam, India, and the Euro area. Goods imports from China have fallen.
The faster imports are less likely to mute inflationary pressure as the largest increases were in categories that are currently exempted.
Here’s something else I can relate too … makin’ mountains outta molehills …
Yesterday’s Anglo-US trade framework was preceded by substantial media spin but ultimately revealed only minimal substance. US consumers are worse off than in January, though better off than a week ago. Some UK exporters get better conditions, some US exporters might get better conditions. Yesterday’s Bank of England’s rate cut was a more important economic event.
Two things did matter from yesterday’s media opportunity. US President Trump signalled that US consumers will continue under the burden of a 10% universal trade tax (with a few “friends and family” tax discounts). Trump also suggested all imports were bad for the US, setting a tone for future trade discussions. If this is truly what Trump believes then the administration’s trade policies must be considered a negative for US living standards.
Investors face a pontification of central bankers. The Bank of England’s Governor Bailey and Chief Economist Pill speak, having voted on different sides in yesterday’s rate cut. The several Federal Reserve speakers will presumably collectively shrug their shoulders at the uncertainty of everything.
China’s April trade data is due in the near future. This will be affected by the US tariffs. However China has a history of avoiding Trump’s trade taxes, and trade with other nations should not be too disrupted.
Here’s hoping you have a most productive day ahead … seriously … AND same shop asks / attempts to answer THE question on all our minds …
May 8, 2025 Wells Fargo: Q1 Contraction Obscures the View: Productivity Growth Still Solid
Summary Nonfarm labor productivity contracted at a 0.8% annualized rate in Q1. While eye-catching, productivity is noisy quarter-to-quarter, particularly given the trade-induced negative GDP growth print in Q1. When smoothing through recent choppiness, the underlying trend in labor productivity growth remains firm. Consequently, the underlying increase in unit labor costs is consistent with inflation eventually returning to the Federal Reserve's 2% inflation target. That said, risk lies ahead. Slow growth in the labor supply could exert upward pressure on labor costs even as demand for workers eases, and tariffs pose some downside risk to productivity.
May 9, 2025 Wells Fargo: Soft-Landing, or No Soft-Landing, That is the Question Q1 Update
Summary
In September, we wrote a five-part series of reports that introduced a new toolkit to predict the probability of soft-landing, stagflation and recessionary episodes. The toolkit also predicts the probability of a monetary policy pivot occurring in the next two quarters. In this report, we update our framework with Q1 data.
In the first quarter, the soft-landing probability decreased from 44% to 40%. Meanwhile, the recession and stagflation probabilities increased to 27% and 28%, respectively.
The probabilities of each growth scenario saw a reversal in direction during the first quarter. While the change in the trend of probabilities is not a concern yet, it is something to be watched over the next few quarters, especially if the upticks in the stagflation and recession probabilities start to solidify.
…We readily acknowledge the outlook for the growth probabilities is cloudier than normal due to uncertainty surrounding U.S. trade policy. We have maintained it would be a bit extreme to assume tariff rates remain at current levels, as the Trump Administration could reduce tariffs, at least partially, through deals with other countries. We thus assume the effective tariff rate will recede to about 15% and remain there through the end of 2026, imparting a modest stagflationary shock to the economy. As written in our monthly economic outlook report, we anticipate a bumpy ride for GDP growth this year as consumer and business spending dips in the wake of the pre-tariff spending surge that occurred during Q1 and likely carried into early Q2. Additionally, if hiked tariffs are sustained, we look for a push higher in consumer prices. If realized, both the stagflation and recession growth probabilities may increase in the near quarters. As such, we will be closely watching the growth probabilities for any red flags. Stay tuned.
… And from the Global Wall Street inbox TO the intertubes, a few curated links …
Models … whats NOT to like …
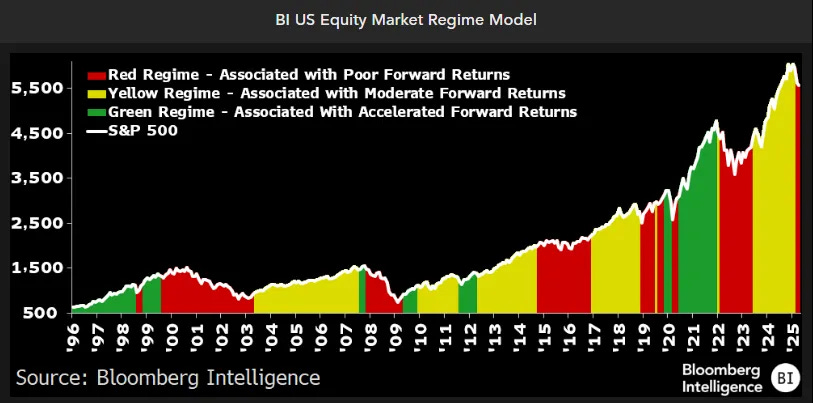
May 9, 2025 at 9:30 AM UTC Bloomberg: Key S&P 500 Model Turns Bearish for First Time in Two Years
A stock-market indicator has entered a phase historically associated with the worst return prospects for the S&P 500 Index after trade fears gripped financial markets and dimmed Corporate America’s outlook for profit growth.
The Equity Market Regime Model, a Bloomberg Intelligence model that tracks the benchmark stock gauge and clusters periods into three phases — accelerated growth (green), moderate growth (yellow) and decline (red) — fell into the cautious red zone in March and April, according to data compiled by BI’s Gina Martin Adams and Gillian Wolff.
The seven prior instances have been associated with a 5.6% average drop in the S&P 500 in the next 12 months. The current red regime is the model’s first bearish signal since February 2022, when anxiety about the Federal Reserve’s interest-rate path sent US stocks into a bear market.
It’s hard to ascertain exactly what this means for the S&P 500. The red regime, which follows 21 months in the neutral “yellow” zone, is still in the early innings for most of the model’s components. While this may mean there are more losses ahead, unpredictable US trade policy has left investors debating whether the worst part of the selloff is over.
“Either the global trade war comes to an end soon and all of this resolves itself, or the selling in stocks needs to get worse, with people throwing in the towel before things get so bad that it turns into a buying opportunity,” Wolff, an equity strategist, said by phone. “But we’re not there yet.”
Source: Bloomberg Intelligence
The model is based on six factors, including the correlation between index member returns, the S&P 500’s position compared to its 200-day moving average and the benchmark’s annual change in price-to-book.
The biggest warning sign that pushed the indicator into red territory was when the S&P 500 closed below its 200-DMA in March, the first time since November 2023. The index currently sits roughly 1% below its long-term support line after sliding as much as 13% below it. That said, its year-over-year price-to-book ratio has also slumped to levels consistent with past red regimes.
Other model components are only showing early signs of deterioration.
For instance, the year-over-year change in forward earnings estimates is well above its five-year average, but is falling toward red regime norms. M2 money supply growth — a measure of excess cash in the market, and an indicator of rising inflation — is picking up, but remains below levels hit when the Fed has intervened, suggesting policymakers aren’t too concerned about slowing economic growth.
On Wednesday, Fed Chair Jerome Powell made clear he won’t be rushed into lowering borrowing costs until there’s more certainty on the direction of trade policy from the White House. Powell — acknowledging that consumer and business sentiment had darkened — said the hard data still paint a picture of a healthy economy.
Source: Bloomberg Intelligence
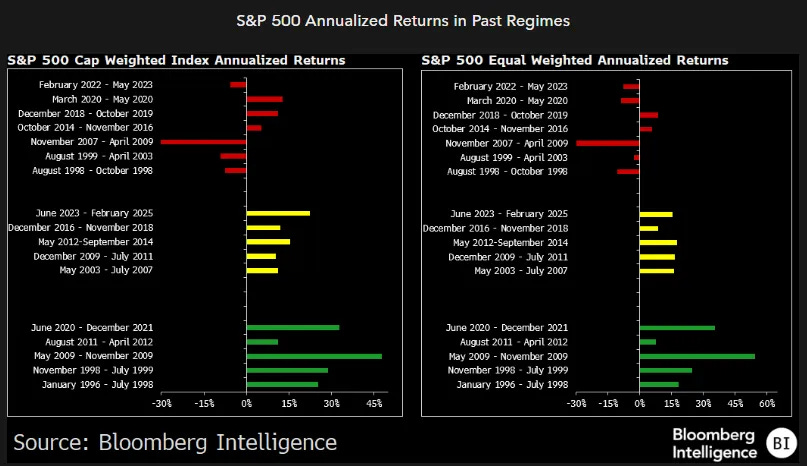
Red regimes usually coincide with stretches of negative annualized returns and typically last about 16 months, according to data compiled by BI for trading going back to 1996. A red regime records a 5.6% average annualized loss in the S&P 500, compared to a 29% average gain in a green period. The most recent one started in June 2020, as US stocks rebounded following a pandemic-induced selloff.
For BI’s model to become more bullish, the White House would likely need to deescalate on protectionism, thereby easing stagflation fears and possibly improving Corporate America’s profit outlook, according to Seth Merrill, chief investment officer at Crewe Advisors.
“There’s a growing belief that the Trump administration will back off its aggressive tariff policy once further weakness begins to show up in jobs growth,” Merrill said by phone. “But here’s the risk: By the time that happens it may be too little, too late since earnings growth is already slowing, which may trigger more selling if the economic outlook deteriorates further from here.”
Bonds. Like ‘em or not. Here’s a view for each of your views …
Carson: The Bull and Bear Case for Bonds By Barry Gilbert, Wednesday, May 7, 2025 3:02 PM
Bonds have actually had a good run over the last year (for bonds). The Bloomberg US Aggregate Bond Index (“Agg”) is up 5.8% trailing year as of yesterday’s close versus 4.9% for the Bloomberg US 1-3 Month Treasury Bill Index. That’s a fair discount to the S&P 500 over the same period (9.7%), but still not bad. Year to date the numbers look a little better after a rocky start to the year for stocks: 2.5% for the Agg versus 1.5% for the Treasury Bill Index and -4.3% for the S&P 500 (but +13.7% year to date for the MSCI EAFE Index of international developed stocks!).
As I think about the next six months to a year for fixed income, here are some things on my mind…
…Investment Takeaway Bonds have a good thing going for them right now in higher yields. If yields stay constant, the yield to maturity is the expected return you’ll get. That’s 4.65% for the Agg as of yesterday’s close. We still think stocks are solidly more attractive, but it’s a much better starting point for bonds than we’ve had for much of the last fifteen years.
The uncertain environment, however, does mean that there’s some downside risk for bonds. If we get either our bull case or neutral case for bonds, Agg returns may be modest over the next year. We don’t think they’ll be negative, but they are likely to trail Treasury bills.
AND a fan fav recession indicator …
May 8, 2025 WolfST: Recession Watch: Time to Dig Out Our Favorite Recession Indicator Again
Recession talk is swirling densely all over the place, so let’s have a look.
What are we looking for? The National Bureau of Economic Research (NBER), which calls the official recessions in the US, has always defined recessions as broad economic downturns that include downturns in the labor market, such as declines in employment and significantly rising unemployment.
Weekly data for unemployment insurance benefits are the earliest indicators of systemic job losses. Among the data sets, weekly continued claims for unemployment benefits, also called “insured unemployment,” is our favorite Recession Indicator. It essentially counts the number of people receiving unemployment benefits after their initial claim.
The prior three business cycle recessions – not counting the Pandemic which was a lockdown, not a business cycle recession – came after Insured Unemployment had surged to:
2.64 million in December 2008, beg. of Great Recession 2.56 million in March 2001, beg. of 2001 Recession 2.49 million in July 1990, beg. of 1990 Recession.
The levels that entail a recession have risen as total employment has risen. This growth of employment over the years causes the Recession Indicator line to be slanted upward (black slanted line in the chart below).
Today, about 2.7 million insured unemployment would indicate the beginning of a recession.
But insured unemployment dipped by 29,000 in the latest week, to 1.88 million, according to the Labor Department today. The four-week average edged up by 8,750 to 1.87 million, essentially unchanged since October. These levels are still historically low, and far below the Recession Indicator of 2.7 million. The purple columns indicate recessions.
Watch for 1. surge to 2. high levels. This takes two factors: a surge, and high levels. Note how insured unemployment began to surge before a recession. It’s this kind of surge to much higher levels that we need to watch out for.
There was a surge in 2023, but from record low levels during the labor shortages, and since the level it surged to was still so low, that surge did not entail a recession; it just “rebalanced” the labor market.
This measure is a combination of two factors: Essentially, how many people got laid off, and how long it takes them to find a new job. If it takes people longer to find a job, even if there are few new people getting laid off, then that measure slowly rises, which was the case in 2024. But it has been roughly unchanged for the past six months.
It surges when there are suddenly lots of layoffs that the labor market cannot absorb, and the number of people receiving unemployment benefit rises sharply to much higher levels. That’s the recession indicator.
Layoffs are still historically low. Weekly initial claims for unemployment insurance benefits – people initially filing for unemployment insurance benefits after they got laid off – dipped by 13,000 in the latest week, to 228,000 seasonally adjusted, according to the Department of Labor today.
The four-week average, which irons out the week-to-week squiggles, edged up 1,000 to 227,000 and is historically low. The purple columns indicate recessions.
Note how those claims begin to surge before a business cycle recession (the 2020 recession wasn’t a business cycle recession but a lockdown).
The fact that insured unemployment (first chart) has risen from the labor-shortage lows in 2022, despite the low number of new layoffs (initial claims, second chart) indicates that it now takes more time to find a new job than it did back in 2022. And the low number of initial claims shows that few people are getting laid off. So companies are not cutting staff, but they’re slower in hiring than they were in 2022, though historically they’re still absorbing people at a fast clip.
These are signs of a reasonably “balanced” labor market, where supply of labor and demand for labor are roughly balanced, and that the labor shortages and the huge churn in the labor force in 2021 and 2022 are gone.
Negative GDP growth for other reasons. When a historic spike in imports, which are subtracted from GDP, pushes GDP growth into the negative, it’s not an indicator of a recession. A spike in imports is not a sign of weak demand, on the contrary. In Q1 2025, this situation happened, same as in Q1 2022, but consumer spending growth was OK and business investment was very strong, and so this was not a recessionary indication. But GDP is released quarterly and way behind.
Leading indicator. This data on unemployment insurance benefits is weekly and more immediate than monthly or quarterly data, and its surge to a high level warns of a recession in advance, which makes the Recession Indicator a leading indicator.


https://t.co/OB5rLZIJ6K
President Donald Trump says he won't seek a meeting with the Fed Chair because talking to Jerome Powell is like "talking to a wall"