while WE slept: USTs are cheaper / steeper; history lessons from US elections; index extensions; 2yr BREAKS; debt delinq probs for higher inc folks 8.43% (FRBNY)
Good morning … as the days TO NFP and next weeks election draw closer and vol increases I’ll have less to say and at the risk of confusing causation and correlation …
ZH: Ugly 2Y Auction Sends Yields To Session High As Trump Odds Soar ZH: Sloppy 5 Year Auction Tails Despite Record Foreign Demand
… then there was the good news …
ZH: Treasury Trims Debt Estimates For Current Quarter, But Q1 Borrowing Surge To Follow
… ok so … not such great news with increased issuance all but a ‘sure thing’ and so, by days end … stocks doing what stocks do best …
Oil prices fell sharply amid an unwind of hedges against a potential disruption in Iranian supplies, after retaliatory strikes by Israel spared oil installations. As market participants weigh weak demand signals against strengthening Middle East exports, we see value in going long the June 2025 Rbob crack spread.
The sell-off in oil prices following Israel's retaliatory strikes that spared oil assets seems primarily a function of an unwind of hedges against the opposite outcome. The move in time spreads signals a continuation of recent gradual weakening in fundamentals, driven primarily by Asian demand and Middle East exports.
At $70/b, December 2025 Brent futures are trading $10/b below our fair value estimate for Q4 25 and close to the low end of the $65-90/b range outlined in the Blue Drum based on a range of outcomes on demand and OPEC+ supply, but we think going long the Rbob crack spread offers better risk-reward.
… because you’ve not heard ‘nuff ‘bout that ‘thing’ we’ve got next week here in USA, a recap AND some history lessons (hopefully)learned …
…it's now only one week to go to the US election, with prediction, betting and financial markets increasingly leaning towards a Trump victory. Yesterday saw 10yr US yields rise +4.2bps, not helped by a pair of softer Treasury auctions, and despite an outsized -6% drop in oil prices. Elsewhere, the Trump Media and Technology Group rose +21.59% to its highest level since June and Bitcoin has traded at $71k overnight, also the highest level since June after being as low as 53k in the first week of September…
…It's very rare to see such a big rise in US yields on a day that oil fell as much as it did (-6.09% for Brent) after Israel’s strikes on Iran on Saturday were focused on military targets rather than any oil facilities. The fall in oil, which was the largest since August 2022, did help drive broad gains for the S&P 500 (+0.27%) with 70% of its constituents higher on the day. The index is now less than 1% away from its last all-time high on October 18. The notable exceptions from the positive mood were energy (-0.65%) and information technology (-0.07%) stocks. The latter came as the Mag-7 (-0.13%) saw a slight decline, mostly due to Tesla (-2.48%) losing some ground after its impressive gain last week. By contrast, the Russell 2000 (+1.63%) posted a solid advance, while the KBW Bank index (+2.15%) rose to its highest level since March 2022. In Europe, the STOXX 600 (+0.41%), the CAC 40 (+0.79%) and the DAX (+0.35%) were also comfortably higher. Attention will swiftly turn to earnings now, including Alphabet due after the US close today.
The moves in Treasuries were fairly uniform across the curve with 2yr yields +3.4bps higher, leaving 2 and 10yr yields at their highest levels since August 1 and July 24, respectively. 10yr real yields (+4.2bps) also moved up to a three-month high of 1.99%. The bond move wasn’t helped by a pair of slightly soft Treasury auctions. A 2yr auction saw the highest primary dealer take-up since December, while 5yr notes were issued +1.6bps above the when issued yield with the primary dealer take up the highest since May. So some signs of investors being more price sensitive in their exposure to Treasuries. Showing how this was perhaps more of a fiscal story or supply story yesterday, rather than an inflation one, at least as a first order effect, the US 2yr inflation swap was down -3.1bps to 2.40%, and of course helped by the slump in oil.
Moreover, with expectations of looser fiscal policy, that’s led investors to keep dialling back how many rate cuts they expect from the Fed next year, and markets are now pricing in their most hawkish path since the market turmoil kicked off back in the summer. For instance, the rate priced in for the December 2025 meeting moved up to 3.54%, having been as low as 2.78% back in mid-September.
Staying with fiscal policy, the Treasury’s latest borrowing estimates were issued late in the US session. This saw borrowing estimates of $546bn for Q4 (down from the previous $565bn estimate) and $823bn for Q1 2025, both of which were somewhat smaller than our rates strategists’ expectations. So a bit better news for bonds but one that awaits a new President.
DB: Mapping Markets: Four history lessons on the US election
The US election on November 5 will be pivotal for markets – not least given the potential implications for trade and fiscal policy. Our strategists have written about the implications across several asset classes, but it’s also worth thinking through some previous elections as to how the market reaction could play out.
Four lessons come to mind:
Over-relying on the 2016 market playbook could prove risky, as prediction models and betting markets now imply Trump is slightly ahead, rather than the underdog. So a Trump victory wouldn’t be the same shock to markets as it was in 2016.
A meaningfully contested result has historically been bad for US equities, as seen in both 2000 and 1876.
Control of Congress matters too – every new President since Bill Clinton has initially seen their party control both chambers of Congress, but it’s not inevitable this happens. If so, that would have major implications for the new President’s ability to implement their agenda.
Polling errors (if any) are likely to be correlated in the same direction, including in the battle for Congress.
… a decent discussion of buying needs and duration extensions regardless of event risk where managers benched to an index could choose to do nothing as October comes to a close and that would in and of itself be doing something …
Eurogovies extend by 0.101y, in line with Oct avg, higher than monthly avg; USTs 0.046y, lower than avg; UKT 0.161y, higher than avg; eurolinkers 0.011y, lower than avg; TIPS to extend by 0.132y, higher than avg; UKTi 1y+ to extend marginally, 0-5y to contract.
…United States We expect the 1y+ UST index to extend by ~0.046y, compared to an average October (0.08y) and an average month (0.075y) – Exhibit 8 . A total of about US$315 billion of supply (offered amount) will affect the extension, and US$180 billion market value of bonds will fall out of the index. The monthly issuance of 2y, 3y, 5y, 7y, 10y, 20y, and 30y will affect the respective maturity-wise indices.
… finally, the good doctor is in and while not directly addressing bond vigilantes, well, this …
Republican Everett Dirksen was the Senate Minority Leader during the 1960s. Cautioning that federal spending had a way of getting out of control, Dirksen reportedly observed, "A billion here, a billion there, and pretty soon you're talking real money." Proponents of Modern Monetary Theory (MMT) have been claiming in recent years that the US federal government can run large budget deficits to fund social welfare programs without any serious adverse economic or financial consequences.
MMT’s claim that a government that borrows in its own currency can finance its spending at will with more debt lost credibility as inflation soared in 2022 and 2023. But now it seems to be working. As much as we dislike MMT, we have to admit that tremendous fiscal stimulus by the current administration helped to offset the tightening of monetary policy, thus helping to avert a recession (along with other stimulative forces such as spending by retiring Baby Boomers). Nevertheless, while the y/y inflation rate has subsided, prices are much higher now than at the start of the pandemic (chart).
Even more troubling is that MMT is essentially intergenerational theft. The Baby Boomers enjoyed the benefits of government spending without fully funding such outlays with tax receipts. Meanwhile, they managed to accumulate $79.8 trillion in net worth for themselves (chart)…
…We are discussing this topic because the Treasury announced its marketable borrowing estimates today. The projected financing is $546 billion in Q4-2024 and $823 billion during Q1-2025.
Might this explain why the bond yield has risen from 3.62% on September 16 to 4.27% today even though the Fed cut the federal funds rate by 50bps on September 18? Yes, of course. We did anticipate this move on better-than-expected economic indicators, not the beginning of another debt crisis as occurred from August to October 2023. We've also always said that when the bond market starts to worry about the federal deficit and debt, we will do so too. That may be starting to happen as the bond market recognizes that the November 5 elections won't change the reckless course of fiscal policy.
For now, we are forecasting that the bond yield will be range-bound between 4.25% and 4.50% through yearend. The S&P 500 should end the year around 5800, where it is now on jitters about the bond market's response to the next administration.
A billion here, a billion there, and pretty soon you're talking real money.
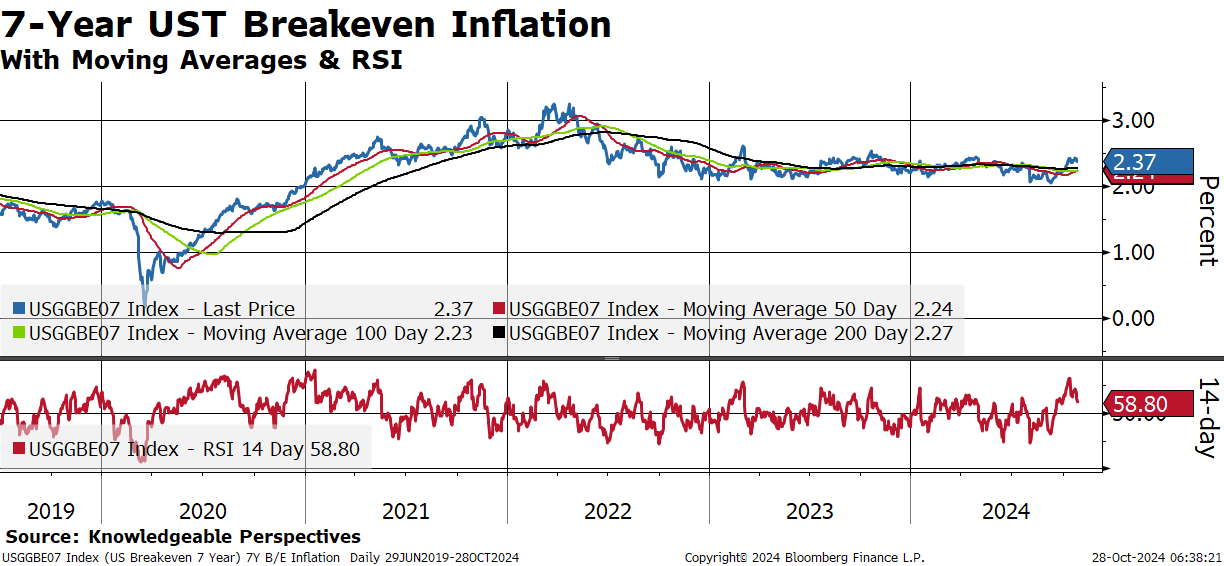
The 2-year inflation expectations just saw their most extreme increase since inflation trends began in late 2020.
While I’m cautious not to rely too heavily on any single indicator, especially given the lack of liquidity of 2-year breakevens, I believe the surge in gold prices is sending a similar signal.
In my view, the genie has been out of the bottle since late 2020, and inflationary trends remain deeply rooted in the economy.
… taking a somewhat longer view (if only in name …)
Despite encouraging earnings reports from various S&P500 companies like Tesla and UPS, the global equity market struggled last week. Indeed, in most parts of the globe, key equity markets were lower. In Asia, Japanese, Korean and Taiwanese equity markets were all down (with the Nikkei 225 index 2.1% lower). In Europe, key equity markets (including the DAX, CAC and MIB) rolled over; while in the US, small and mid-caps performed poorly (approx. 2.5 – 3% lower on the week), the S&P500 was 1% lower, while tech (NDX100 & Philly SOX) was one of the few areas to (just) post a positive weekly return.
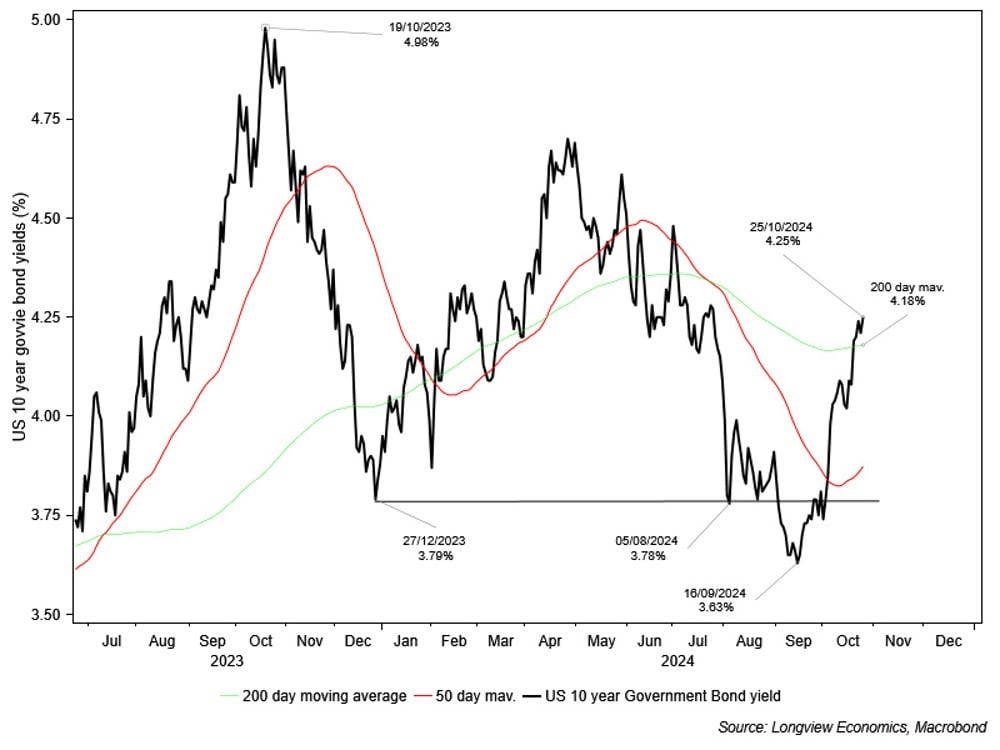
Rising 10-year bond yields acted as a brake on equity markets. The US 10-year Treasury yield reached a high of 4.26% on Wednesday, up sharply since its mid-September lows (3.63%) – see chart. As a result, bonds are now oversold (while equities were overbought earlier this month). The breadth of the recent equity advance (up to the start of this past week) has also narrowed as the sector and single stock participation has dwindled. Our views on the drivers of this latest bond move, and what to expect next, are laid out in yesterday’s ‘Longview on Friday’ publication.
This coming week, major macroeconomic and earnings data is set to be released that is likely to be important for the market. That includes US consumer confidence and JOLTS job openings (Tuesday), GDP reports for major Eurozone economies and the US (Wednesday), and US nonfarm payrolls (Friday). Alongside that, all eyes will be on the upcoming earnings reports from 5 of the Magnificent 7 companies (Apple, Microsoft, Alphabet, Amazon and Meta); while in the UK the long awaited first budget of the new Labour government will be announced on Wednesday. A full list of key events is laid out below.
Key chart: US 10-year bond yields shown with key moving averages
… and from / for Team Rate CUT, a tweet …
at SoberLook
An increasing percentage of US higher-income households are struggling with debt.


https://www.barchart.com/story/news/29276744/us-job-openings-fell-in-september-to-a-3-12-year-low