Good morning … outta pocket yesterday. What did I miss? Looks to ME like 4.843% support HELD (this is NOT victory lap / I-told-ya-so) and here we are right back down at 50dMA resistance (4.734). This afternoons daily and WEEKLY close will warrant some further review but in as far as drivers OF price action and current BID and whatever I missed …
ZH: Producer Prices Surge At Fastest Pace In 2 Years As Energy 'Deflation' Ends ZH: Poor 30Y Auction Tails, Dealers Awarded Most In 6 Months ZH: Tamed-PCE, Talks Of Peace, & Tariff-Pausing Prompt Bid For Stocks, Bonds, & Gold
… Far more below from Global WALL with cursory PPI recaps and yes, victory laps … but first, a quick look at data and rate sensitive 2yr yields …
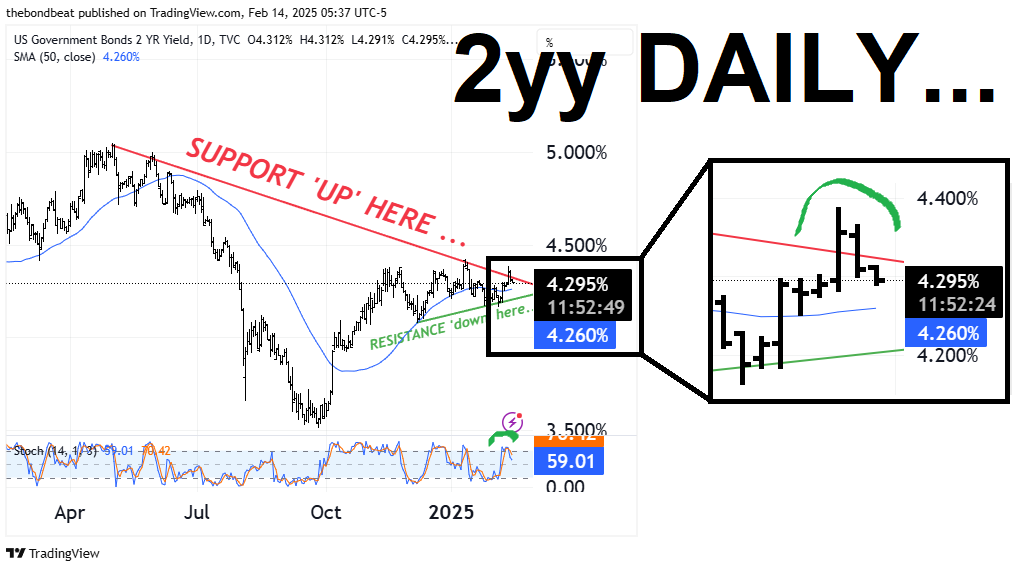
2yy DAILY: bigger picture triangulation remains in view and of interest with 2s back down beneath upper TLINE ‘support’ with 50dMA (~4.25% ) and then TLINE ‘resistance’ (4.20%) both firmly back on the table …
… so as we can see, price / yield reversal almost entirely taking out ‘CPI’-ma-GEDDON earlier in the week and momentum (stochastics, bottom panel) have now fully endorsed this message and crossed BULLISHLY (MS below, too) … s/t rentals from here target ~4.25%, 50MA and then 4.20% TLINE resistance) …
… Daily good for the shorter-term and will have a look at some WEEKLY visuals over the weekend but for now … here is a snapshot OF USTs as of 705a:
… HEREis what this shop says be behind the price action overnight…
… WHILE YOU SLEPT Treasuries are twist steepening after a range-bound overnight session. EGB underperformance remains a theme with Gilts +3bps wider to USTs. Our desk has seen demand in the front-end, primarily 3 - 5s, from real$. Limited flows out the curve have been more subdued with some light fast$ selling as we approach NY. S7P futures are showing -9pts here at 7am, Crude Oil +0.5%, and Eurostoxx a smidge higher +0.2%. UST 2s10s are 2bps steeper, led by a steeper real yield curve.
… for somewhat MORE of the news you might be able to use … a few more curated links for your dining and dancing pleasure …
NEWSQUAWK: US Market Open: Indices mixed amid varied Russia/Ukraine commentary, USD lower ahead of Retail Sales … Bonds retain a bearish bias but are off lows as geopolitics drives recent price action … USTs, and the complex generally, have been pulling back from yesterday’s 109-01 peak but haven’t fallen significantly thus far with the current low just a handful of ticks below at 108-26. Import/Export prices, Retail Sales and Fed's Logan are on the docket for today; alongside some other Tier 2 US data. Continued bearish action brings into play support a 108-10 and then 108-04 before the figure.
Finviz (for everything else I might have overlooked …)
Moving from some of the news to some of THE VIEWS you might be able to use… here’s some of what Global Wall St is sayin’ …
A UK shop weighs in with some CPI + PPI math …
BARCAP: US Economics (PCE inflation preview): January core PCE estimated at 0.33% m/m
Our translation of this week's January CPI and PPI estimates points to a 0.33% m/m (2.6% y/y) rise in core PCE prices and a 0.37% m/m increase (2.5% y/y) for the headline index. We raise our Q4/Q4 forecast for 2025 core PCE by 0.1pp to 2.8%.
…We revise our 2025 Q4/Q4 core PCE forecast higher by 0.1pp, to 2.8% after penciling in our updated January estimate. This is 0.3pp higher than the FOMC's median projection in the December Summary of Economic Projections (SEP). We think the acceleration in January is likely exaggerated by price-reset issues at the beginning of the year, and we expect to see some relief in the February data. That said, our baseline assumes tariff-related price pressures will likely boost inflation in H2 2025…
PPI came in at +0.4% MoM in January vs. +0.5% MoM Dec and +0.3% MoM consensus. Core-PPI was +0.3% MoM as-expected vs. an upwardly revised +0.4% Dec (was flat). Headline PPI on a yearly basis came in at 3.5% vs. 3.5% Dec and 3.3% forecasted. Core-PPI YoY was 3.6% vs. 3.7% prior and 3.3% anticipated. Within the details, we see Portfolio Management at +0.4%, Domestic Airfares -0.3%, Physicians -0.5%. All of this suggests that core-PCE in January will be 0.3% (or even a 'high' 0.2%) versus what had been fears of a high 0.3% -- which accounts for the modest bid in the Treasury market…
France calling with a very crude note …
BNP: Crude stuck between sanctions, tariffs and OPEC+
KEY MESSAGES
Crude markets appear to have finally acknowledged bullish market risks from sanctions, OPEC+ restraint and downward adjustments to non-OPEC growth forecasts. We retain our forecasts for a 300kbd build in 2025 and 400kbd in 2026 – these are fragile balances, but in our view don’t justify a price collapse.
Crude rangebound. We retain Brent in the USD70-80/bbl range despite significantly increased uncertainty. The floor is supported by supply disruptions and inventory demand; the ceiling capped by OPEC spare capacity.
OPEC+ restraint remains. This range in our view precludes significant pre-emptive OPEC+ net supply increases beyond the inherent non-compliance.
Strength in Q2/Q3 2025. We see some strength in Q2/3 on sanctioned volumes with continued OPEC restraint.
Tariffs bearish towards 2026. Tariffs reduce demand and lengthen balances at end-2025 and into 2026.
Dubai remains strong. Brent-Dubai stays weak on continued Dubai strength; Brent-WTI strengthens but remains relatively narrow.
… AND here I am stuck in the middle with you? Same shop taking a look at a monthly chart package …
…USD rates: Two-sided risks to monetary policy emerge Fed to pause its rate-cutting cycle through 2025: We expect the Fed to keep rates on hold through this year albeit with two-sided risks to both cuts and hikes.
First and foremost, the US labor market is showing extraordinary strength. The payrolls 3mma is back at 237k, well above our projected breakeven rate of 100-150k, with the unemployment rate falling to 4%. Absent technical revisions, job gains would have been even larger.
Second, upside risks to inflation remain. We expect tariffs to be much more inflationary than markets anticipate as Trump looks for new targets. Our economists' model tells us y/y CPI rises 0.3% for every 1% increase in import prices, where headline CPI could breach 4% next year (baseline for ~3%). Labor supply has already slowed ahead of hawkish Trump administration immigration policy. The path for labor demand looks unsustainable without accelerating wages, which explains the rise in average hourly earnings. The University of Michigan sentiment survey also showed 1y inflation expectations jumping to 4.3% (highest since November 2023) and LT inflation expectations up to 3.3% (highest since June 2008).
Overall, monetary policy no longer looks to be restrictive. We expect the Fed will shift to noting two-sided risks to policy but will be reluctant to move to hikes, given remaining uncertainty and the potential market ramifications.
Biased to a flatter curve as markets price stagflation risks: We think the market is starting to price stagflation risks and flattening of the US yield curve should persist. The curve has flattened as recent data and tariff headlines suggest a hawkish Fed on hold for longer. Meanwhile, trade tensions and a hawkish Fed are seen as negatively affecting growth prospects in the medium and long term.
If tariffs remain the main topic of conversation, stagflation risks can continue to be priced in with a flatter curve and lower long-end real yields. But if tariff risks recede, we also maintain a curve flattening bias as markets would price a more dovish Fed while term premium and Fed pricing have been largely correlated since September. Moreover, tariffs as a revenue-raising tool could also decrease concerns about fiscal deficits, which is another catalyst for recent flattening.
Treasury looks to be targeting lower term premia and long-end yields by delaying coupon auction size increases for the "foreseeable future." After the latest refunding announcement, long-end swap spreads richened and the yield curve flattened as investors saw coupon size increases pushed out to next year. We now expect these to start in February 2026 (previously August 2025).
With both CPI and now PPI in rear view mirror …
DB: Jan. inflation recap: Rotten egg for rate cuts
Both headline (+0.47% vs. 0.36% in December) and core (vs +0.45% vs. +0.21%) CPI came in well above our expectations. The year-over-year rate for headline ticked up a tenth to 3.0% while core drifted up by two basis points, rounding up to 3.3%. Shorter-term trends in core deteriorated. Updated seasonal factors made little change to the recent short-run trends, though did contribute some to January’s strong print particularly with respect to energy.
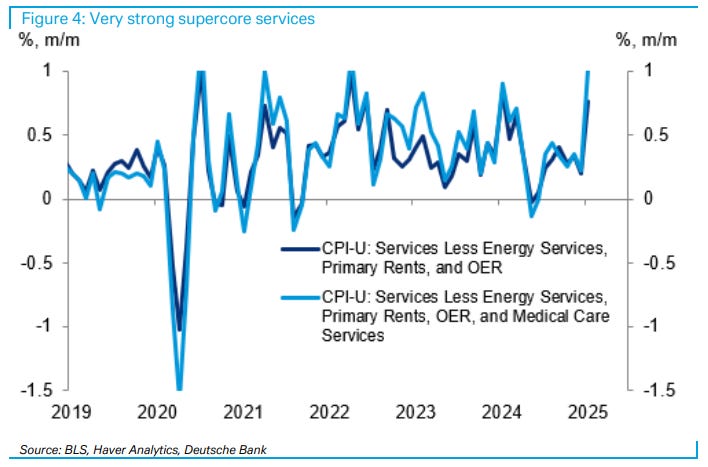
In terms of the breakdown, gains in core goods prices were robust largely off continued outsized strength in used cars and trucks, as well as a surge in medical care commodities prices. Core services also saw broad-based strength, particularly outside of rent and healthcare services. Supercore services posted the fourth-largest price gain since July 2020 on strong lodging away, recreation, airline fares, and motor vehicle insurance.
The annual update to the unit-level weights did not cause a repeat of 2024 when owners’ equivalent rent (OER) printed 20bps above primary rents. Indeed, the reverse occurred this year with gains in primary rents slightly above those for OER. Leading indicators continue to point towards rental disinflation.
Within the PPI, the specific details that feed into core PCE were quite soft. We are tracking core PCE to increase by 0.27% to 0.29% in January. This would be consistent with 2.6% year-over-year, though there were some revisions evident in the PPI data which could impart some upside risk to that.
Our initial read on the February CPI data is for a more moderate 0.26% gain in core. While there could be continued strength in goods prices, service prices should moderate some as they did after last January’s surge. In terms of our longer-term forecasts, they are mostly unchanged. We have increased our 2025 forecasts by a tenth to 2.9% for core CPI and 2.6% for core PCE, mostly as a function of the outperformance in the January data. 2026 and 2027 forecasts are unchanged for both at 3.1% / 2.6% for core CPI and 2.7% / 2.1% for core PCE.
With respect to the near-term outlook, the biggest risk remains tariff policy, which represents additional upside risks to the inflation outlook for the Fed. While our baseline is that they would prefer to “look through” the price level impact by keeping rates steady, their ability to do so could be constrained if inflation expectations begin to rise and / or the labor market reemerges as an additional source of inflationary pressure. While the bar for the Fed to hike is high, recent data suggest this outcome cannot be fully discounted (see “Could the Fed's patience wear thin?”).
It was a love-in for markets yesterday with bonds and equities rallying following better-than-expected inflation data and news that details on reciprocal tariffs would not come before April. This led to a revival of hopes that the Fed would still cut rates this year, particularly after the more hawkish fears post the upside surprise in the CPI report the previous day. That meant the 10yr Treasury yield fell -9.5bps to 4.53%, whilst the US 2yr inflation swap (-2.1bps) also fell back a bit, coming off its highest level in almost two years. And with investors becoming more relaxed on inflation again, the S&P 500 was up +1.04%, closing less than 0.1% beneath its all-time high last month.
The stock rally gathered more steam after Trump’s press conference unveiling reciprocal tariff plans which was light on immediate specifics. Specifically, the President ordered “to investigate the harm to the United States from any non-reciprocal trade arrangements adopted by any trading partners” and propose remedies. In determining of reciprocal tariffs against individual trading partners, Trump’s memo also mentioned countries’ use of non-trade barriers and VAT taxes. Such a country-by-country process should inevitably take some time and Commerce Secretary nominee Lutnick said that investigations would complete by April 1 and remedies could be implemented immediately after. In the meantime, questions whether this tariff threat will be used as a negotiating tool are likely to linger. Separately, Trump said that tariffs on cars above the reciprocal tariffs would also be coming soon. Still, the combination of limited tariff news and lower yields led to the broad dollar index (-0.83%) falling to its lowest since mid-December.
So this did little to derail the bond rally that had emerged earlier after the release of the US PPI inflation data for January. On the face of it, the headlines weren’t overly positive, as PPI came in at +0.4% for the month (vs. +0.3% expected). However, the components of the PPI such as healthcare and air fares that feed into PCE (which is the Fed’s preferred measure of inflation) came in softly. So that led US Treasuries to rally across the curve, because the view was that this unwound some of the upside surprise we got from the CPI the previous day. As a result, futures raised the likelihood of a rate cut by the Fed’s June meeting to 45%, up from 37% the previous day, even if that's still lower than the 58% probability before CPI.
All-in-all, this backdrop proved to be pretty favourable for US equities, with the S&P 500 (+1.04%) closing just -0.06% beneath its record high from January 23. The advance was led by the Magnificent 7, which surged +1.85%. But the rally broadened amid the limited news on tariffs, with all 11 major S&P 500 sector groups higher on the day and the small cap Russell 2000 up +1.17%. The gains were also helped by the supportive macro backdrop, as the initial weekly jobless claims fell to 213k in the week ending February 8 (vs. 216k expected), which pushed the 4-week moving average down to 216k. Moreover, the continuing claims for the week ending February 1 fell back to 1.850m (vs. 1.882m expected)…
Broad-based USD weakness; beat in UK 4Q24 GDP supports GBP; PPI data signals benign PCE translation; USTs bull-steepen in a "relief rally" despite weak 30y auction; CHF gains after beat in Swiss core CPI; BSP on hold but signals RRR cut; DXY at 107.05 (-0.8%); US 10y at 4.529% (-9.2bp)
… US PPI data come in higher than consensus expectations and with upward revisions, but signal a benign translation to PCE with softer-than-expected healthcare, financial services, and airfare prices.
USTs bull-flatten as PPI data suggest that the post-CPI UST sell-off may have been overblown; long-end rally continues even after the 30y UST auction results in 1.2bp tail…
… Same firm with a few words on consumers …
MS: US Consumer Chartbook 1Q 2025: What You Need to Know Now
A one-stop shop for monitoring the US consumer, with analysis on Labor Market & Income, Consumption & Sentiment, and Credit & Balance Sheet. This quarter, we spotlight the drivers of the recent surge in durable goods spending and the path forward from here…
… finally, a look at the USA from an economic perspective … a MACRO note with a micro view ..
CPI ran hot in January, raising fears of Fed hikes. However, the translation of CPI and producer prices into PCE inflation is favorable: the y/y rate of core PCE inflation should fall later this month. We think the bar for rate hikes remains high.
Key takeaways
CPI inflation surprised to the upside. Wildfires, newly introduced congestion prices, and the January effect made for a hot report.
However, our outlook for PCE inflation is very favorable. The y/y rate of core PCE inflation should fall to 2.5% from 2.6% in December.
Disinflation, a restrictive policy stance, the 2018 tariff episode, and the Fed's simulations of tariffs all keep us thinking cuts are more likely than hikes.
… don’t tell ME what I need to know and when … ok, fine. Whatever … The Swiss are recapping of PPI, askin’ questions, providing updated narratives …
With both PPI and CPI data in hand we now project that headline PCE prices rose 0.33% in January and core PCE prices rose 0.29%. The official release of these data is on Friday, February 28, two weeks from tomorrow.
Over the past 36 months the root mean square error for our front-month PCE prices translation has been 3.7 bps for core PCE prices (3.2 bps for headline PCE prices) once we have all the CPI/PPI/import prices data in hand with a median absolute error of 2.2 bps (1.4 bps for headline PCE prices).
As we had been expecting, it looks like December was the peak for 12-month PCE inflation rates and inflation should start to come back down in the January data. Based on today's translation 12-month core PCE inflation should slip from 2.79% in the most recent release to about 2.57% through January. This January translation would match the post-pandemic low of 2.6% that was seen this past summer following the core PCE inflation peak of 5.6% in 2022. We expect some additional easing in core PCE inflation in the next couple of months…
Yesterday was US President Trump’s very big announcement on reciprocal tariffs, which turned out to be a plan to investigate taxing US consumers at a future date. Markets had to decide whether the president was being a protectionist or a pushover, and for now are erring toward pushover. The delay is seen as an opportunity to do “deals”. So far, such deals have been more spin than substance.
Alongside the big announcement, there were repeated threats to tax imports of specific products (pharmaceuticals, cars, etc.). These threats are presumably for universal tariffs on individual sectors, and are more plausible.
US January retail sales data offers a somewhat complicated snapshot of US consumer health before the increased tax burden. Consumers have good reason to spend—real incomes have been rising for some time, and relatively good balance sheets mean additional income is directed to spending rather than saving. Retail sales data does underrepresent the shift to spending on having fun, however. Survey data has hinted at Democrats buying durable goods in anticipation of trade taxes being imposed (though no change in Republican behavior) …
Finally, Dr. BOND Vigilante on heels of CPI, PPI and tariffs …
YARDENI: Bond Yields Do A Backflip On CPI & PPI, Stocks Rally On Tariff News
The 10-year Treasury bond yield jumped by 10bps on Wednesday's hotter-than-expected January CPI report (chart). In his congressional testimony on Wednesday, Fed Chair Jerome Powell acknowledged that the Fed has more work to do to get inflation down. Today, the bond yield fell 10bps on a hotter-than expected January PPI report and an upward revision in December's PPI. Huh?
You read that right. Some of the key components of the PPI that are used to calculate the Fed's preferred PCED measure of inflation were benign or lower. For example, healthcare, with a nearly 20% weighting in the core PCED, declined 0.1%. Airline passenger services fell 1.6% m/m (after soaring 6.5% m/m in December).
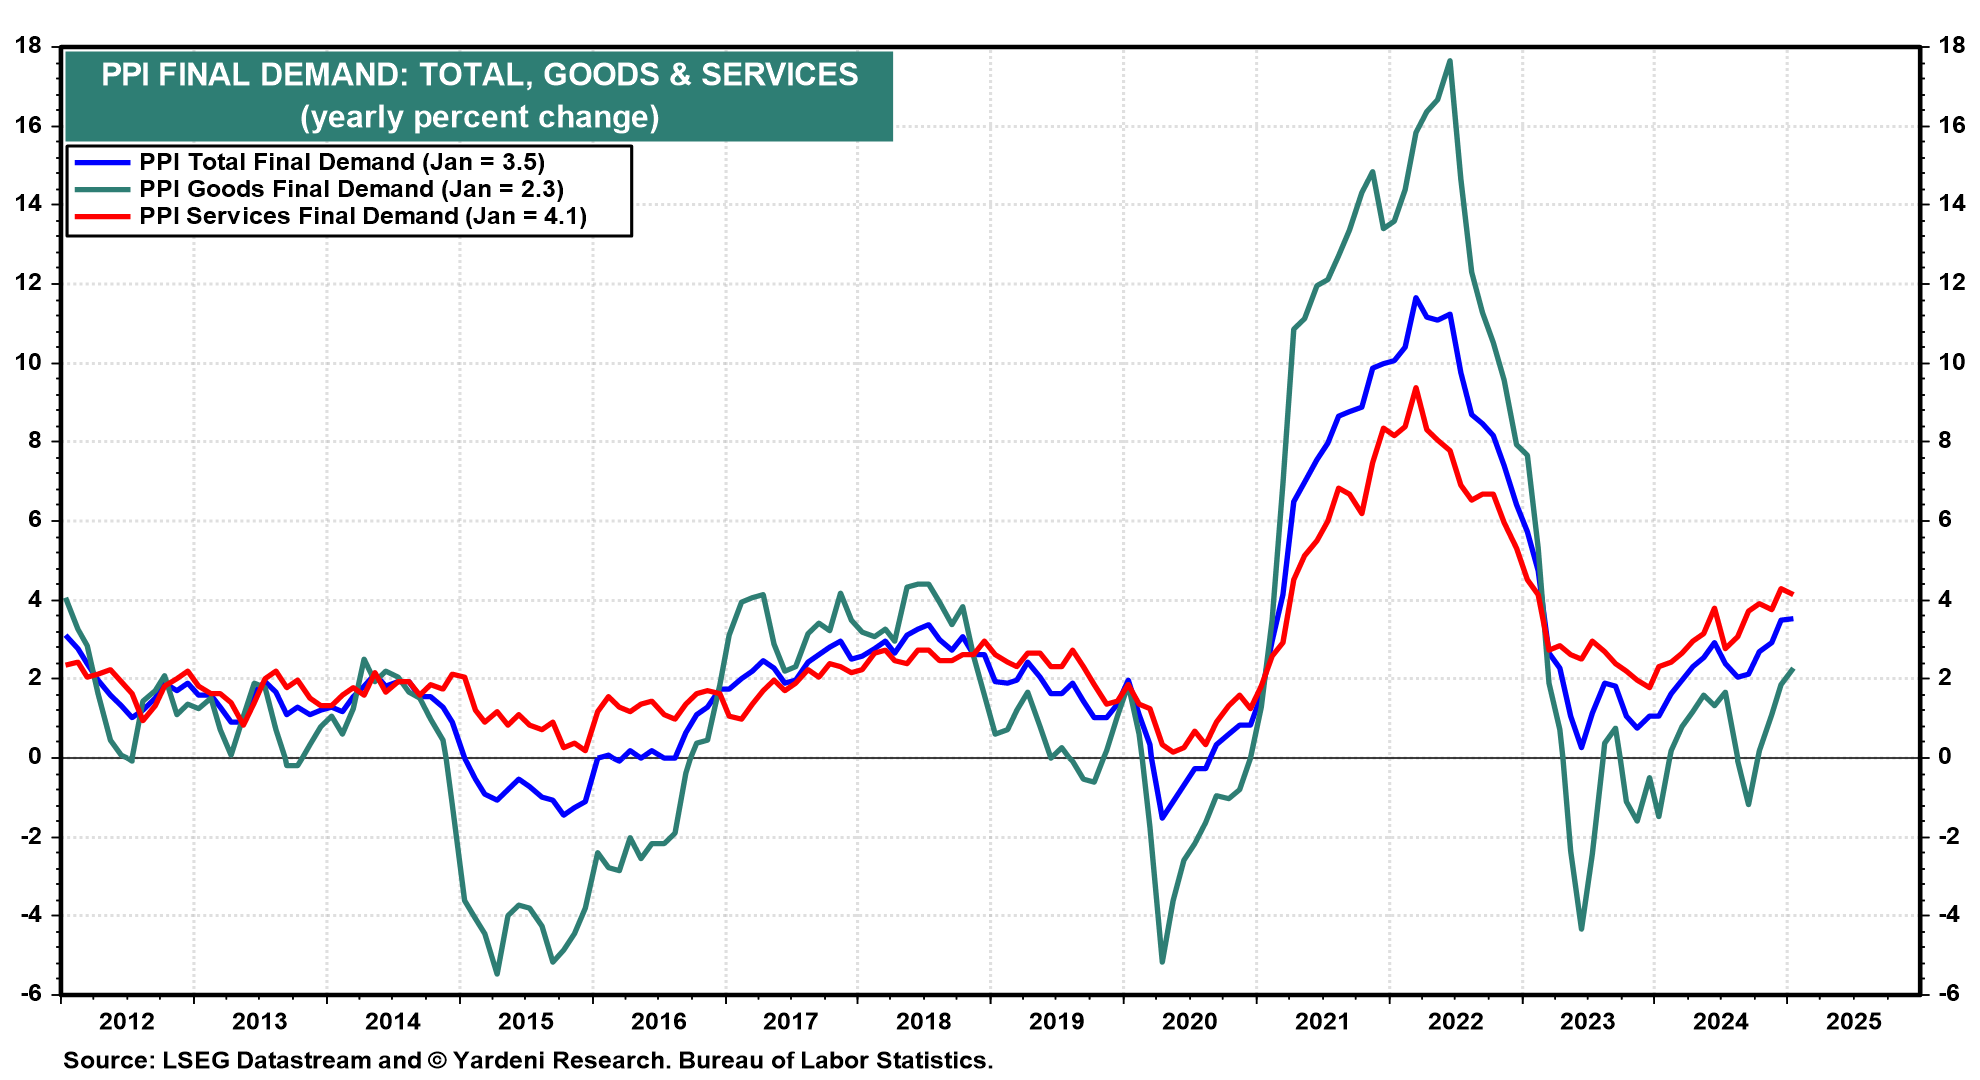
January's PPI rose 0.4% m/m, and December's increase was revised up from 0.2% to 0.5% m/m. The index is up 3.5% y/y (chart). PPI services inflation is above 4.0% y/y, and PPI goods inflation rose to its highest pace since 2022. The PPI inflation rate has been rising since June 2023, when it was close to zero.
… And from the Global Wall Street inbox TO the intertubes, a few curated links …
First up an ‘official’ account asking the question many out there are …
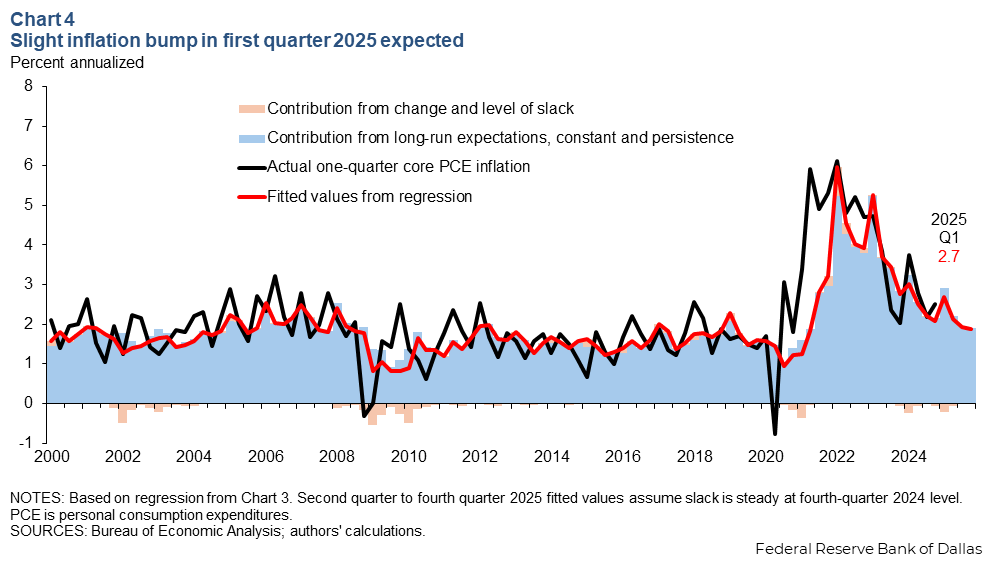
FRB Dallas: Is inflation still slowing? Early 2025 data pivotal to outlook
January inflation data were stronger in 2023 and 2024 than forecasters expected, even after more encouraging results had been reported for the ends of 2022 and 2023. Rather than reflecting seasonal adjustment difficulties, this pattern may be caused by a large share of firms changing prices at the start of a new year.
If this is the case, first-quarter inflation data may exhibit greater persistence and sensitivity to swings in the business cycle. Whether early 2025 monthly inflation rates are similar to late 2024 or a repeat of the previous years’ surprises will be key to assessing the underlying momentum of inflation ahead…
…Near-term outlook for a small bump, but caution is reasonable
The regression below predicts mildly elevated core PCE inflation in the first quarter of 2025, at around 2.7 percent annualized, as greater persistence in first-quarter inflation is somewhat offset by easing labor market tightness over the past year (Chart 4). If the labor market remains stable at current conditions and long-run inflation expectations remain anchored, this regression would predict more muted inflation readings in the rest of the year and near 2 percent for 2025 as a whole.
However, caution may still be warranted until early 2025 inflation readings are released. The regression underpredicted the first quarter of 2024, and there is uncertainty regarding how much the labor market has actually cooled. The greater sensitivity of first-quarter core PCE inflation to persistence and the state of the business cycle should render those months of data more informative about the underlying momentum of inflation.
If it turns out inflation is more persistent than previously thought or overall demand is too elevated for inflation to converge to 2 percent, the results suggest that such concerns would more likely manifest early in the year. Further, the slower monthly pace in the second half of the year is not necessarily as encouraging as similar readings would be early in the year.
If instead early 2025 inflation data are subdued, similar to late 2024, 12-month inflation rates would make considerable progress toward the 2 percent goal in only a few months and signal economic conditions likely consistent with price stability.
… watching this space. And while looking forward to future data, we must also try to learn from our past …
Inflation is moving higher, inflation expectations are moving higher, and breakevens are moving higher, see charts below. If the Fed cuts interest rates too early, it increases the likelihood that we will see a repeat of the 1970s. The Fed has no other options than to keep interest rates higher for longer.
Apollo ALSO this morning weighing in on 60/40 …
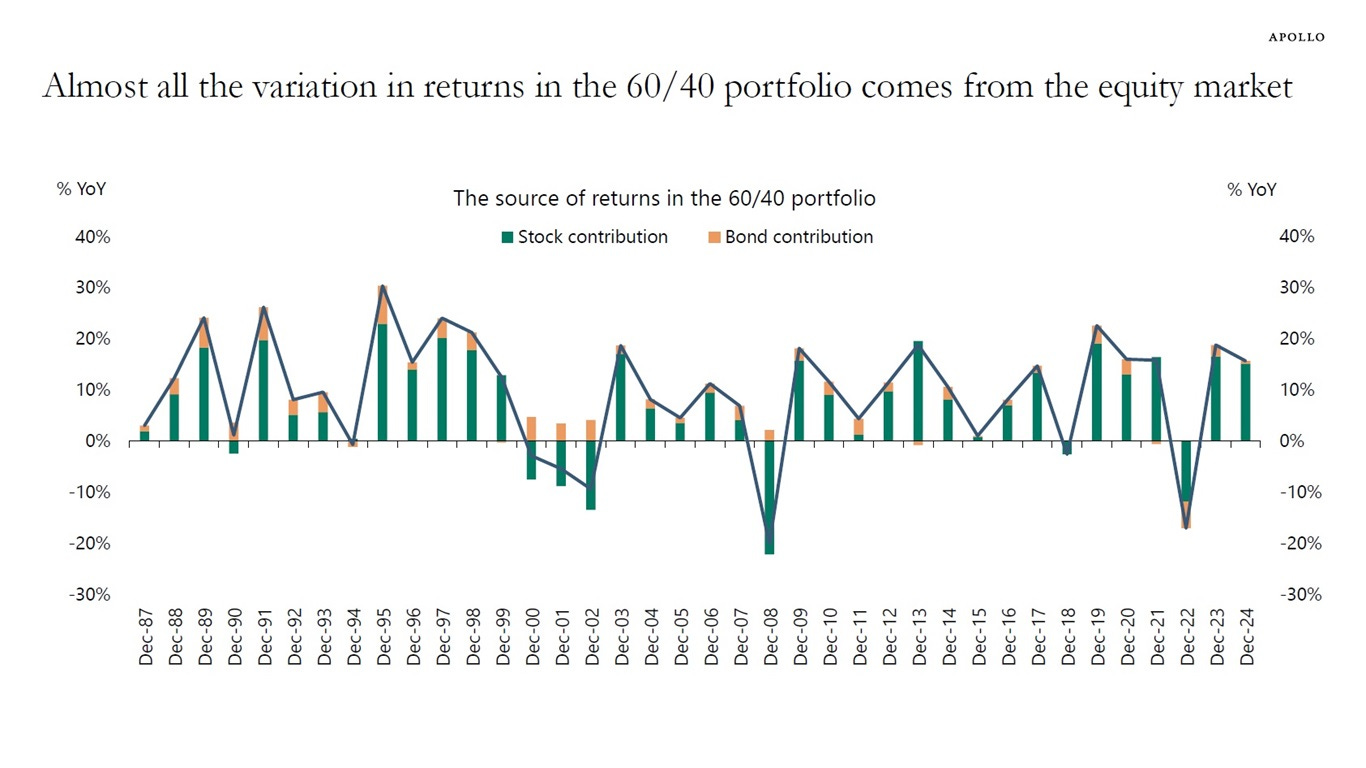
APOLLO: The Source of Returns in the 60/40 Portfolio
Almost all returns in the 60/40 portfolio come from the stock market, see chart below. When the stock market goes down, there are years when Treasuries are not the correct hedge against downside risks in the S&P 500, including in 2022.
Asset allocation has evolved significantly since the 60/40 portfolio was invented in the 1950s, and investors are now asking more nuanced questions about fixed income replacement and equity replacement, with a focus on less concentration in the S&P 500, lower volatility in returns, and less need for daily liquidity, see also here.
… Shocking nobody, news at 11! … these next ones could NOT fly by under the radar screen as they both have catchy titles …
BLOOMBERG: Tariff Man Strikes Again — And Markets Ignore Him They still see plenty of room for negotiations, but across-the-board levies would be a different story.
… Equity volatility dropped once the meeting started, while the major US indices started on a tear that carried on until the close. The dollar directly gains from tariffs as foreign exchange traders try to counteract the effect on its competitiveness. Yet it spiked only briefly as the meeting started —then tanked. The gold price suggested investors in that market were more concerned at day’s end. But other than that, this was an emphatic cross-asset judgment that the president had meant the opposite of what he’s said.
How to explain this? Bond yields fell early in the day in response to data that suggest the Fed’s preferred inflation metric will be lower than thought, which helped stocks — but it doesn’t explain the big changes in direction once the president had spoken. It’s possible to argue that behind the bluster, the detail was more conducive to compromise than had been feared. Mike Reynolds, investment strategist at Glenmede, said:
Part of the rally we’re seeing today is a relief from the fact that these reciprocal tariffs aren’t immediately imminent. The second part of it is we think that there’s been these discussions within the White House, whether it’s more appropriate to just do blanket universal tariffs where everybody gets 10%, or if this more nuanced approach of reciprocal tariff... We think this just gives other countries a little more opportunity to save face and avoid a tit-for-tat escalation.
It’s also possible to argue that the whole thing lacked credibility. This was the first response of Peter Tchir of Academy Securities:
I see a laundry list, a giant huge laundry list, of things we could potentially do.The first wave on Canada, Mexico and China were straightforward. Broad-based tariffs, with a set start date, tied to disappointing behavior around fentanyl. Today’s announcement is the opposite of that. Lots of things mentioned, but nothing really done, not even a specific deadline for imposing any of the possibilities. My take is the president was talked down from what he wanted to do, by some of his advisers.
Those stocks with most to lose from a trade war tended to gain most…
…At present, the market’s bet that Trump is the Wizard of Oz looks over-confident. He has a mandate to reverse globalization, he plainly believes in it, and he won’t win meaningful concessions unless he goes through with serious trade levies at least once.
BLOOMBERG: Eggs-istential inflation scrambles bond markets And then there’s Ukraine, where Trump is reaching out with big early concessions.
……Inflated Expectations Inflation isn’t over. We already knew that, and the US consumer price index numbers for January did little more than confirm a picture that’s been clear for many months. It was treated as a major shock on the markets, but probably shouldn’t have been.
The most significant impact came in inflation breakevens, the forecasts implied by the gap between fixed and inflation-linked bond yields. The two-year breakeven has broken above 3% (the upper range of the Fed’s target) to its highest in two years, while the 10-year is also at a two-year high after reaching 2.5%. The breakeven for the five years starting five years hence, which the Fed tracks closely, remains anchored, but it’s obvious that markets are growing more jumpy about inflation:
That has obvious implications for the Federal Reserve, who must wait for clear evidence that inflation is declining once more before cutting rates. That’s now unlikely until much later this year. It can also be interpreted as a warning sign on trade policy. Most investors work on the assumption that tariffs would mean higher inflation in the short term, which makes the risk of rising prices look greater. The administration should also take note as the bond market can intimidate even the likes of Elon Musk and Donald Trump…
…The biggest publicity has, of course, attended the price of eggs, which rose a non-seasonally adjusted 13.8%last month alone. This matters to many a household. It’s not clear that it’s relevant for other prices in the economy. Egg inflation has only once this century risen faster, in June 2015 during the outbreak of “Highly Pathogenic Avian Influenza,” or bird flu. If a disease is leading chickens to premature deaths, then of course the supply of eggs will be cut. Bird flu is back, creating much concern that it could leap to humans. (Dairy herds are also infected.) The price of eggs can be taken as a warning that this outbreak among birdsis serious. It’s not something the Fed or the Treasury can do anything about:
Further, although eggs are the ingredients for many dishes, they are yet to have knock-on effects on other foodstuffs. After their bigincrease, the next highest inflation was for frozen noncarbonated juices and drinks (5.3%), followed by instant and freeze-dried coffee (4.4% — and wholly predictable from supply problems in Brazil and Vietnam). Overall, food inflation remains stable, and lower than the rest of the index. For two years, food inflation was a major problem.
… Wolfie for some funTERtaining visuals …
WOLFST: PPI Inflation Accelerates to +3.5% yoy, Worst in 2 Years, Driven by Services amid Massive Up-Revision of Services Inflation
Inflation is festering and accelerating in services (two-thirds of overall PPI), not in goods.


Welcome back BondBeat