CNBC: Euro zone economy grows 0.4% in third quarter, above expectations
… see, I told ya so … next up then should oughtta be a Goldilocks-like NFP report where it’s NOT (BA and storm induced) negative but not strong enough to elicit more calls for rate HIKES (or a pause of cuts).
Meanwhile, in as far as conflicting data goes …
ZH: Shocking Drop In Job Openings After Massive Downward Revision; Quits Plunge To 8 Year Low
Bonddad: JOLTS report for September shows continued declaration in almost all metrics, now close to a cause for concern
… AND in light of all this, I’ll ask if YOU happened to be fortunate enough (?) to have gotten 7s …
ZH: Yields Tumbles After Stellar 7Y Auction Stops Through Most Since Covid Panic
… meanwhile, back at the ranch, somethin’s happenin’ here and what it is ain’t exactly clear (ok ok maybe it is …)
30yy DAILY: yields back below (redrawn) TLINE at / about 4.50% and heading back towards 200dMA (4.389%) …
… momentum had gotten overSOLD — Trump Trade? — and bets are being unwound, shorts covered and, low and behold, bonds are being bought for whatever reason <insert your fav narrative HERE> ahead of … month-end index extension tomorrow at 4pm …
… AND with NYY ‘stayin alive’ just like the bond market (?) — yes, ‘twas a late night am sorry — I’ll quit while i’m behind …
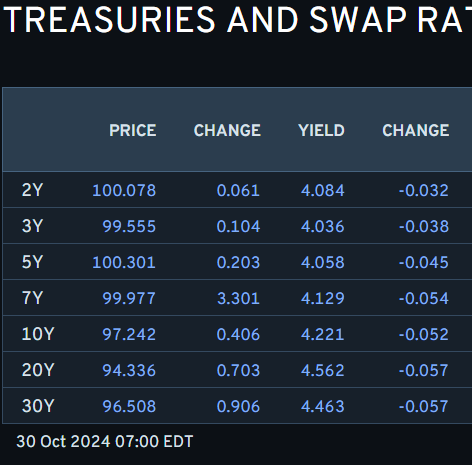
… here is a snapshot OF USTs as of 700a:
… and for some MORE of the news you might be able to use…
Finviz (for everything else I might have overlooked …)
Moving from some of the news to some of THE VIEWS you might be able to use… here’s SOME of what Global Wall St is sayin’ …
First up, in a global monthly publication, if it rhymes we read it …
ABNAmro: US - ‘Tis the season to be easin’ | Insights newsletter
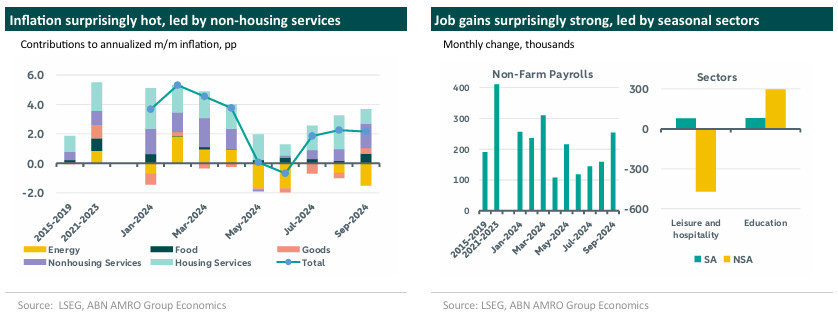
The start of the easing cycle was immediately followed by hot inflation and strong hiring data. September data is special due to strong seasonal effects. The month surprised similarly last year. Looking through the volatility, 25bps cuts in each consecutive meeting remains our baseline Fed view.
…The chart on the left above shows a decomposition of CPI inflation into its major categories. Fed Chair Powell has said that his confidence in inflation coming down hinges on a broad-based decline across all core categories: goods, housing- and non-housing services. He contrasted the Q2 inflation figures with the low inflation period in Q4 2023, which was mainly driven by goods deflation, while both categories of services inflation were still elevated. Non-housing services came back with a vengeance last month, with some notable, and seasonal outliers, such as college textbooks, admission for sporting events and airfares – components strongly associated with the return to work and school after the end of summer. The estimation of seasonal effects, which are strong in September, has become much harder since the pandemic. Last year, September also saw a similarly strong seasonally adjusted increase in non-housing services prices. Meanwhile, housing services inflation actually eased to pre-pandemic levels. Pressure is expected to remain subdued, as the shelter CPI has now effectively caught up to price changes in third-party data, such as the Zillow observed rent index.
We see a similar story for non-farm payrolls in the chart on the right. Between June and August, a combination of new releases and downward revisions of the previous months, showed a sudden decline in job creation. September then gained 254k jobs, the third highest reading of the year. The sector decomposition shows large contributions from two highly seasonal sectors: leisure and hospitality, and education. Leisure and hospitality hiring was not driven by an actual creation of jobs, but rather just a smaller decline than is usual in September. Hiring in education was stronger this year than in previous years. Here, too, last year’s September data release mirrors this year’s. In September 2023, non-farm payroll gains came in at 336k, versus 170k consensus. The figure was ultimately revised down to 246k a month later.
In short, while these headline figures in the first instance seem to reflect poorly on the choice to cut rates by 50bps, leading markets even to price a small chance of a pause in the easing cycle, a more careful assessment leads to a less hawkish interpretation of the data. It remains important to look through the short-term variability. The upcoming labor market report is likely to be a lot weaker, but should also be read in the context of the hurricanes that hit the economy in October. Inflation is likely to moderate and remain on course to reach 2%. At the same time, Q3 growth is likely to come in strong, with the Atlanta Fed tracker putting it at 3.4% annualised. The incoming data is therefore expected to remain consistent with a soft landing scenario, and we expect the Fed to gradually reduce the policy rate with 25bps in each upcoming meeting.
… on Jobs and trade, impacting GDP as well as possitioning …
BARCAP: JOLTS: September's surprise drop in openings looks exaggerated
Job openings registered a notable decline after having rebounded in August, even amid a pickup in hiring, continuing the string of volatile monthly JOLTS estimates. In light of contradictory signals from other indicators, we think the decline in openings is exaggerated, and we suspect the FOMC will as well.
BARCAP: Wider September trade deficit trims our Q3 GDP tracker to 2.8% q/q saar
Today's incoming data, which featured a wider-than-expected September trade deficit for goods and stronger-than-anticipated inventory gains, nudged down our GDP tracker to 2.8% q/q saar (-0.2pp) on the eve of the advanced estimate for Q3 GDP.
BARCAP: Positioning higher, but still room for re-grossing
Reflation trades in vogue on better US data and anticipation of a Trump win, but no love for Europe. Broad equity exposure above average now means positioning risk more two-sided, and vulnerable to rate jitters. But investors in wait & see mode have room to re-gross, while rotation to Cyclicals remains a pain trade.
…Fundamentals backstop equities, but beware of bonds jitters Amid the broad reflation trade, bond performance has lagged equities considerably this month after doing much better through the summer. Indeed, with US data surprises looking stronger by the day and the chance of a red sweep rising, rates have spiked recently. This uncertainty has led to a move higher in bond vol even as equity vol stays largely under control.
We note that investors are already trimming their duration exposure with CTAs cutting longs from elevated levels. However, bonds remain well owned for now as demand for bonds has been higher than equities over the past year with inflows into fixed income being relatively higher than equities.
While yields have gone higher with better data in the US, rates markets may also have to digest the possibility of higher fiscal spending and potentially higher inflation, especially in a red sweep scenario. Thus far, rising real yields have not hit equity valuations like they normally would as equity investors see the growth benefits from potential tax cuts under a red wave as positive for equities. But if bond investors get increasingly concerned about fiscal discipline and Fed independence, we doubt equity investors will be able to ignore it for too long.
… looking beyond next weeks election, an equity writeup with some ideas …
BNP: US equities: Calm after the storm – post-election trade ideas
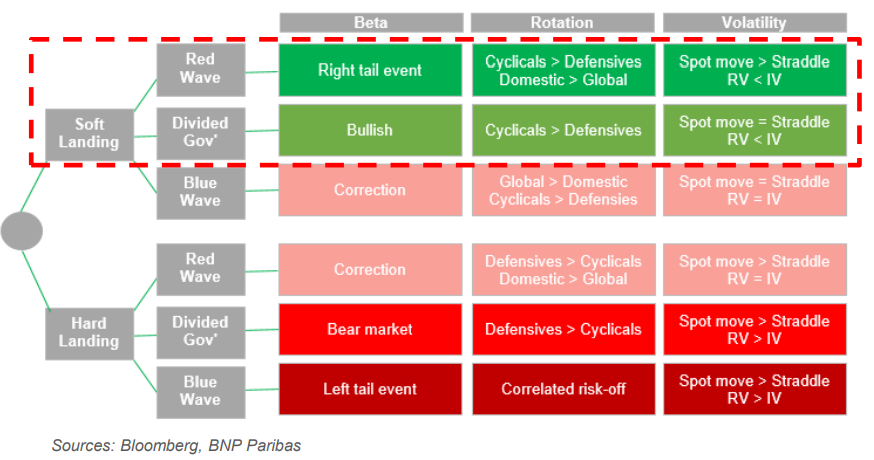
After next week’s US election, we expect to see investors add risk in US equities. We see scope for a continuation of the YTD equity rally, but with broadening participation. If the Manufacturing ISM reaccelerates, we could see cyclicals rally and SPW outperform SPX. We expect a volatility compression regardless of the election outcome. Former President Trump’s first year in office in 2017 saw the lowest US equity realized vol in the past 50 years. Post the 2024 Election Day event risk, a Harris win with a divided government also could be benign for equity volatility. A Trump victory could see policy stimulus from Beijing and more volatility from Chinese stocks.
Fig. 1: In our view, it looks increasingly likely that the market follows one of the more bullish potential paths from our Q4 outlook piece (BTD in optionality). This would suggest a cyclically led rally and downside risk to equity volatility
… a couple notes for those rule followers out there AND funny thing happened on way to bond mkt rout …
Just when the US Treasury sell-off was starting to gather fresh momentum yesterday, with 10yr yields close to 4.34% as Europe went home, along came a better auction which seemed to help turn things around in a volatile session, leaving it -2.8bp lower on the day at 4.255% with 2yr yields rallying c.8bps off the session highs to close -4.3bps lower. Still, in a sign of the heightened volatility going into the US election, the MOVE index ended the day at its highest level since October 2023.
The 7yr auction saw the highest bid-to-cover ratio since 2020, with bonds issued -2.0bps below the when-issued yield. So an encouraging sign on the demand for Treasuries after lacklustre 2yr and 5yr auctions the previous day. The move lower in yields saw one failed attempt after a weaker JOLTS report which contradicted last month's bumper payroll release.
Job openings fell to their lowest level since January 2021, at 7.443m (vs. 8m expected). And the report also showed the quits rate of those voluntarily leaving their roles decline from 2.0% to 1.9%, which is the lowest since mid-2015 if you exclude the Covid months of March-June 2020. Although the JOLTS data is always a month behind other data, it is a very good guide to the labour markets so there should be some concern here. We'll see if we can derive much signal from payrolls on Friday given all the recent storms and strikes.
On the plus side though, the Conference Board’s consumer confidence indicator surged to its highest level since January, at 108.7 (vs. 99.5 expected). Moreover, the difference between those saying jobs were “plentiful” and “hard to get” finally rose after 8 consecutive monthly declines, ticking up to a net +18.3%. So those on the extreme sides of the US employment debate at the moment could find something to cling to in the data…
…Even with the big moves of late, especially in yields, one view that hasn't been much in doubt over the last couple of weeks has been the prospects that the Fed will cut rates 25bps next week. The likelihood has predominantly been in the 90-100% range since mid-October. On this Matt Luzzetti put out a note yesterday hereexplaining why policy rules would support the Fed cutting next week. They also discuss how the case for pausing or skipping will build in 2025, for various reasons which could include the election results. Staying with Matt's US team, they've just published a good use case for AI by plugging in all Powell's prepared FOMC press conference speeches into our chatDBT model and asking it to score each on a 1-10 hawkometer. They then correlated this to 2yr yields, amongst other variables, and get a good match. They are going to build on this work but if you want to see it please see here for more.
DB: Policy rules suggest it's a bit premature to plan a pause
The recent spate of stronger economic data has led to an abrupt pivot in the narrative around the Fed. After the 50bp cut in September, the market swung to debating when the Fed will skip a meeting. We weigh in on this debate.
Based on policy rules, theFed can comfortably cut rates at next week's meeting. A 25bp reduction in December should also be relatively comfortable, though it would bring the fed funds rate into the upper end of the range of rule prescriptions assuming higher estimates of r-star.
There will be some element of data dependence to policy decisions beyond next week. The Fed will likely need two elements in place to skip – inflation to prove stickier and downside risks to the labor market to ease. We detail the conditions we have in mind.
As we enter 2025, the case for skipping or pausing is likely to build. The Fed will be closer to estimates of neutral, a repeat of residual seasonality could lift inflation early next year, and the election outcome could add to hawkish risks for the Fed (see “Looking beyond the next 25bps to ’25: The Fed outlook post election”). We therefore see risks tilted towards an earlier skip/pause than in our baseline (Q2 2025).
In a note with Matt Luzzetti published earlier today, we considered conditions that could prompt a skip or pause in Fed rate cuts. We highlighted that based on policy rules the Fed can comfortably cut 25bp next week. A 25bp cut in December should also be safe, though it would bring the fed funds rate (FFR) into the top end of the range of rule prescriptions based on our suite of r-star estimates. We also detailed conditions the Fed will likely need in place to skip, namely stickier inflation and an easing in downside labor market risks.
As part of the analysis, we looked at the FFR prescriptions implied by policy rules using a nominal neutral rate in-line with the median SEP projection of 2.9%.
Today's chart gives additional perspective from the SEP, looking at the span of rates implied by the central tendencies of projections for the longer-run unemployment and fed funds rates. The central tendencies drop the three highest and lowest projections for each variable, giving a sense of the broad center of the Committee.
As of the September SEP, the central tendency for the longer-run unemployment rate was 3.9-4.3% and for the longer-run FFR was 2.5-3.5%. Based on a current unemployment rate of 4.2% – our economists’ forecast for this Friday’s print – and core PCE inflation of 2.5%, the grey shaded area in the chart shows the central tendencies of the fed funds rate prescriptions under the various rules.
The current midpoint of the target range – the blue dashed line – is 40-60bp above the top end – i.e., most hawkish – of the settings. That is, based on the broad center of FOMC projections, not just medians, current economic conditions are supportive of another 50bp of cuts. But beyond there we're in more ambiguous terrain.
The US re-funding announcement should see a repeat play of the current quarter. No increase, but also no let up in the supply pressure. The US third quarter GDP number should also show a firm reading for that quarter. That maintains the upward pressure for yields ahead of the US elections. In the UK, it's budget day; with higher Gilt issuance to boot …
ING: Worker caution on US jobs market suggests momentum is shifting
Consumer confidence rebounded in October, but job vacancies surprisingly fell at a time when worker sentiment surrounding the jobs market is already weakening. If workers are increasingly concerned about job security this may run the risk that they start changing their spending behaviour, justifying ongoing gradual interest rate cuts from the Fed
… jobs, jobs and more on (not moron) jobs and on confidence …
Wells Fargo: JOLTS: Some Cold Water on the Last Jobs Report
Summary The September employment report a few weeks back shook up the recent narrative on the labor market, as it showed robust job growth, steady unemployment and smouldering wage growth. The latest release of September labor market data, however, suggests that employment conditions continue to soften. Job openings fell by 418K in September from a downwardly revised reading in August. While the number of job openings per unemployed, at 1.1, is consistent with the labor market remaining solid in an absolute sense, employers and employees are still in a wait-and-see mode. The share of workers quitting their job fell to a four-year low in September, and while despite ticking up last month, layoffs remain near historic lows.
Wells Fargo: Consumers Are Gaining Confidence, Yet Higher Prices Still an Anchor
Summary Despite the upside surprise in October consumer confidence, inflation is still a top concern weighing on percpetions. The looming presidential election ranks behind economic worries in consumers' minds.
We don't expect to be disappointed by October's payroll employment report on Friday. Both September's JOLTS report and October's consumer confidence survey suggest that the labor market remains in good shape. Better yet, it may be improving. The impact of bad weather and strike-related layoffs will make a dent in October's payroll employment number, but that doesn't mean the jobs market is weakening.
Financial markets seem to be sensing that. The S&P 500 turned positive this morning after both labor market reports were released. The latest data confirm fixed income investors' concerns that the Fed is stimulating an overheated economy that continues to be stimulated by large federal government budget deficits (chart).
Here's more on today's data:
(1) JOLTS. Payrolls rose 362,000 in September according to our JOLTS-based proxy, which subtracts separations from hires (chart). That more than confirms September's strong 254,000 jump in payroll employment.
… And from Global Wall Street inbox TO the WWW …
… Bond traders trade, hedge, news at eleven … seriously, though, when EBB of BBG talks one should slow down to read as his updates and insights on positions is beyond just ‘so good’ …
Bloomberg: Bond Traders Hedge Deeper Selloff, Targeting US 10-Year Yield at 4.5%
Open interest has climbed in put options at the 109.50 strike
JPMorgan client survey shows shift to more neutral positioning
… But options traders see the risk of an even steeper selloff. They’re targeting a 4.5% yield on the 10-year note, which would be the highest since May. The evidence of that can be seen in open interest — the amount of new positions held by traders. That measure has been growing in recent sessions in put contracts with a strike price that equates to a jump of about 0.20 percentage point above the current level of roughly 4.3% by the end of November.
Positioning in that 109.50 put strike is currently the most elevated in the 10-year December options, largely because of a position that traded a couple of weeks ago for a $16 million premium. There has been some fluctuation in the position, but open interest remains elevated at approximately 107,000 options, a sign that traders are holding onto hedges covering a bigger bond-market slump…
… more on the idea that IF it rhymes, we read …
Bloomberg: Trump trades — Bitcoin is boss, bonds at a loss Crypto is along for the ‘Trump-wins’ ride, but a counter-narrative is emerging from economic data and the Madison Square Garden rally.
… That leaves the last two elections and the current one. In all three Octobers, the majority felt negative, but only by a narrow margin. People are a little more confident now than when Hillary Clinton and Trump lost (and much happier than when they reelected Barack Obama in 2012):
The most natural explanation is that the economy is less important now to how people vote (and presumably cultural issues have gained in salience). Or, unless confidence is totally shot by financial crisis or recession, it never mattered as much as experts thought.
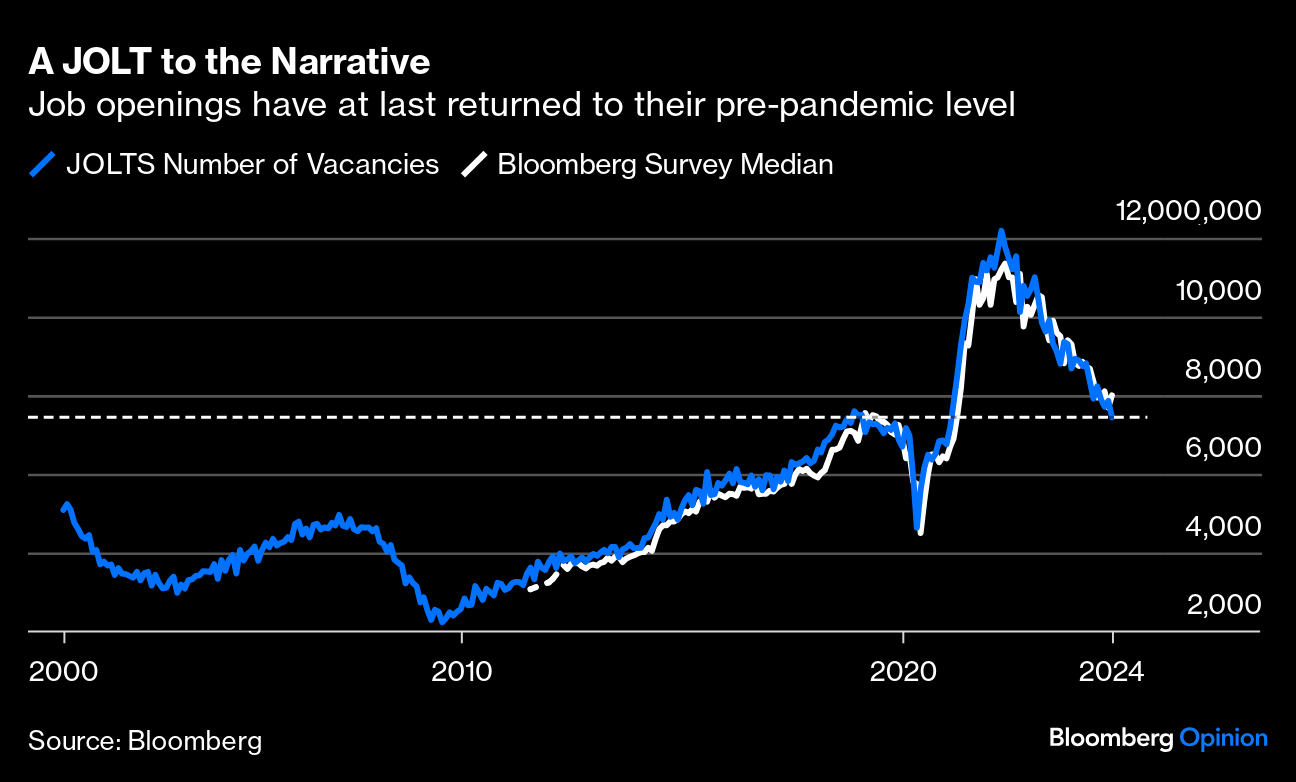
The Trump narrative involves selling bonds, on the assumption that a growth-oriented administration will allow inflation to rise and force the Federal Reserve to abandon planned rate cuts. On that front, the JOLTS (Job Openings and Labor Turnover Survey) for August was interesting. The number of vacancies has dropped much more than expected, back to its (historically high) level before the pandemic:
This is great news for the Fed, allowing it to go ahead with cutting rates, and should be a cue to buy bonds. On Tuesday, it was merely seen as a buying opportunity to put on another Trump trade. Yields had surged in early trading, and after a brief pause rallied again. However, plenty of institutions are happy to buy at these yields, and a well-received auction of seven-year Treasuries extinguished the day’sexcitement, sending the 10-year yield to 4.25% from 4.33%. The incident was a still a telling illustration of the power of the Trump narrative:
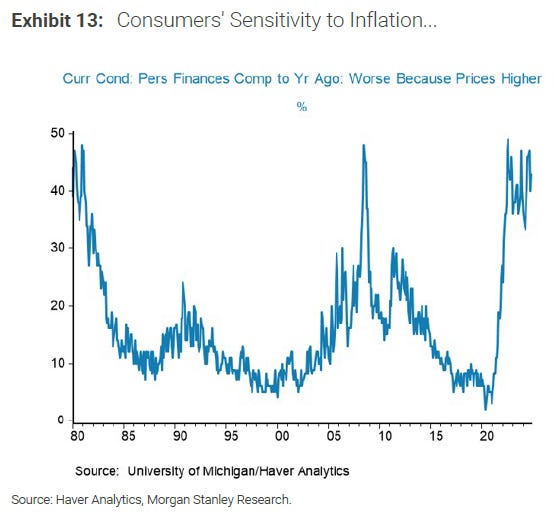
As there’s such confidence in a Trump victory, what evidence is there that inflation has been that painful? Morgan Stanley published this chart of the proportion of people who thought their personal finances worse than a year earlier who blamed inflation. It’s not an issue that’s gone away:
The inflation spike was driven by everyday commodities that take the biggest bite from budgets of the less well-off. The Atlanta Fed publishes a wage tracker based on census data that monitors pay rises. If we compare average wage growth for the low-skilled with overall food inflation, food far outstripped pay in 2021 and 2022. That has now reversed. This comparison also helps explain Hillary Clinton’s loss — because of acutely low wage growth, the pay of the low-skilled fell far behind grocery prices under Obama:
For another version of this calculation, here are the Atlanta Fed’s estimates of wage growth for the least-well-paid 25% of the population, and for part-time workers, against Bloomberg’s measure of anti-core inflation, calculated by Opinion’s data editor Carolyn Silverman and combining the official food and energy indexes. The Obama administration’s failure to come through for the lowest-paid is again apparent, while the spike of 2022 looks even more extreme:
This way of looking at it suggests that the problem is well and truly over. However, there’s a key difference from the last inflation spike in 2008, which was followed by very significant anti-core disinflation. That hasn’t happened this time, and that explains anger.
Overall, does this defend the narrative — proposed by Points of Return and many others — that the inflation shock’s effect on the lowest-paid meant that Harris was always dead in the water? That probably will be the tale if she loses, but the recovery of wage growth, and the way that anti-core inflation has exceeded wage growth many times in recent history, leaves it less than totally clear-cut.
There’s an emerging counter-narrative, and it concerns the narrative itself. It holds that the Madison Square Garden rally for Trump was the moment when his campaign grew too confident and overplayed its hand. Judging by the way Republicans have tried to talk down more embarrassing moments while Democrats have replayed them suggests this is the case.
What did the US Treasury Bond Market Signal AFTER our Treasury Bond Vol (MOVE Index) Signal broke out to the upside?
UST 2yr Yield was +15 basis points last week to +54 basis points in the last month = #Quad3
UST 10yr Yield was +16 basis points last week to +45 basis points in the last month = #Quad3
While the Longest-end of the Yield curve that I model (UST 30yr Yield) broke out to Bullish TREND (that’s bullish for Bond Yields and bearish for Bonds) in the 1st week of October and the UST 10yr Yield joined that move within a week…
Day 2 of the Short-End of The Curve signaling that the Fed is on the wrong side of the Bond Market’s INFLATION and Rate Cut expectations with my Fed Front-Runner (UST 2yr Yield) signaling that those Q1 2025 Rate Cut expectations are coming #out!
Treasury Bond Vol (MOVE Index) continues to blast higher with the MOVE up another +252bps yesterday alone to an eye watering +3762bps in a month!
US 10-year bond yields have backed up sharply since their September low of 3.63%, closing at 4.25% on Friday (fig 1). In part that’s been driven by (i) optimism about the cyclical outlook for the US economy (macro data has surprised to the upside, while recession concerns have faded); and (ii) some ‘pre-election positioning’, with both Trump and Harris expected to expand the fiscal deficit. Linked to that, there are growing concerns about the lack of fiscal discipline in Congress (particularly under a Trump presidency, in which Republicans control both chambers).
Of note, though, with that recent sell-off in fixed income, US Treasuries have become oversold. That’s the message of our medium term technical scoring system, which has generated timely signals in recent months (see fig 1a). In a similar vein, measured sentiment is now mid-range, having been close to bullish levels. Elsewhere, net speculative positioning in Treasury futures is SHORT (fig 1b), albeit this has been somewhat distorted by the ‘basis trade’ (analysed in detail HERE last month by the CFTC).
Overall, the ‘stronger growth’ and ‘fiscal expansion’ narrative has become a popular one in markets. As such, and with BUY signals from certain/key medium term models (fig 1a), that narrative is also largely in the price (at least for now, i.e. in the near term).
Fig 1: US 10-year bond yield shown with 50 & 200 day moving averages
… a credit spreads chart of the week …
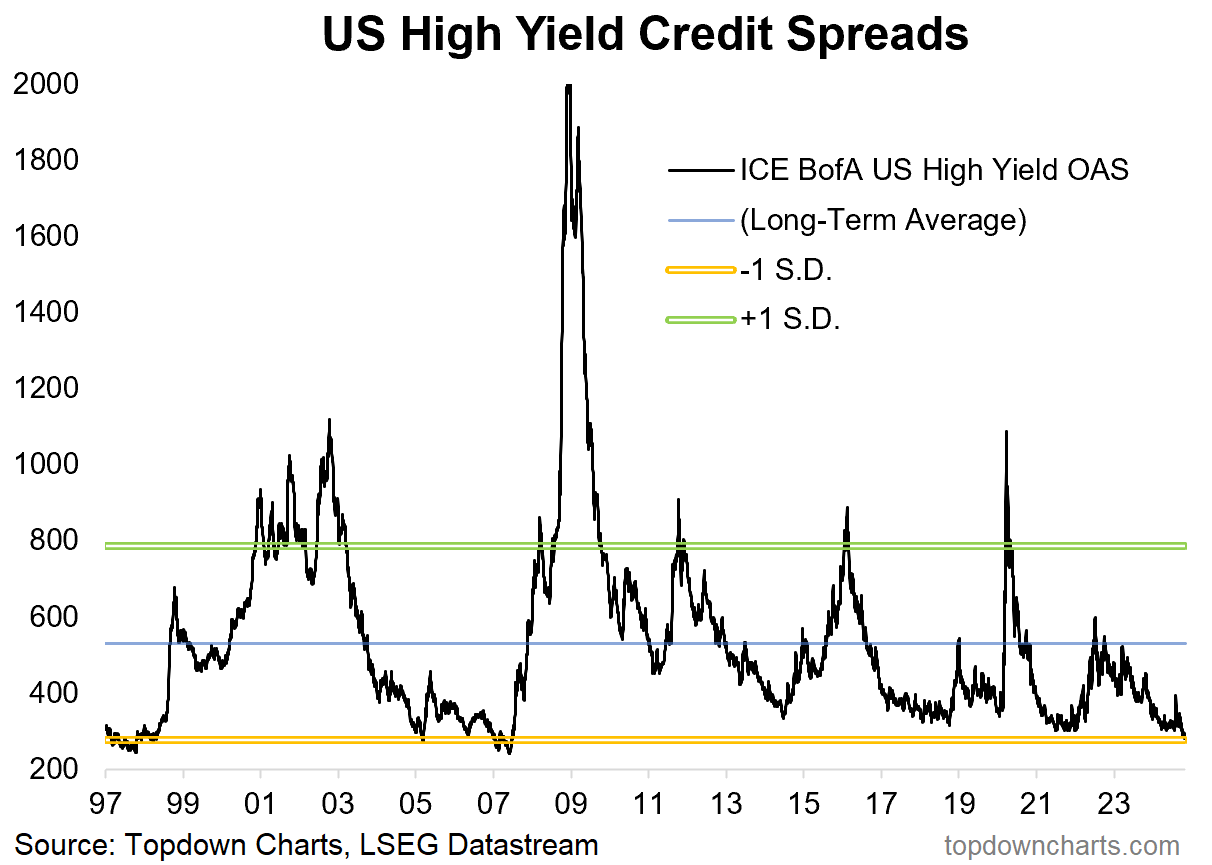
Topdown Charts: Chart of the Week - Credit Spreads Credit spreads have fallen back to 2007 levels...
… On that last note, the chart below is most relevant to active fixed income investors and asset allocators because historically the best time to take on credit risk… i.e. the time where you get richly compensated, is when credit spreads spike to very high levels.
Meanwhile, the worst time is typically when credit spreads reach rock bottom.
Much like when the stockmarket reaches expensive levels, it’s the time when everyone chases the prospect of higher returns and throws caution to the wind — and it’s also usually the time to move more defensive.
The point where confidence becomes complacency is when the business cycle starts to deteriorate, credit risk rises, and credit spreads become unjustifiably low.
I don’t think we’re quite there yet as there is still some resilience in the economic data, but this is the point of maximum required vigilance — echoing my observations elsewhere that stocks are also looking increasingly expensive, and forward looking risk therefore is on the rise more broadly.
Key point: The 17-year low in credit spreads represents bullish confidence and strong economic conditions, but also implores increased vigilance for active fixed income investors and asset allocators.
… finally somewhat more from the (other)Wolf of Wall on jobs …
WolfST: Hiring Jumps for 3rd Month, Workers Cling to Jobs, Layoffs & Discharges Jump but Remain Low, Job Openings Fall
Hurricanes in September & October and the Boeing strike will mess with labor market data for a few months; the Fed won’t get clear answers.
…Quits: Workers cling to their jobs. Voluntary quits fell to 3.07 million in September. The three-month average fell to 3.16 million, back to March 2018 levels.
The huge churn during the pandemic, when workers jumped jobs and industries to improve their pay and working conditions, and to better match their skills and aspirations, thereby triggering the biggest pay increases in decades, has ended.
Fewer voluntary quits mean fewer newly open slots that have to be filled, so fewer job openings, as we’ll see in a moment, and fewer hires to fill those openings.
For employers, lower quits is a big improvement. Productivity rises when workers stay longer and learn the ropes. Pay increases have moderated because employers no longer have to poach each other’s employees by offering better pay. Employers are re-exerting control and they’re cleaning out the deadwood. Some are now mandating the return to the office at least for a few days a week, knowing that most people won’t quit over those policies, and if they do, fine.
… finally, if dems and repubs (or Team Rate CUTS and the other guys) don’t start gettin’ along, that there water’s gonna boil …


Counter-Narrative*2=Don't call half a nation garbage when attempting to win a national election 😜
https://www.zerohedge.com/personal-finance/october-surprise-adp-employment-report-signals-six-sigma-beat-week-elections