while WE slept: USTs aggressively UNCH; CPI recaps; #Got2s in-range (BMO) OR rates 'clean break' (CitiFX); "How markets are still underestimating inflation risk" (how or WHY? DB answers)
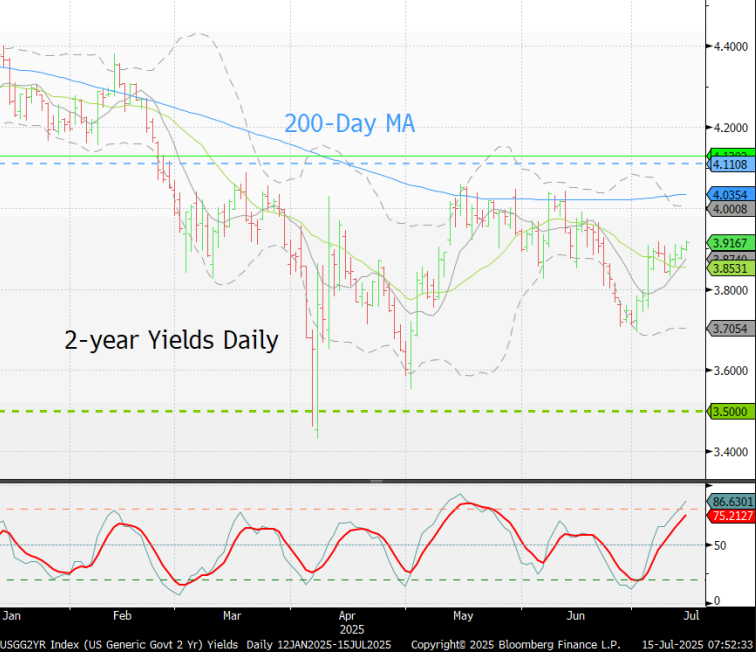
2yy DAILY: 4.00 more psychologically important than anything else but …
… momentum now stretching into overSOLD territory all we need now is some de / dis inflation and / or a reason to believe in the next Fed chair an uber dove …
… meanwhile, as you’ll see below, MY hopes and dreams to see the current market in-range, defined and just waiting — BMO below will agree BUT CitiFX very clearly looking at price action and seeing, “A Clean Break” … certainly further out the curve, I’m certain I’d agree…
Meanwhile, back at the ranch, while I was gone, what’d I miss … Banks BEAT …
ZH: JPMorgan Beats Top And Bottom Line On Solid Investment Banking, Trading Results
… unrelated (?) …
ZH: Jamie Dimon Says Private Credit Is Dangerous But Allocates $50 Billion
… and CPI beat expectations (again) but …
ZH: Tariff-ic! Core Consumer Price Inflation Cooler Than Expected In June
… cooler than expected but NOT cool and NOT enough.
Speaking of enough — I have had quite enough and I’m sure you have too and so rather than continuing on to say not much I’ll move along and note latest from HIMCO remains “Not Found” … and away we go but first … here is a snapshot OF USTs as of 657a:
… for somewhat MORE of the news you might be able to use … a few more curated links for your dining and dancing pleasure …
NEWSQUAWK US Market Open: NQ underperforms after ASML (-8%) earnings, PPI, earnings and Fed speak ahead … USTs are incrementally firmer/flat (whilst global peers are broadly lower). Currently in a in a very thin 110-08+ to 111-13+ band, awaiting PPI, Industrial Production and Fed speak. PPI will be scoured to see if the series’ internals are evident of tariff-driven price pressures emerging; a slew of Fed speakers are also due.
Yield Hunting Daily Note | July 15, 2025 | CPI Day, RA Rolls On, SCD Rights Results, Sell RMM And FPF.
Finviz (for everything else I might have overlooked …)
Moving from some of the news to some of THE VIEWS you might be able to use… here’s some of what Global Wall St is sayin’ … MOSTLY in response to CPI …
Before jumping fully into CPI recaps, this first note has been widely advertised on bobble head TV and so, from firm who’s earnings just dropped …
15 July 2025 BAML: Global Fund Manager Survey Sticky Toppy Pudding
Bottom Line: investor sentiment most bullish since Feb'25 on biggest surge in profit optimism since Jul'20 & record surge in risk appetite past 3 months; cash levels fall to 3.9% triggering “sell signal”; sentiment getting “toppy” but with equity OW not yet extreme, bond vol still low, greed always much harder to reverse than fear, investors more likely to stick to summer of hedging & rotation rather than big shorts & retreat.
…BofA FMS average cash level declined to 3.9% in July from 4.2% in June, triggering a “sell” signal; median 4-week S&P 500 loss post 17 “sell” signals since 2011 is -2% (biggest loss recorded post-sell signal = -29%, best gain 3%).
2nd “sell” signal in past week from BofA Global Investment Strategy trading rules; BofA Global Flow Trading Rule triggered last week (see The Flow Show report); BofA Global Breadth Rule remains close to a “sell” signal; July FMS data takes BofA Bull & Bear Indicator to 6.2 from 6.1 (sell signal requires >8.0).
This tennis tournament sponsoring British firm with a look at US CPI …
Core CPI rose 0.23% m/m (2.9% y/y) in June, in line with our expectation. While the print seems soft at first glance, there are signs of tariff pass-through in the core goods categories, indicating a build-up of price pressures. We continue to expect core inflation to peak in early autumn.
…The data suggest that tariff pass-through to prices is underfoot. Our baseline assumption for about a 50% pass-through to prices seems reasonable and is consistent with latest Fed surveys1 and our own cross-asset analysis, which indicates that firms are intentional about raising prices. The uncertainty for us has always been about the timing of the pass-through. We continue to think that prices will gradually increase in the subsequent months, peaking in early autumn, and leave our core inflation forecast path unchanged after today's data.c
Best in show … CPI recap / victory lap AND some thoughts as dust settled …
July 15, 2025 BMO: Core-CPI +0.228% - muted response, waiting to see...
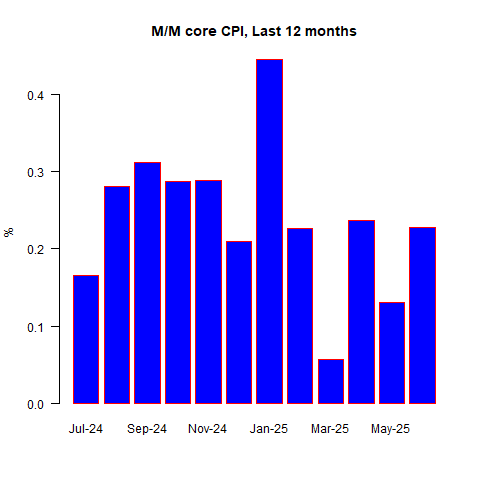
CPI in June increased +0.3% MoM vs. +0.1% May and +0.3% forecasted. The YoY pace increased +2.7% vs. +2.4% prior and +2.6% anticipated. Core-CPI increased +0.2% MoM vs. +0.1% prior and +0.3% anticipated. On an unrounded basis, coreCPI was +0.228% MoM vs. +0.130% MoM prior -- largely in line with expectations. The 3-month annualized rate for core-CPI bounced to +2.4% from +1.7%. YoY core-CPI upticked to +2.9%, as-expected, from +2.8% prior. Supercore -- core-CPI services ex-rent/OER was +0.212% (4-month high) versus +0.061% prior. Core goods came in at +0.198% MoM vs. -0.04% MoM prior -- an increase, but nothing that would get the market overly concerned about a troubling level of tariff passthrough. New cars fell -0.34% and used cars were -0.67%. Apparel gained +0.4%. Airfares were -0.1%. Overall, another benign inflation update for June.
In a typical environment, one would expect this report would start conversations about a Fed cut. Alas, the looming August 1 round of tariffs will keep the Fed on hold for now. From here, there is a variety of Fed speak scheduled for the session and investors will be attuned for any near-term policy hints -- even if such guidance is unlikely at the moment…
…June’s inflation data offered evidence that tariffs are beginning to exert upward pressure on realized consumer prices as the trade war continues to escalate. Specifically, when viewing core goods inflation in the absence of the drag on auto prices, the pace was +0.6% – the highest in 43 months. However, core-CPI came in at a more benign +0.228% pace, a level that is consistent with core-PCE at +0.3%. The initial response in Treasuries was a bull flattening, although the price action eventually faded, and the market cheapened within the prevailing range. The inflation update wasn’t sufficient to break US rates out of the local trading zone and as a result, we don’t expect the secondary inflation updates (PPI and Import Prices) will trigger a broader repricing – certainly not toward higher yields in light of the crosscurrents of risks in place at the moment.
We’re struggling with the forward inflationary implications from the evidence of tariff pass-through. Had the upside in core-goods ex-autos been dramatic enough to push core-CPI above the +0.3% consensus, then expectations for summertime reflation would have been far more straightforward (and higher). As it stands, core-CPI was below forecasts despite clear confirmation that tariffs are driving certain prices in the US higher. The June CPI release has led to a few meaningful questions. First, what if the eventual influence of tariffs doesn’t trigger meaningful upside surprises for the aggregate core-CPI pace – as many have been expecting? Isolated pockets of trade-war-related inflation shouldn’t escalate to the level of being a driver of monetary policy decisions – particularly in the event that such inflation is owing to one-time price adjustments. Not all inflation should be considered in the same light.
Second, where should Treasury yields be if Trump’s tariff pauses/delays have actually smoothed out the impact from the trade war over several months, thereby offsetting the risk of a 2022-style core inflation spike? Rates should certainly be lower in the front-end of the market as such an outcome would allow the Fed to follow-through with the 50 bp of additional cuts for this year signaled in the June SEP. To be fair, the market isn’t viewing June’s core-CPI breakdown as a ‘gradual’ response to tariffs – instead, the sentiment appears to be that it’s just the tip of the iceberg – or tariffberg, as it were.
Hence, our struggle with forming an especially strong takeaway from the inflation figures. Let us not forget that OER/ Rent was a key pillar of core-CPI throughout much of the post-pandemic period of sticky inflation and as housing inflation subsides, it isn’t difficult to envision the impact offsetting tariff-driven goods inflation – at least to some extent.If nothing else, the June CPI report has provided confirmation of the prudence of Powell’s wait-and-see policy stance, even if the President doesn’t agree. Following the CPI release, Trump posted “Fed should cut Rates by 3 Points. Very Low Inflation. One Trillion Dollars a year would be saved!!!” Note that the front-end of the market only continued to cheapen following this headline. Food for thought as the market settles in for a midsummer’s nap…
France on CPI …
15 JUL 2025 BNP US June CPI: Pockets of weakness mask rising tariff pass-through
KEY MESSAGES
The US June CPI report showed unambiguous evidence of tariff pass-through to goods prices, in our view, though the overall print was limited by yet more weakness in discretionary services categories and vehicle prices.
We think it may be difficult for hotel, airfare and vehicle prices to continue falling for the balance of the year, while tariff pass-through seems likely to ramp up further.
As a result, we expect a pickup in m/m core inflation readings starting with the July CPI report.
A very brief techAmental interruption / diversion from CPI recaps / victory laps …
Wednesday, Jul 16, 2025 CitiFX: US rates: A clean break
We've broken above key resistance ranges in US 5y, 10y and 30y yields, while also posting outside day candlesticks. Momentum is also on the verge of crossing higher. These suggest that we could see higher yields in the short term.
Key resistance levels:
2y yields: 3.96% (descending resistance), followed by 4.04% (55w MA, 200d MA)
5y yields: 4.09% (200d MA), followed by 4.17% (May high)
10y yields: 4.52% (76.4% Fibonacci, June high), followed by 4.62%(May high).
30y yields: 5.05% (76.4% Fibonacci), followed by 5.15-5.17% (May 2024 high and 2023 high).
US 2y yields US 2y yields tested resistance at the 3.96% (Descending resistance). We note that weekly momentum is on the verge of crossing higher. IF we see a break of this level, we think yields are likely to head towards 4.04% (55w MA, 200d MA) which has been a strong resistance level.
At the moment, FOMC expectations continue to anchor 2y yields We see support at 3.74% (200w MA).
…US 30y yields Broke and closed decisively above the 5.00% resistance level. We also posted an engulfing daily candlestick in the process, while weekly slow stochastics is on the verge of crossing higher. These are indicators that we may see a move higher in 30y yields. We see resistance at 5.05% (76.4% Fibonacci), followed by stronger resistance at 5.15-5.17% (May 2024 high and 2023 high). Support is likely at 4.89% (55d MA).
… AND I’ll now return you to your regularly scheduled programming …
…Meanwhile, markets have struggled to move on from the debate as to how inflationary the US tariff policy will be with yesterday’s US CPI providing something for everyone on this topic. On the one hand, the core CPI print was below expectations for a 5th consecutive month, and the S&P 500 even moved up to an intraday record at the open. But as investors digested the print and focused on the more obvious tariff impacts in the various components, Treasuries extended their decline and the 30yr yield (+4.3bps) moved back above the 5% mark again (closing at 5.02%). It’s previously closed above 5% for only 9 days since 2007. 6 days were during the issuance- and Fed-driven Treasury sell-off in autumn 2023, and 3 days were back in May this year after the Moody's downgrade and amid increased focus on the implications of the Republican budget bill that was passing through the House.
In terms of the details of the print, monthly CPI came in at +0.29% in June (vs. +0.3% expected), which was a 5-month high but broadly in line with expectations. Moreover, the core CPI measure was a comparatively softer +0.23% (vs. +0.3% expected), which eased fears that this month would see a big jump thanks to the tariffs. However, there were some concerning signs under the surface, and household appliances (+1.9%) saw their biggest monthly price jump in records back to 1999. And if you looked at core goods (excluding used cars and trucks) there was a decent +0.32% monthly gain that was the strongest since February 2023. So the fear is that as the tariff impact is more fully felt (with plenty more in the pipeline), those increases could become more widespread across the consumer basket. Indeed, those concerns were clear in market pricing too, and the 2yr US inflation swap (+2.0bps) moved up to a fresh two-year high of 2.97%. Watch out for PPI today and importantly the usual read through to those categories that directly feed into core PCE. Our economists are tracking +0.30% for the PPI print after yesterday’s data (see their CPI reaction note for more).
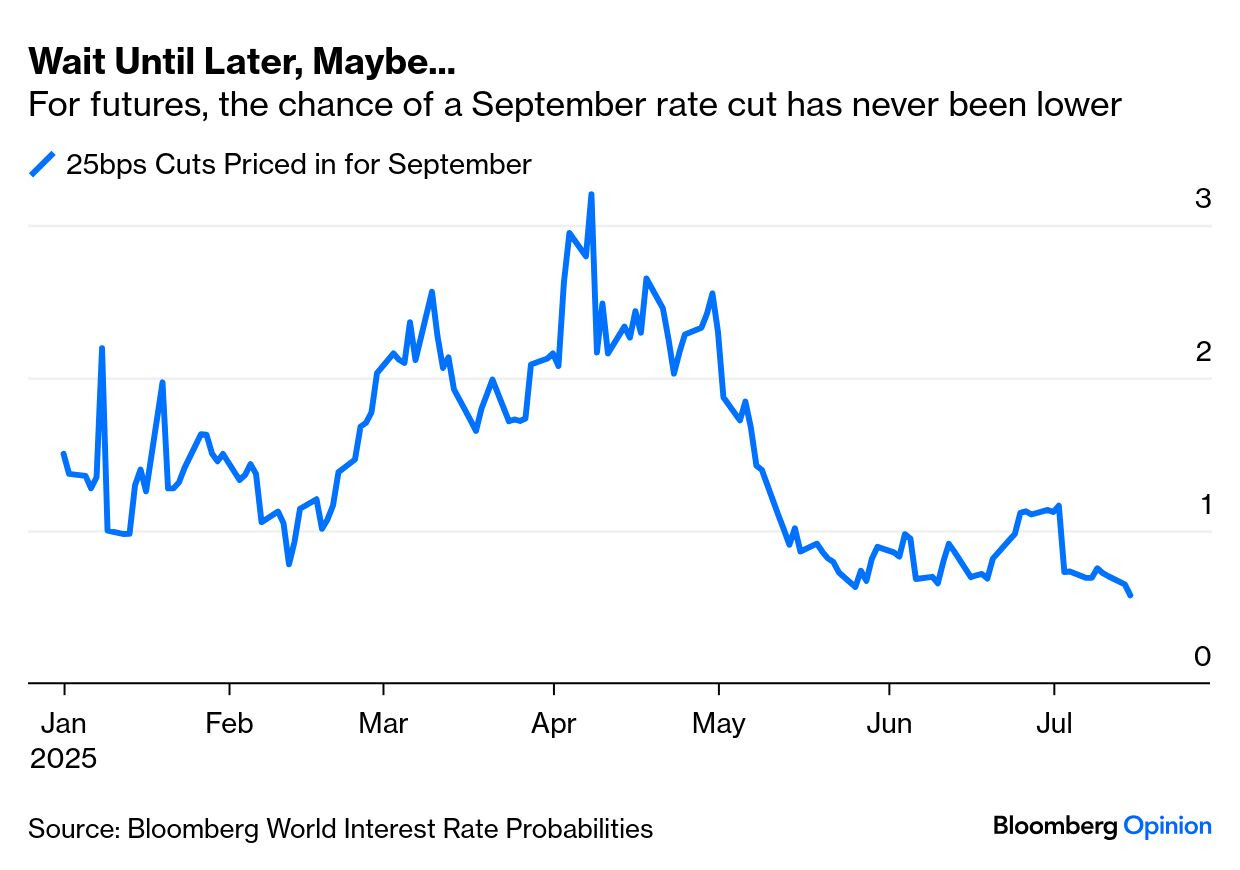
That growing pessimism on inflation meant investors dialled back their expectations for rate cuts this year. They are now pricing in a rate cut by September as only a 58% probability, down from 65% the day before. And for the year as a whole, investors now see just 44bps of rate cuts by the December meeting, down from 48bps the day before. That said, there was another round of calls for rate cuts from President Trump, who posted afterwards that the “Fed should cut Rates by 3 Points. Very Low Inflation. One Trillion Dollars a year would be saved!!!” But there was no such urgency in the limited Fedspeak following the CPI print, with Boston Fed President Collins saying that “an ‘actively patient’ approach to monetary policy remains appropriate”. And for markets, the prospect of fewer rate cuts and more inflation helped to push Treasury yields higher across the curve. So the 2yr yield (+4.1bps) was up to 3.94%, the 10yr yield (+4.8bps) hit a one-month high of 4.48%, and the 30yr yield (+4.3bps) closed above 5% for the first time since May 23rd, at 5.02%.
The hawkish implications from the CPI print meant that most equities struggled…
15 July 2025 DB: June CPI recap: Tip of the tariff iceberg
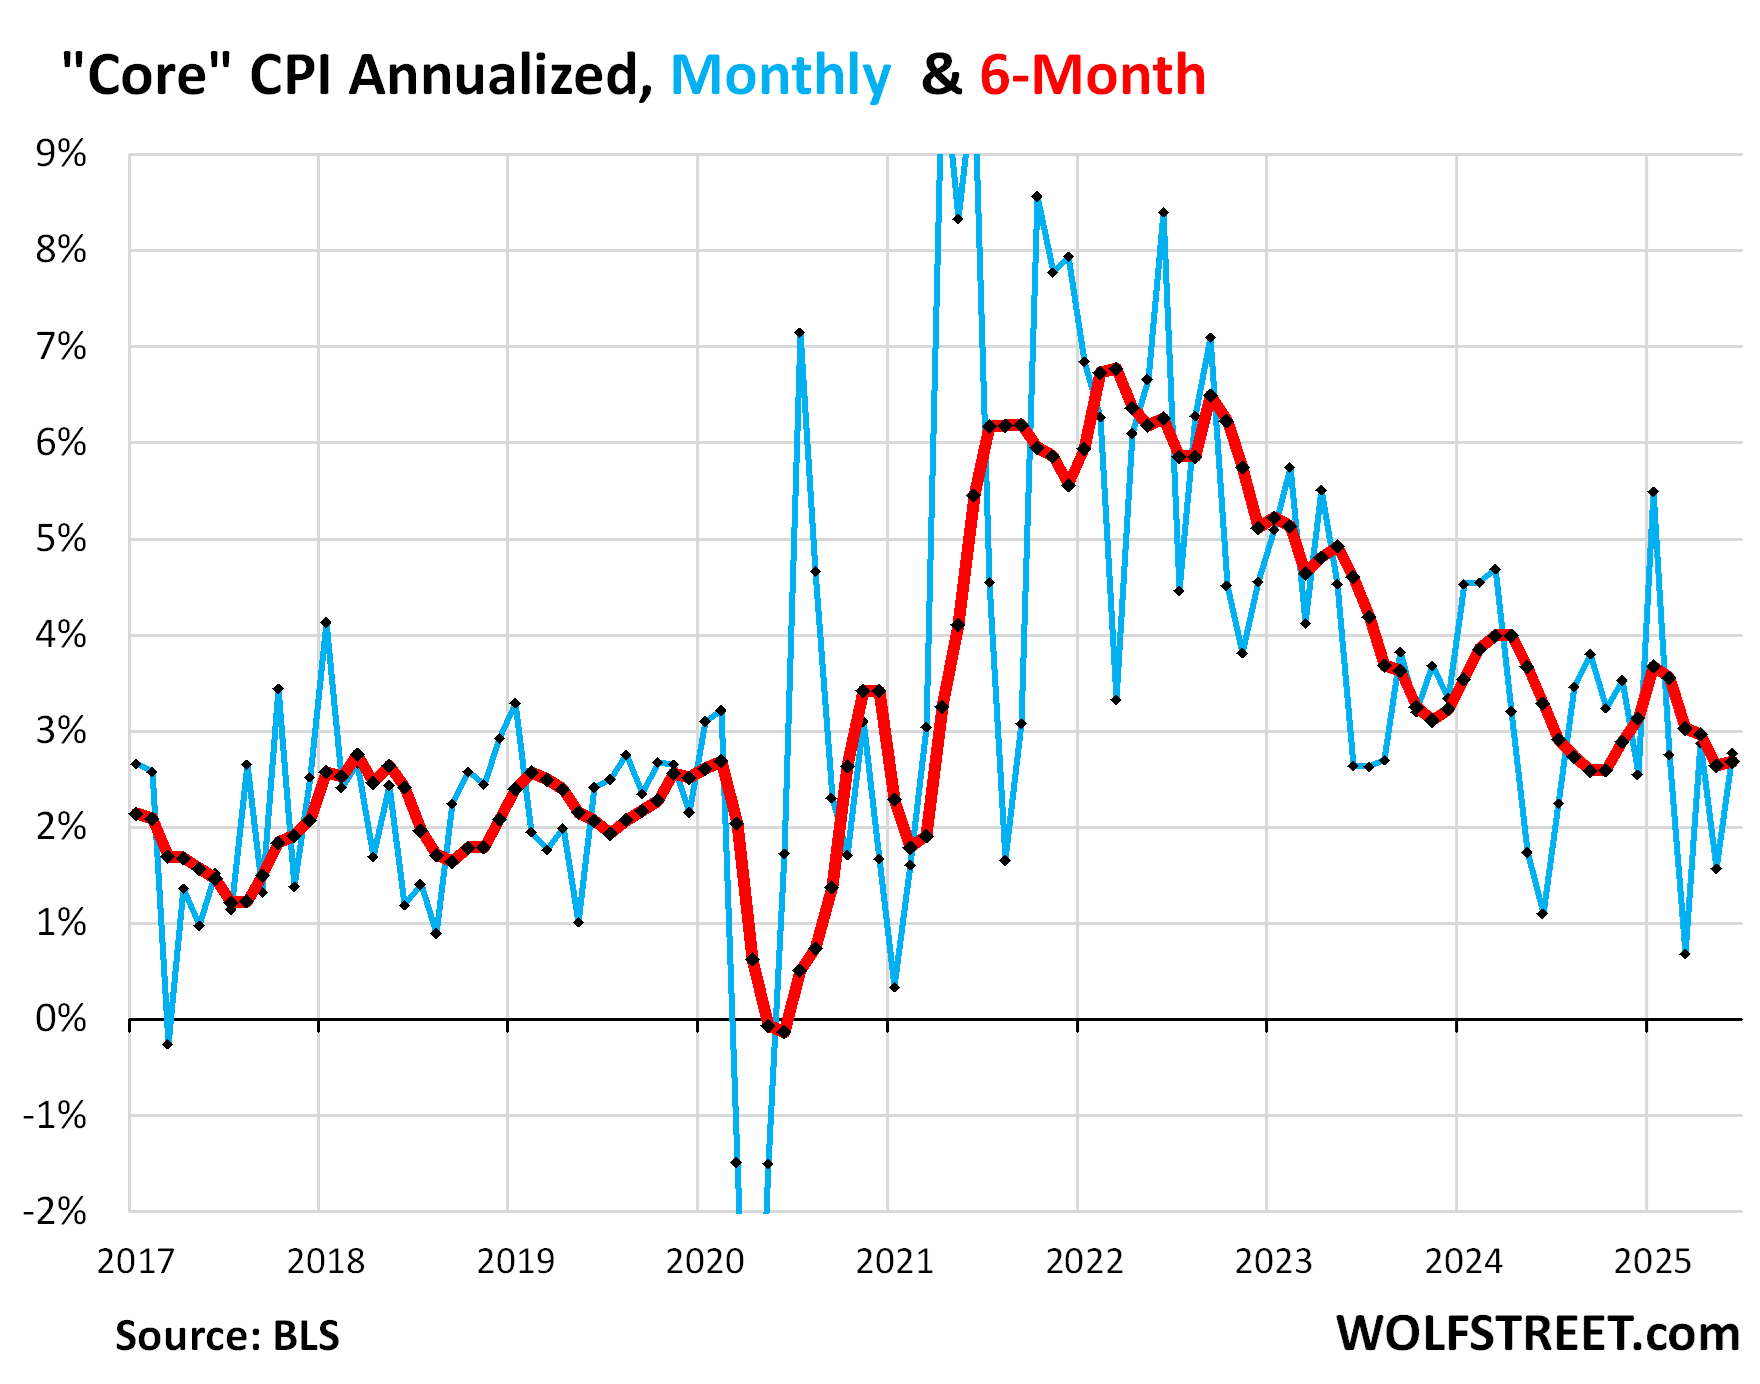
Both headline (+0.29% vs. +0.08% in May) and core (+0.23 vs. +0.13%) CPI were slightly softer than our expectations. The year-over-year rate for headline rose three-tenths to 2.7% while that for core ticked up a tenth to 2.9%. Shorter-term trends for core were mixed, with the three-month annualized rate jumping 70bps to 2.4%, while the six-month rate rose by 4bps and rounded up to 2.7%.
Alternative measures of trend inflation were firmer than core and were more in line with our ex-ante expectations. Year-over-year rates for both trimmed mean and median CPI picked up, the former by two-tenths to 3.2% and the latter by one to 3.6%.
In terms of the breakdown within the expenditure basket, core goods prices were strong, showing broad-based signs of tariff impacts. Automobile prices were the only major source of weakness within goods, though leading indicators suggest that tariff impacts are likely to show up there as well in upcoming data.
Core services picked up from May but were on the softer side as rents remained tame. Lodging away prices were particularly weak and airfares declined, albeit slightly, for the fifth month in a row. While this could be a function of consumers pulling back on discretionary services, other categories such as personal care services did not show such weakness.
In terms of the readthrough to core PCE, based on today’s CPI data and conditional on our forecasts for the remaining components, we are tracking +0.30% for the June print, which would have the year-over-year rate tick up a tenth to 2.8%. Details in Wednesday’s PPI and Thursday’s import prices will help fill in the rest of the picture for core PCE. Should core PCE print meaningfully above core CPI in June, prospects for a near-term rate cut would be reduced.
…Turning to core services ex rent (+0.21% vs. +0.06%), much of the weakness was a function of a 2.9% decline (vs. -0.1%) in lodging away from home prices. Similarly, airline fares (-0.1% vs. -2.7%) declined, albeit slightly, for the fifth month in a row and are down over 14% since January.
CPI aside, a note from Germany on mkt reflex TO quarterly reFUNding announcements (QRAs) …
15 July 2025 DB: Market reactions to Treasury QRAs
Several Treasury quarterly refunding announcements (QRAs) in recent years have triggered outsized market reactions, leading to greater focus on these events. Today’s chart highlights three notable episodes:
August 2023: Despite being well telegraphed months in advance, Treasury’s across-the-board increases in coupon auction sizes sparked a sell-off in rates. Investors may have already been on edge following the unveiling of a massive $1 trillion borrowing estimate just days before the QRA, driven by a combination of post-debt ceiling TGA rebuilding and higher deficit forecast.
November 2023: Responding to elevated yields, Treasury slowed the pace of increases in 20-year and 30-year issuance. The market rallied sharply on the announcement. Stretched valuations (10-year Treasuries had touched 5% in October) and growing expectations for a Fed dovish pivot may have also helped fuel the rally.
May 2025: The post-QRA sell-off was somewhat surprising, given Treasury reaffirmed its expectations of leaving coupon sizes unchanged for at least several quarters, effectively ruling out issuance increases in 2025. Expectations may have been high heading into the event, with chatters around more aggressive WAM-shortening measures or increased buyback operations which ultimately did not materialize.
Looking ahead to the August refunding, markets are once again thick with anticipation. A shift toward increased T-bill issuance (see “Why Treasury is leaning more on T-bills (and what could go wrong)”), Treasury’s commitment to running a high cash target, changes to buybacks, and possible signals on pausing or reducing long-end issuance are all part of the recent conversation. We plan to address these in our upcoming refunding preview.
Additionally, Treasury faces a similar post-debt ceiling dynamic as August 2023, as it will need to revise its near-term borrowing estimate substantially higher – we expect an increase from $554bn to around $850bn for Q3. The setup around the August refunding is likely negative and suggests upside risk to yields. The key question is whether Treasury will lean into market expectations with a more aggressive – even if unorthodox – approach to keep rates in check, or will it adhere to its established “regular and predictable” strategy but risk another sell-off, similar to last quarter.
Last note — a question — from this rather large German bank …
16 July 2025 DB: Mapping Markets: How markets are still underestimating inflation risk
Yesterday’s US CPI print prompted an interesting market reaction. Despite initial relief, a focus on the components like core goods led to growing alarm about the tariff impact, which prompted a spike in Treasury yields across the curve.
Yet even now, the problem is that inflation risks are still being underestimated, with a remarkable complacency across key assets. That is particularly so when you consider that the 2021-23 inflation spike wasn’t anticipated at all in advance. And it’s already the 4th year in a row (so far) that markets have overestimated how dovish the Fed are going to be.
Today, there are several factors coalescing at a global level that can push inflation higher still. Most notably, tariff rates are rising, with a 10% baseline in the US and several sectoral tariffs already imposed. There’s still the looming prospect of tariffs on August 1 which markets simply aren’t pricing in yet. In the Euro Area, there’s a huge fiscal stimulus in the pipeline, at a time when unemployment is at multi-decade lows. Monetary policy lags are still working through from recent rate cuts. Deficits remain high, increasing the temptation to use inflation as a temporary fix. And the balance of probability on future unknown shocks also tilts in an inflationary direction.
Why are inflation risks coalescing right now? 1. The tariff impacts are yet to be fully felt in prices, with a 10% baseline already in place alongside sectoral tariffs. Moreover, there’s the prospect of higher rates ahead on August 1 which markets simply aren’t pricing in…
…2. The tariffs now being proposed risk sparking retaliation by other countries and a fresh round of price hikes. We already saw an escalatory spiral like that between the US and China after April 2, when tariffs surged above 100%…
…3. Fiscal stimulus in Europe in the pipeline, at a time when unemployment at record lows and spare capacity is far more limited than the 2010s….
…4. Monetary policy operates with a time lag that peaks around 18 months later, so we’ll still be feeling the effects of easier policy from the Fed and ECB for the rest of this year…
…5. Deficits remain at high levels across the major economies, increasing the temptation for a surprise burst of inflation that erodes the real value of the debt stock..
…6. The likely pattern of future unknown shocks also skews towards more inflation…
…Market implications From a market standpoint, investors need to face up to the fact that this is now the 4th year in a row (at least so far) that markets have underestimated how hawkish the Fed would be. After all, at the start of 2025, futures were pricing in a Fed rate cut by the June meeting, which hasn’t happened…
As expected … so says he … esp if you shape shift the conversation a bit …
July 15, 2025 First Trust: The Consumer Price Index (CPI) Rose 0.3% in June
…Implications: Inflation came in as expected in June, with the Consumer Price Index rising 0.3%, and the year-ago comparison moving up to 2.7%. Although some analysts may interpret this as proof that tariffs are finally influencing inflation figures, we believe this connection is overstated. Yes, tariffs can raise prices for the tariffed items, but they leave less money left over for other goods and services. They shuffle the deckchairs on the inflation ship, not how high or low the ship sits in the water. That’s up to the money supply, which is up less than a percentage point since April 2022. We believe this relative monetary tightness is why inflation will resume its bumpy path downward in the months ahead…We also like to follow “Supercore” inflation – a subset category of prices that excludes food, energy, other goods, and housing rents. Fed Chair Jerome Powell said back in 2022 that they follow this category closely, though he stopped mentioning it when this measure stopped showing progress versus inflation. However, it appears that tide has also turned for the category, with supercore prices up at a 1.1% annualized pace in the last five months, while the year-ago comparison has fallen from 4.1% in January to 3.0% in June. Notable decliners this month within the supercore category were once again prices for hotels (-3.6%) and airline fare (-0.1%), now the fourth month in a row where both have declined: a potential sign of a slowing economy. Although inflation is still above the Fed’s 2.0% target, given the lags in monetary policy and slow growth in the M2 measure of the money supply, we believe it’s time for the Fed to consider reducing short-term rates slightly in the months ahead…
Fiscally muddied waters …
15 July 2025 ING Rates Spark: Politics and fiscal issues muddy waters
Passing the new budget through the French parliament may prove difficult and generate more rates volatility. EGB spreads look tight given defence spending ambitions. US Treasuries yields decide to test the upside, and for good reason we think
…Treasuries decide to take matters into their own hands for a bit US Treasuries went into sell-off mode about an hour after Tuesday's CPI numbers. It was not driven by the CPI data itself (as the data was okay versus what was expected). But the CPI data did present an opportunity for the bulls to have a go at pushing yields lower. The fact that the market went the other way is indicative of one of two things. Either a large seller or two decided to counter the potential buy mood with a large contrarian order. Or, we’re breaking out here to the upside premised off the mood music of the past few weeks, which has been interlaced with unsolved fiscal concerns and future upside risks to inflation (tariffs), which in turn makes Fed cuts tougher to deliver. There is also the extra issuance to be done. The fuss over Chair Powell’s position is a factor too. And there is background fiscal concerns doing the rounds too (Japan, UK). It’s all a bit messy. But we can’t say this latest move does not make sense. Quite the contrary – it makes full sense…
Mike Gapen in his not so new role … on CPI …
July 15, 2025 MS: US Inflation Monitor: June CPI: A mild tariff push
CPI came in below expectations, with core rising by 0.23% m/m (MS: 0.28%) and headline by 0.29% (MS: 0.31%). This leaves core at 2.93% and headline at 2.67% y/y. We now forecast core PCE inflation increased 0.35%m/m in June.
As expected, core goods moved back to positive territory showing more signs of a tariff push. Still, there are heavily tariffed goods without signs of meaningful price pressures yet, like new cars. We expect more acceleration the rest of the summer, with monthly readings peaking in August.
We think that stronger inflation prints ahead and a relatively low unemployment rate the rest of the year will delay cuts until 2026. We expect the Fed to start cutting rates in Mar-26. However, the Fed might lean toward earlier cuts if inflation is more contained over the rest of the summer.
Tariffs are much more evident in PCE. Incorporating inputs from CPI, we now forecast core PCE inflation increased 0.35%m/m in June, bringing the 12-month pace to 2.81% y/y. We will update our forecasts after PPI tomorrow. We now see core goods PCE at 0.39%, higher than our expectations before CPI. Core goods are higher in PCE than CPI because cars, which came in negative, carry a higher weight in CPI.
Core goods came in a touch below expectations due to weaker-than-expected used car prices, but there is clear evidence of a tariff push in June. Core services came in a slightly softer than expected due to softer rents and car insurance.
Same shop on the fiscal …
July 15, 2025 MS: US Public Policy: Fiscal Over the Finish Line
We assess the equity, tax, economic, and supply implications of the enactment of OBBBA: cash flow benefits appear to be significant, but overall fiscal impulse is modest & not enough to offset drags from other policy changes. Bill issuance needed to rebuild TGA is smaller than would have been if the OBBBA passed closer to the x-date.
Fiscal front-loading: The final OBBBA implies somewhat higher incremental deficits than our prior baseline, but the difference may be offset by higher tariff revenues. Fiscal sensitivity is ~0.4pp to real GDP in 2026 vs. 0.2pp prior, which is meaningful but not enough to offset the drag from trade and immigration policy. We see front-loaded deficits & back-loaded surpluses, suggesting the fiscal impulse in the short run turns later into a fiscal drag.
Significant cash flow benefits: The majority of the policies in the One Big Beautiful Bill Act (OBBBA) will primarily impact cash flows versus reported P&L tax rates and earnings. Upfront R&D expensing accelerates cash tax savings in particular for tech, comm. services, & healthcare, while bonus depreciation benefits capital-intensive industries like A&D, industrials, telecom, tech, & energy.
Stock screen: We identify potential beneficiaries, which are companies with significant, forecasted spending on R&D and capital expenditures that also have substantial pre-tax earnings and pay meaningful cash taxes; we also focus on domestically-oriented companies with significant US assets.
Removal of Sec 899 is constructive for equities, but the risk of retaliatory taxes is not behind us: Section 891 is current law and could re-surface as a risk if countries do not amend their respective tax policies.
TGA rebuild earlier, but smaller: Therebuild of the TGA will happen sooner, but bill issuance needed will be lower as the TGA is closer to target than in the prior debt limit episode. We see recent comments from Treasury leading to lowered investor expectations for coupon supply, contributing to downward pressure on yields…
Back across the pond we go for yet another CPI recap / victory lap …
15 Jul 2025 NatWEST: US Consumer Price Index (CPI) (June)
The June CPI was largely in line with expectations. The headline CPI increased by +0.3% (consensus +0.3% and NatWest +0.2%) and core CPI (ex-food and energy) ticked up by +0.2% (consensus +0.3%, NatWest +0.2%) in June after a modest 0.1% uptick in May. The unrounded gain in the core CPI was 0.228% (NatWest +0.226%), not too far off from its year-to-date average gain of 0.221%. On a three-month annualized basis, the core CPI increased from 1.7% in May to 2.4% in June while the six-month annualized rate inched up from 2.6% to 2.7%—suggesting some quickening in prices last month. Moreover, on a y/y basis, base effects also pushed up the CPI. While the total CPI climbed up from 2.4% in May to 2.7% in June the core CPI ticked up from 2.8% to 2.9%.
Despite a trend-like monthly gain in the core CPI, there were signs of tariff-led gains in various components last month (as detailed below). We expect the impact from tariffs in place so far to become more pronounced—as outline in our latest note here. Moreover, President’s Trump renewed calls for higher reciprocal levies, which could go into effect as early as August 1 if no trade deals are reached, pose another upside risk to the inflation outlook. At this point though we have not folded in any inflationary impact from these latest tariff rates set out in various tariff letters sent to trading partners and continue to look for core CPI inflation to rise to 3.5% by December 2025 (3.4% on a Q4/Q4 basis)…
3 takeaways: Seasonal adjustment issues, rising inflation, & some tariffs
The moderately elevated headline and core CPI seasonally-adjusted monthly changes were held down notably by seasonal adjustment factors that are still being pushed around by pandemic swings. If we exclude the pandemic-era years (2020-2022) from the seasonal adjustment calculations, we estimate that the seasonally-adjusted monthly core CPI change would have been around 9bp higher than what was published today.
Abstracting from the seasonal adjustment issues today's release showed the notseasonally-adjusted core CPI increase in June was 14bp above June last year. This is the largest month-over-12-months-prior difference since core CPI inflation peaked in September 2022, and consequently 12-month core inflation saw its largest set up in 33 months.
We are seeing some sign of tariff pass-through with prices for core goods excluding transportation rising strongly in today's release, but the pick up has not yet been large enough to offset slowing services prices and seasonal adjustment issues…
US June consumer price inflation gave some troubling signals about data quality—not only are fewer prices being measured, there is circumstantial evidence that budget cuts mean more prices are being guessed. However, on the basis of the numbers provided, it is clear that President Trump’s trade taxes are being passed through to US consumers—the monthly increase in consumer appliance prices was the fastest this century.
Will consumers notice? Food prices are rising, but trade taxes have less of an impact there. It is less frequently bought items that are most vulnerable to trade taxes, and lower frequency purchases have less impact on the perception of inflation. This matters politically and economically—perceived inflation may lead to more political pressure on Trump to retreat, or at least not add further to the US consumer tax burden.
US June producer price inflation should indicate the extent to which trade taxes are flowing down the supply chain. The more companies can raise prices, the less profit margins will suffer as trade taxes hit…
Summary Consumer price inflation picked up in June, rising by 0.3% since May and 2.7% compared to one year ago. The faster price growth was largely anticipated by forecasters, as both the headline and core CPI increases were very close to our projections and the market consensus. Core goods prices rose 0.2% in the month, hinting at greater price pressures from the increase in tariffs on U.S. imports. Yet, core services inflation remained relatively tame, registering a 0.25% increase in June.
In the 12 months ending in June, core consumer prices have risen 2.9%. For the optimists, this represents a modest decline in core inflation from the 3.2% rate registered at the end of 2024. For the pessimists, the core inflation rate has been stuck around current levels since February and is still above the central bank's 2% inflation target. With the impact from tariffs still in the early innings, we expect the FOMC to maintain its wait-and-see approach to the fed funds rate at its upcoming meeting on July 29-30.
However, we still expect the FOMC to begin cutting rates at its September meeting. The gradual softening in the labor market that is ongoing suggests monetary policy is still restrictive, and if tariffs remain near current levels (admittedly a major "if" in today's policy environment), then we think the worst-case scenarios around the inflation outlook are increasingly unlikely.
July 15, 2025 Wells Fargo: Hiding in Plain Sight Spotting the Impact of Tariffs on the Consumer
Summary There is already plenty of emerging evidence of the impact of tariffs on consumer spending, you just have to know where to look.
You Can’t See Me, My Time is Now
A false narrative took shape during the first half of 2025 that centered around a benign impact from tariffs on consumer spending. Revisions should have disabused financial markets of that notion, but a big drag from trade is the main thing most people have taken from the Q1 GDP report.
Even while it is an under-appreciated fact that consumer spending has been revised lower, one of the top questions we get these days involves when we will see the impact of tariffs on consumer spending and in the retail sector. The time is now. The details of consumer spending and retail inventory data already reveal some concrete evidence that tariffs are undeniably impacting consumers:
When it comes to discretionary service outlays, households are cutting back.
In terms of goods-spending, some key tariff-linked items show a measurable pull-forward prior to Liberation Day announcements followed by an air pocket in the months since.
Stockpiling by retailers has mitigated the inflation impact for many goods items. When pre-tariff inventories have been drawn down, the cost pass-through will be stark.
And finally, Dr. Bond Vigilante with some of Global Walls final words …
Jul 15, 2025 Yardeni: Is Inflation Stuck At 3.0% Because Of Trump's Tariffs?
Today's CPI report for June suggests that consumer price inflation is no longer declining toward the Fed's 2.0% target. Instead, it might continue to hover around 3.0% for a while as it has recently (chart). Trump's tariffs may be a contributing factor, though their impact remains debated. The core CPI inflation rate upticked to 2.9% last month, hinting that the core PCED inflation rate (at 2.7% in May) might have followed a similar trend.
President Donald Trump is pushing for the Federal Reserve to cut the federal funds rate (FFR) from 4.33% to 1.00%. This reduction would lower net interest payments on the federal debt, helping to reduce the US budget deficit. A lower FFR could also weaken the dollar, boosting exports and reducing imports. However, Fed Chair Jerome Powell and most Federal Open Market Committee (FOMC) participants are reluctant to cut rates, especially to 1.00%, due to concerns that Trump's tariffs could hinder progress toward the Fed's 2.0% inflation target.
The June CPI report reinforces the FOMC's cautious stance. Although Trump's tariffs may not yet be significantly driving inflation, they appear to be contributing to inflation stalling at around 3.0%, supporting the FOMC's hesitation to lower the FFR…
… And from the Global Wall Street inbox TO the intertubes, a few curated links …
Uh oh …
July 16, 2025 Apollo: AI Bubble Today Is Bigger Than the IT Bubble in the 1990s
The difference between the IT bubble in the 1990s and the AI bubble today is that the top 10 companies in the S&P 500 today are more overvalued than they were in the 1990s, see chart below.
Positions matter and so too does putting ones money where ones mouth is …
July 15, 2025 at 8:30 PM UTC Bloomberg: Bond Traders Boost Bearish Bets as US 30-Year Yields Eclipse 5% By Edward Bolingbroke
A bearish tone is taking hold in the Treasury market amid worries over the risk of tariff-fueled inflation and increased government spending in some of the world’s biggest economies.
In JPMorgan Chase & Co.’s latest Treasury client survey, investors’ net long positioning shrank to the smallest in six weeks. That coincides with selling pressure in US government debt, which picked up on Tuesday after June consumer-price data failed to assuage concerns over the impact of trade levies. In response, investors trimmed bets the Federal Reserve will cut interest rates as soon as September.
The 30-year Treasury yield climbed above 5% for the first time since early June, and there were large flows seen in options bets costing a combined premium of about $10 million that target a jump to around 5.3% within roughly five weeks. The rate on the long bond hasn’t been that high since 2007.
The fresh bout of angst toward the US 30-year bond follows a slump in Japan’s longer-dated government debt this week as investors brace for the prospect of increased fiscal stimulus there in the wake of upper house elections this coming Sunday. Yields on Japanese bonds from the 10-year to the 40-year have spiked this week, echoing the surge seen in global markets in May.
Ruh Roh RelRoy …
July 16, 2025 at 4:00 AM UTC Bloomberg: Never Fully Beaten, Inflation Is Coming Back to Life Just in time for a rates showdown between Trump and the Federal Reserve.
…Inflation’s Turn for the Worse
With new higher tariffs now in force for three months, there was one question that the June consumer price index numbers needed to answer: Are tariffs at last beginning to push up inflation? The answer is an unsatisfying “probably.” Much remains unclear, and there is plenty to argue about, but the data taken in the large make it impossible for the Federal Reserve to cut rates without a clear improvement.
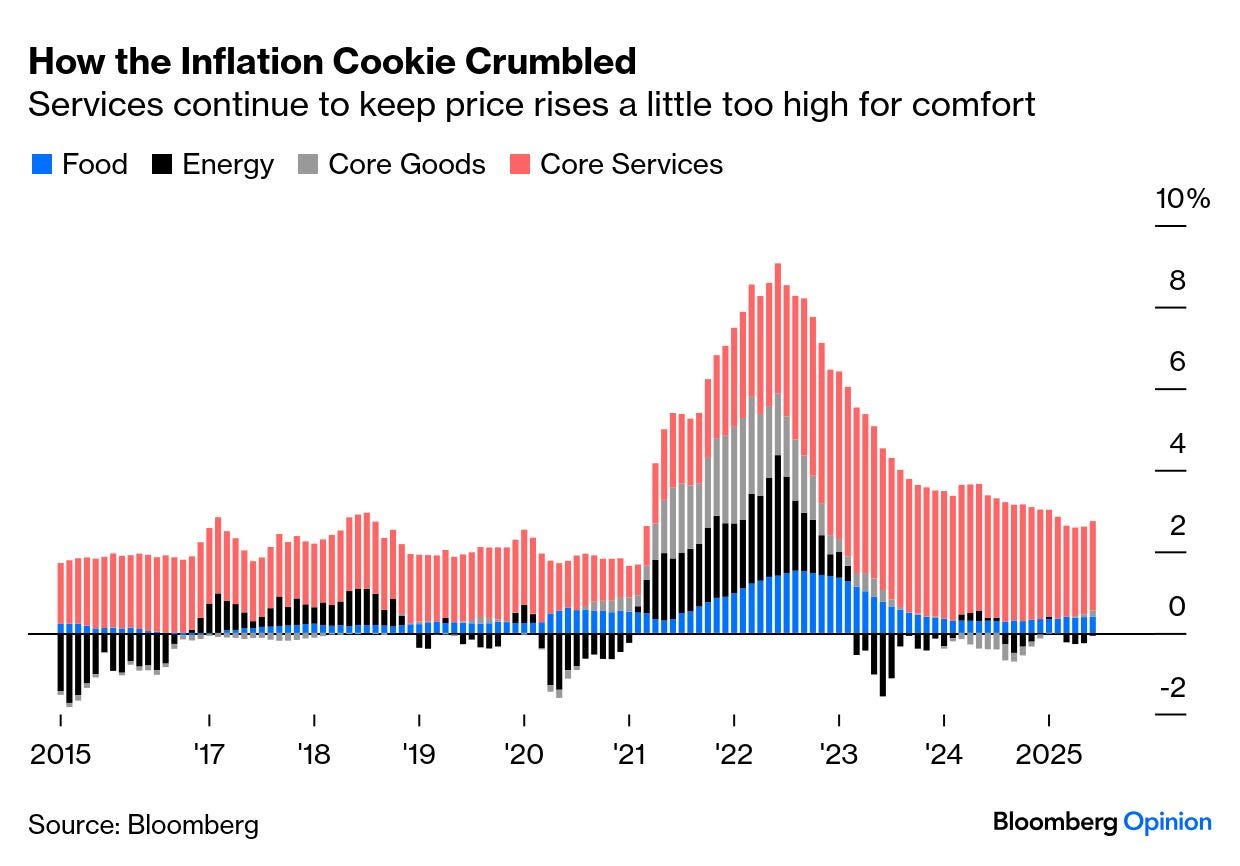
As has been the case for a while, inflation is dominated by the services sector. Food inflation is also returning, although in a much smaller way than during the spike of 2021 and 2022. Falling energy prices keep the headline numbers down. This is our now-familiar One Big Beautiful Chart on how the components of inflation have moved:
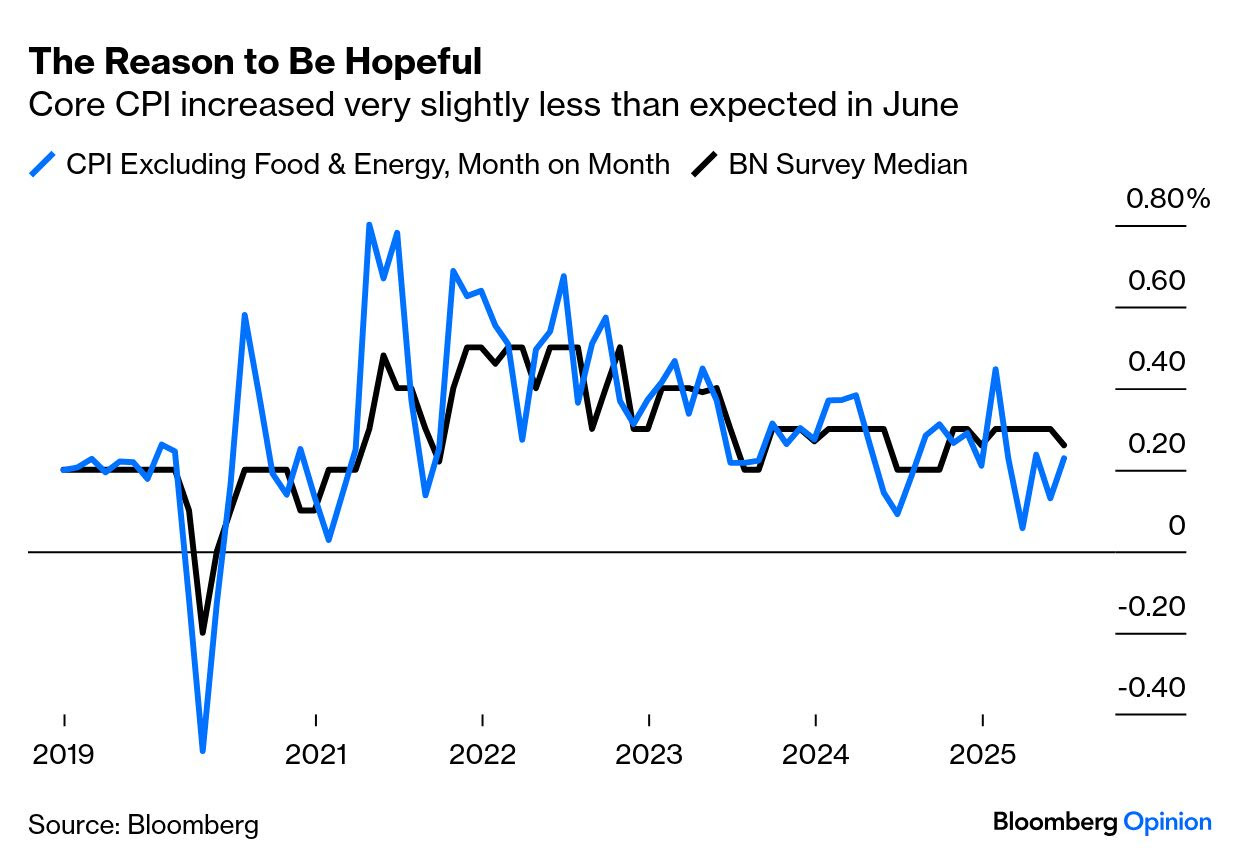
…Exclude cars, and Omair Sharif of Inflation Insights LLC says core goods prices rose 0.55% in June, the most since November 2021. Tariffs aren’t hurting terribly and the effect may prove transitory, but they are starting to bite. The reason for initial optimism when the report came out: Month-on-month core inflation, excluding food and fuel, was very slightly below economists’ expectations as polled by Bloomberg. But that’s been true for most of this year, and the gap is narrowing:
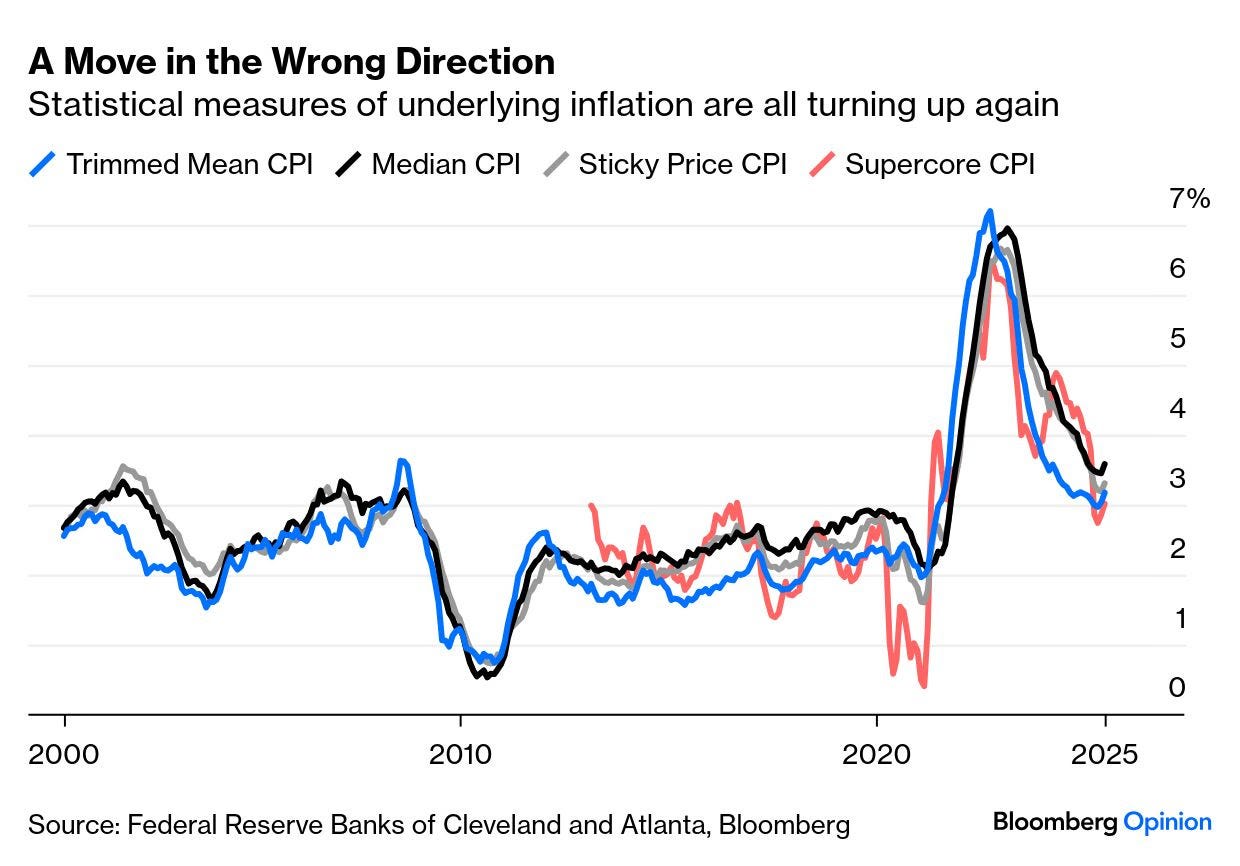
As always, a few components moved emphatically in different directions. The headline was helped by a fall in hotel prices, and shifted upward by rising used car prices. But a range of measures of underlying inflation watched by the Fed all showed price rises increasing again. This was true of the median and the trimmed mean (excluding outliers and averaging the rest); sticky prices, which are difficult to reduce; and the “supercore” measure of services excluding housing. All are back above the 3% upper bound of the Fed’s target, and all are higher than they had been for decades before the spike (with the exception of the trimmed mean, which was briefly higher when oil prices were at an all-time high in 2008). The direction of travel matters, and it’s going the wrong way:
None of this proves that tariffs are going to create another price spike. It does, however, suggest that progress on inflation has ended, without ever getting back to theFed’s target…
…Put all of this together, and there’s little obvious case to move rates. That seems to be what the fed funds futures market judges, as the chances of a cut in September are now their lowest this year, at barely over 50%. Three months ago, the market was pricing a certainty of three cuts by then:
This had a predictable impact on the bond market, with the 30-year Treasury yield creeping back above 5%. The Fed has cut overnight rates by a full percentage point since the 30-year first topped 5% almost two years ago, so the problem of long rates isn’t one over which the central bank has much control (although this didn’t stop an impassioned presidential tweet to cut rates NOW because consumer prices are LOW):
Taken in all, this should have been sobering for the stock market. It wasn’t…
THE Inflation Guy on CPI …
July 15, 2025 E-piphany: Inflation Guy’s CPI Summary (June 2025)
If you squint, can you see an effect of the deportations of illegal aliens in today’s CPI report? I don’t want to encourage anyone to obsess over every jot and tittle of the report. That’s almost always a fraught exercise. But there were at least a couple of things in the data this month which could indicate both inflationary and disinflationary effects of the deportation campaign. A serious part of my brain is saying ‘come on, there just haven’t been many deportations in the context of the population of illegals, how can we see an effect?’ And that instinct is probably right.
Before we get into today’s release let’s remember that there is one important context to keep in mind and that is that unless there are major surprises to the downside, core and headline inflation are going to be accelerating for most of the rest of the year on a year-over-year basis. I discussed this in a short podcast last week, Ep. 145: Beware the Coming Inflation Bounce. So we need to keep in mind as we think about markets and policy that the optics are going to look worse for a while here.
That is, unless we get numbers like we did in the May CPI, which was a major miss due mostly to very soft figures on rent inflation. Last month, Primary rents were +0.213% m/m and Owner’s Equivalent Rent (OER) was +0.275%. Rents are decelerating but not that fast, but if they did then a 2% target on inflation becomes at least possible. It’s not yet possible.
The consensus for today’s number was +0.26% on headline and +0.25% on core. Right in the middle of 0.2% or 0.3% rounded prints. What happened is that we got one that ticked up and one that ticked down. Actual CPI was +0.287% on headline, and +0.228% on core inflation. That caused the year/year headline number to print +2.7%, up from 2.4% last month (and higher than 2.6% expected), and y/y core to be 2.9% (vs 2.8% last month, and as-expected). The usual suspects trumpeted ‘another miss softer on core CPI! Rate cut on tap for September!’ But what is the real story?
The real story is not nearly that encouraging. As we will see, there are quite a few signs that the core miss was an aberration. Not a bad one, but deceiving…
Wolf on CPI … see whatever you wanna see, I suppose … hard to ignore and NOT see this at least give some credit to the spin …
Jul 15, 2025 WolfST: Fed’s Nightmare: CPI Inflation in Services Reheats (not tariffed), while Inflation in Durable Goods, Apparel & Footwear (tariffed) Remains Cool
While pundits looked with their magnifying glasses for tariffs in consumer goods prices, it was in services, which are not tariffed, where inflation took off again. Shocker? No
…“Core” CPI, which excludes food and energy components to track underlying inflation, accelerated to +0.23% in June from May (+2.8% annualized).
The 6-month “core” CPI rose by 2.7% annualized, a slight acceleration from May (red).
Major components of CPI, year-over-year price changes:
Overall CPI: +2.7% (yellow), a sharp acceleration from May, the second acceleration in a row, and the biggest increase since February, despite a year-over-year drop in energy prices.
Core CPI +2.9% (red), an acceleration from May.
Core Services CPI: +3.6% (blue), an acceleration from May.