Good morning … hey, how about that GREAT, STAGflationary news from NAPM and, to a lesser degree, factory orders, yesterday morning …
ZH: US Services Surveys Signal StagflationIn Feb: Higher Prices, Slower Growth ZH: Boeing, Boeing, Gone: US Factory Orders Plunge Most Since COVID Lockdowns In January
… clearly BAD is the (not so)new GOOD and BONDS WERE BID …
30yy DAILY: just dipping beneath 200dMA (4.32) and next ‘resistance’ down nearer 4.20%, at least way MY crayola’s worked out this morning …
… but stocks … well, must NOT have gotten the memo cuz, you know, BAD = GOOD means the yield curve (inversion-ersary) is RIGHT, recession’s coming (if not here?) and so, rate CUTS …
?
I’m personally, NOT convinced I know how to trade / invest such an environment (and believe others aren’t aware either BUT convince themselves and others they simply KNOW …)
Yesterday’s risk OFF move where BONDS caught a bid … makes sense. But one day in a row NOT a pattern and so we move on TO JPOW today (and tomorrow) and hawk talk COULD very well be good / better for the long bond but perhaps not so much for the bullish steepener.
Time will tell (and so too will Friday’s NFP !!) … here is a snapshot OF USTs as of 705a:
… HEREis what this shop says be behind the price action overnight…
… WHILE YOU SLEPT Treasuries are little changed this morning heading into today's employment data (ADP, JOLTS) and Powell's Humphrey-Hawkins testimony at 10am. DXY is lower (-0.15%) while front WTI futures are higher (+1%). Asian stocks were mixed, EU and UK share markets are mixed-higher while ES futures are showing +0.32% here at 7am. Our overnight US rates flows saw a 4-tick range during Asian hours amid very limited client activity as Bloomberg reported that Japan's banks are preparing for BOJ rate hikes later this month Yahoo. During London's AM hours, our flows were similarly light with volumes during their hours roughly 50% of average. Overnight Treasury volume as a whole was ~60% of average.
… Treasuries still look like they have room to rally further over the near-term (balance of this week, say). Moreover, there are some key trend resistance levels nearby where, if they're taken out, could presage the beginnings of another consequential leg to lower rates. Let's begin with a look at the weekly chart of Treasury 10's and the up-channel (drawn off the weekly opening and closing levels) in place since late last year. Some days ago we talked about how the generally linear nature of this year's sell-off is typical in corrective moves where, in trend moves, the rise in yields often progresses slowly before accelerating later. Anyway, the price pattern since October's rate highs looks like a continuation pattern to us- where a break and close though the uptrend could mark the beginning of a new leg to lower rates. Indeed, the curious or uninitiated may want a look at this description of continuation patterns: Investopedia. Scroll down to "Flags" and you'll see a price pattern quite similar to the pictures we've hand-selected today...
The up-channel in 30yr Treasury rates this year is very well-defined, as we show next. Same idea here: Take out 4.20% (channel uptrend) with a daily close and a trip back below 4.00% is likely to follow in bonds?
… and for some MORE of the news you might be able to use…
NEWSQUAWK: US Market Open: Equities firmer, Dollar lower & JPY bid after BoJ sources, Gilts pressured ahead of UK Budget; Fed Chair Powell due … Bonds softer with Gilts pressured ahead of the UK Budget
… Tuesday's soft service sector survey for February did nudge up the amount of easing futures markets are pricing for 2024. But at 88 basis points they remain close to the most recent Fed projections for some 75bps of cuts this year and the first move is still not fully priced until July…
Finviz (for everything else I might have overlooked …)
Moving from some of the news to some of THE VIEWS you might be able to use… here’s SOME of what Global Wall St is sayin’ …
BARCAP US Economics: Services ISM points to unwinding supply disruptions in February
The ISM services composite fell 0.8pts from January's elevated reading to 52.6, reflecting a normalization of supplier delivery performance following January's disruptions. The prices paid and suppler deliveries indicators unwound January run-ups, consistent with some moderation in core services inflation in February.
CitiFX Techs: US 10s breaks the range (levels noted, interesting, caution ahead of event risk and not much mention of momentum)
US 10y yields have broken the 4.18%-4.33% range that we have seen since mid Feb after closing below the congested 4.17%-4.19% area (200d MA, Jan 19 high, Feb 15 low).
Why it matters: The development suggests we could see a short term move lower in 10y yields with the next major support at 4.03%-4.08% (55w MA, 55d MA).
For an extended move lower, however, we prefer to wait for a weekly close below the 4.17-4.19% range, especially with several major events in the latter half of the week.
Technical indicators:
Daily close below the 4.17-4.19% range (200d MA, Jan 19 high, Feb 15 low, and double bottom neckline).
Charts
OTHER TECHNICAL DEVELOPMENTS WORTH NOTING
US 2y yields: The key support level to watch is 4.48% (Jan high), while resistance is at 4.73%-4.77% (200d MA, Dec high).
US 10y real yields: Testing support at 1.8170% (55d MA). Subsequent support is at 1.7421% (55w MA)…
DBDaily - US service ISM employment lowest since covid (interesting correlation or confusion with causation ahead of NFP…whatever the case, ISM employment may have been THE main narrative driver of price action yesterday)
DB CoTD: One to watch today (actually from yest and why we care ‘bout ISM services prices PAID)
… CoTD shows the correlation with US YoY CPI with a 2-month lag, which has been quite strong since the series started in 1997. So if these higher prints are sustained, that’ll be an important warning sign for inflation this year…
BOTTOM LINE: The ISM services index decreased 0.8pt to 52.6 in February, slightly below consensus expectations for a smaller decline. The composition of the report was mixed, as the business activity and new orders components increased but the employment component fell back into contractionary territory. Factory orders declined 3.6% in January, below expectations for a smaller decline. We left our Q1 GDP tracking estimate unchanged at +2.2% (qoq ar) and our Q1 domestic final sales forecast also unchanged at +2.5% (qoq ar).
Goldilocks: The Pace of Rate Cuts in G10 Soft Landings: Likely Faster in Europe, Slower in the US
The rates outlook in 2024 depends on both the timing of the first and pace of subsequent rate cuts. The timing of the first rate cut is becoming clearer in most DMs, and we now expect that the Fed, ECB, BoE, and BoC all cut for the first time in June. There is less clarity around the pace of rate cuts, however, especially since central bankers have been reluctant to provide guidance too far in advance.
Using our database on historical G10 soft landings, we document four patterns to help benchmark the pace of rate cuts. First, in prior G10 soft landings central banks have generally cut three times (averaging a total of 105bp) in the first six months of a rate cut cycle. Second, these cuts have historically been frontloaded, with DM central banks starting their rate cut cycle with three consecutive cuts in over half of soft landings. Third, the pace of rate cuts tends to be somewhat faster if inflation has fallen below target, and much faster if activity deteriorates or the policy rate is very far away from neutral at the start of the cycle. Fourth, once a rate cut cycle has started, central banks are most likely to accelerate the pace of cuts if the unemployment rate increases.
These patterns support our forecasts that the major DM central banks will cut for at least three consecutive meetings starting in June, continue to cut consecutively in economies like the Euro Area and UK where growth remains below trend, but slow down in economies like the US where activity remains resilient.
DM Central Banks Have on Average Cut Rates 3 Times (by 105bp on Average) in the First Six Months After Starting to Normalize Policy in Historical Soft Landings
USTs bull-flatten as risk appetite wavers; Tech losses drive indices lower; Gilts bull-flatten before UK fiscal statement; Risk-off emanates, JPY and CHF gain; CAD weakens before BoC; 10y CGBs rally on smaller China fiscal deficit guide; DXY at 103.78 (-0.1%); US 10y at 4.153% (-6.1bp).
UST duration rally extends alongside an unexpected drop in the US ISM Services Employment Index into contraction at 48.0 (C: 51.4); the curve bull-flattens amidst a rare waver in risk appetite…
… The prevailing rally in US Treasuries immediately extended to session highs. As risk-off sentiment began to emanate across macro markets, the long-end began to outperform and the curve bull-flattened even though duration moved off session highs. As 5y Treasuries (4.15%, -5.8bp d/d) have now fully retraced the post-January CPI sell-off, key catalysts that will shape the next direction of yields will start with labor market data releases and continue with Fed Chair Powell’s Semi-Annual Monetary Policy Report (Humphrey-Hawkins testimony) to the House Financial Services Committee on Wednesday. There is not a scheduled time for the text of Powell’s prepared remarks to be released.
Sharp declines in Treasury yields offset weaker equity prices and left the US dollar mixed against G10 peers and DXY USD Index (-0.1%) slightly lower. This left other safe havens, JPY and CHF, the preferred risk-off expressions. The risk-sensitive Antipodean currencies finished the session with mild losses…
We estimate total payrolls rose 205k (160k private) in February after two stronger months. Average hourly earnings were probably unchanged after their 0.6% rise in January. The unemployment rate likely stalled at 3.7%, but we expect a rise in participation.
ISM services composite declines as the employment index shrinks, even as orders pick up steam. Lightweight vehicle sales trace back some of January's decline.
February's level is expansionary but still relatively soft historically
UBS: Parallels with the 1990s: From Tipping point to Bubble
Valuations are nearly as high & leadership nearly as narrow but this isn’t a 90s style bubble. Unfortunately we don’t have conditions for a long bull-run either
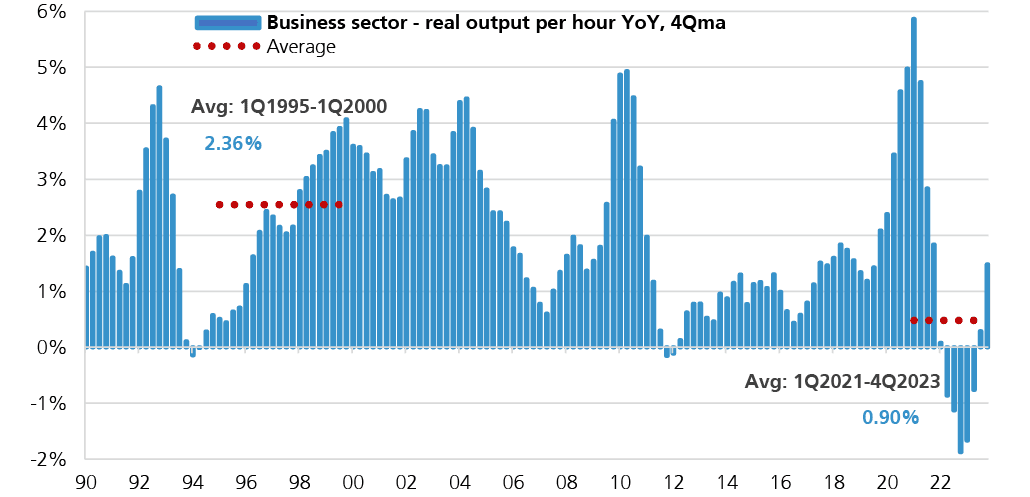
But can the bull run persist?: Data weaker than narrative on productivity
The hope among investors is that an AI boom will provide a major productivity lift, which, in turn will mean strong growth and low inflation (even with high wages). The joint expectations of earnings growth (~12% for coming 12m in S&P500) and inflation (2.59% on the US 5y5y inflation swap, in line with a 10y average) are in line with this Goldilocks/ productivity increase narrative. However, productivity growth so far is significantly lower than it was in the 1990s. This can change, and the micro will know that before the macro, but thus far the narrative is not being backed up by the data at a macro level.
Wells Fargo: ISM Services Signals Less Runway for Patience
Summary The ISM services index slipped to 52.6 in February as prices paid cooled more than five points. For the second time in three months, the employment component was in contraction territory. Attention now shifts to Friday's employment report for confirmation that job growth is indeed cooling.
… And from Global Wall Street inbox TO the WWW,
Apollo: Arguments for a Strong February Employment Report (consistent then with NO hikes in 2024…)
What are the arguments for a strong February employment report?
1) Financial conditions have eased dramatically since the December FOMC meeting, with the S&P 500 at all-time highs and very tight IG and HY spreads. Significant wealth effects and lower borrowing costs are a major tailwind to consumer spending and capex spending, see the first and second charts.
2) Jobless claims remain very low, around 200,000, and the economy remains surprisingly resilient, with households and firms having locked in lower interest rates during Covid, see the third and fourth charts.
3) The fiscal deficit is running at a high 6% of GDP for an expansion, driven by the CHIPS Act, IRA, and Infrastructure Act, and associated positive effects on manufacturing construction, energy investments, and infrastructure investments.
4) The employment-to-population ratio is almost a full percentage point lower than pre-Covid, and immigration continues to be strong, suggesting there is still more upside potential to employment.
Apollo: Office Vacancy Rate Rising (chalk one of for Team Rate CUTS?)
The vacancy rate for US office is approaching 20%, see chart below. And this is in a strong economy with a strong labor market. If the unemployment rate starts rising because of the lagged effects of Fed hikes, the office vacancy rate will increase even more.
Bloomberg: Bitcoin rises from the dead and could keep going (Authers’ OpED and a visual … impact of ETFs)
… But the largest cryptocurrency's latest meteoric rise has a different twist. Bitcoin’s comeback since early 2023 has lifted the overall market value of digital assets to about $2.6 trillion. And in the eight weeks since the US Securities and Exchange Commission approved exchange-traded funds, paving the way for BlackRock Inc. and Fidelity Investments to venture into the space, Bitcoin has shot up by about 50%. Put together, these funds have recorded about $8 billion in net inflows, adding to bullish sentiment.
The question of whether Bitcoin has finally attained the legitimacy that its enthusiasts have long craved now becomes more urgent. Frnt Financial Inc.’s Stephane Ouellette believes that from a top-down standpoint, the entire narrative of why Bitcoin was formed is playing out. He attributes several reasons to its increasing popularity as a safe asset:
From regional banking troubles in the US earlier in the year to an extreme amount of currency crises globally, post-Covid, there’s generally a distrust for establishment organizations and a slow realization that Bitcoin provides some insulation to these forces. Cult-like Bitcoin followers have been accumulating BTC through the period.
Further evidence that Bitcoin’s resurgence owes much to growing demand for safe assets comes from gold.
… For many years I have called Chart #3 the most important chart of monetary conditions that hardly anyone looks at. It measures what I call "money demand." It is calculated by dividing the M2 money supply by the level of nominal GDP. Conceptually, this is similar to calculating how much of one's annual income is held in cash and cash equivalents. For many years (1959-1987) this ratio was remarkably stable, but since then it has become quite volatile. It is now closing in on pre-Covid levels, which likely presages a return to stable money demand—and by extension, in the context of very slow M2 growth—low and stable inflation.
Chart #3
Convexity Maven: "The Cost of Carry" (when creator of THE MOVE speaks / writes usually proves to be worth a click n read)
After discussing what is for lunch, the most common topic on Wall Street trading desks concerns the "carry" of an investment. In layman's terms, what does it cost to hold a position over time.
This is not too relevant to civilian investors since they generally pay cash and do not borrow (margin) to fund a trade. Moreover, civilians rarely "short" an asset. The only time civilians directly touch the concept of "carry" is the decay (theta) of an option.
Nonetheless, there is still the expense of an "opportunity cost"; and it is an important consideration for asset allocation.
Today's Commentary, "The Cost of Carry", explains this concept in a manner that should be accessible to non-professionals.
The current inversion of the Yield Curve makes this topic particularly salient since professional investors tend to have weak hands as they are measured on short-term performance. As such, the negative carry of an inverted Yield Curve is an important consideration.
Of course, this shines a light on the value of newly issued MBS bonds since they are they only "safe bonds" (not Junk) that yield more than the FED Funds rate....they are Positive Carry.
You know I cannot mention listed tickers here, but with a bit of sniffing you can find my NYSE Listed ETF that invests in only newly issued MBS bonds…
Trigger Warning: This Commentary is bond-centric (which can be boring), with a heavy reliance on cash flow math (which is almost always vexing) …
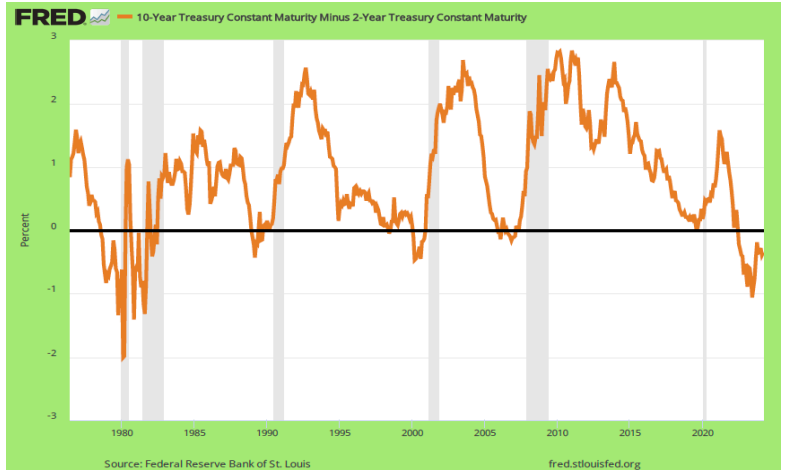
… Surely the most popular “trade” advertised by the punditry is the so-called steepening of the -damasco line- Yield Curve, here offered as the difference between the rate on the UST 10yr vs the UST 2yr. Presently this spread is negative as the 2yr rate is above the 10yr rate - an “inverted” Yield Curve.
Of special note for Yield Curve inversions is that:
) They tend to presage -cinza bar- recessions;
) They tend not to last that long.
Economists and investors are befuddled since the current inversion is the deepest and longest lasting since the early 1980s. This has likely contributed to the rebound in Dupont stock as there is a backlog of orders for body bags to carry away all the speculators who bet on a quick reversal…
… Strangely colored pictures are more fun… MBS are challenging for civilian investors since generally only professionals have experience with them. Most financial institutions will not allow civilians to trade single pool MBS; and even if available, I would advise against their purchase.
This why civilians invest in MBS via Mutual Funds or ETFs; but because they track the (older) MBS Index they are sub-optimal.
Newly issued -sangue line- MBS offer tremendous value with a yield of nearly 100bps more than -videira line- Investment Grade (IG) Credit bonds.
Liberty Street: Expectations and the Final Mile of Disinflation
In the aftermath of the COVID-19 pandemic, the U.S. economy experienced a swift recovery accompanied by a sharp rise in inflation—which has been gradually declining since 2022 without a notable slowdown in the labor market. Nonetheless, inflation remains above the Federal Reserve's 2 percent goal. The authors examine the unemployment-inflation trade-off over the past few years through the lens of a New Keynesian Phillips curve.
…
Sources: Authors’ calculations; Bureau of Labor Statistics; Federal Reserve Bank of Philadelphia; Blue Chip Economic Indicators. Notes: This chart shows the model forecast path for underlying inflation (black line, left panel) and the unemployment rate (black line, right panel) as of 2023:Q4 (delineated by vertical line). The gold line shows the inflation forecast based on a steeper increase in the forecasted unemployment rate; the dark blue line shows the inflation forecast based on a shallower increase in the forecasted unemployment rate. The solid red line in the left panel denotes the long-run trend in inflation. Grey shaded regions denote 68 percent posterior coverage intervals. The pair of short lines in the right panel show unemployment rate forecasts from the Survey of Professional Forecasters (SPF) and the Blue Chip Economic Indicators (BCEI) Survey as of end-2023.
For comparison, the right panel also shows the expected path of the unemployment rate from the Survey of Professional Forecasters (SPF) and the Blue Chip Economic Indicators (BCEI) Survey as of the end of last year. These expected paths are broadly consistent with the model’s unemployment rate forecasts. However, as we learned from the 2022-23 period, the disinflation process will depend critically on expected macroeconomic conditions. Changes in these expectations will then have direct implications for the path for inflation.
… THAT is all for now AND ‘til FRIDAY (reach out if you wish to ask for a refund :) as I’m going to be outta pocket … Off to the day job…


