while WE slept: USTs aggressively UNCH on 'Back to the Future' Day; "Stock Valuations Reasonable"; 10yy "engulfing candlestick"; 60/40 STILL not dead yet
Good morning …
Nov. 5, 1955: Marty jumps in the DeLorean and travels back to this date -- the date Doc first envisioned the flux capacitor -- that Doc Brown had set it to when he was demonstrating how the time machine worked. Marty spends one week in 1955, returning to the future on Nov. 12, 1955 at 10:04 PM
The results have started to trickle in AND …
CNN: Harris and Trump tie in Dixville Notch midnight vote to kick off Election Day
… it’s a tie. We got nuthin … and so it goes. Onwards and upwards to the rest of the polls and electioneering. Perhaps what follows will help distract or serve as a springboard of some ideas as you attempt to plan your election trades and trade your election plans.
On heels of yesterday’s 3yr auction …
ZH: Yields Hit Session High After 3Y Auction Tails Despite Stellar Foreign Demand
… we NOW later on today, get the privilege's of not only registering a vote for the POTUS but also to help fund all funTERtaining initiatives with this afternoons $42bb 10yr auction ..
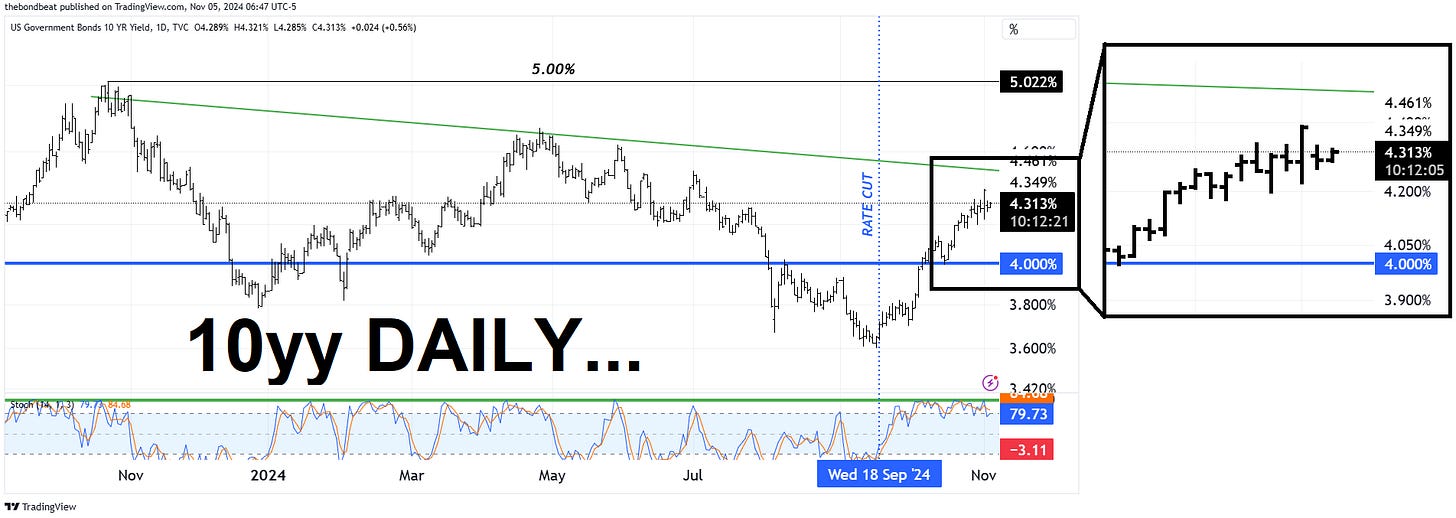
10yy DAILY: seems smack dab in the middle of a range …
… with momentum overSOLD (but that has been the case for awhile) and bond market vol high / rising …
… and for somewhat MORE from someone with a Bloomberg license …
CHARTbeat Fixed Income: Treasuries
… and tomorrows $25bb 30yr … right. Got it. Good luck to those still in ‘the game’!
Here is a snapshot OF USTs as of 650a:
… and for some MORE of the news you might be able to use…
IGMs Press Picks: November 05 2024
NEWSQUAWK: USD is softer & USTs are flat on election day. Crude rises on geopols & constructive Chinese data … USTs are essentially unchanged, Bunds are pressured alongside Gilts; the latter was weighed on by its 2034 auction … USTs are essentially unchanged on US election day, yields are under very modest pressure and still within a few bps of the lows from Monday when the Trump Trade was unwinding after weekend updates. Aside from the election, ISM Services is scheduled and a 10yr Note auction is due. Holding at the 110-12 mark in a slim eight tick range which is entirely within Monday’s 110-07 to 110-21+ band.
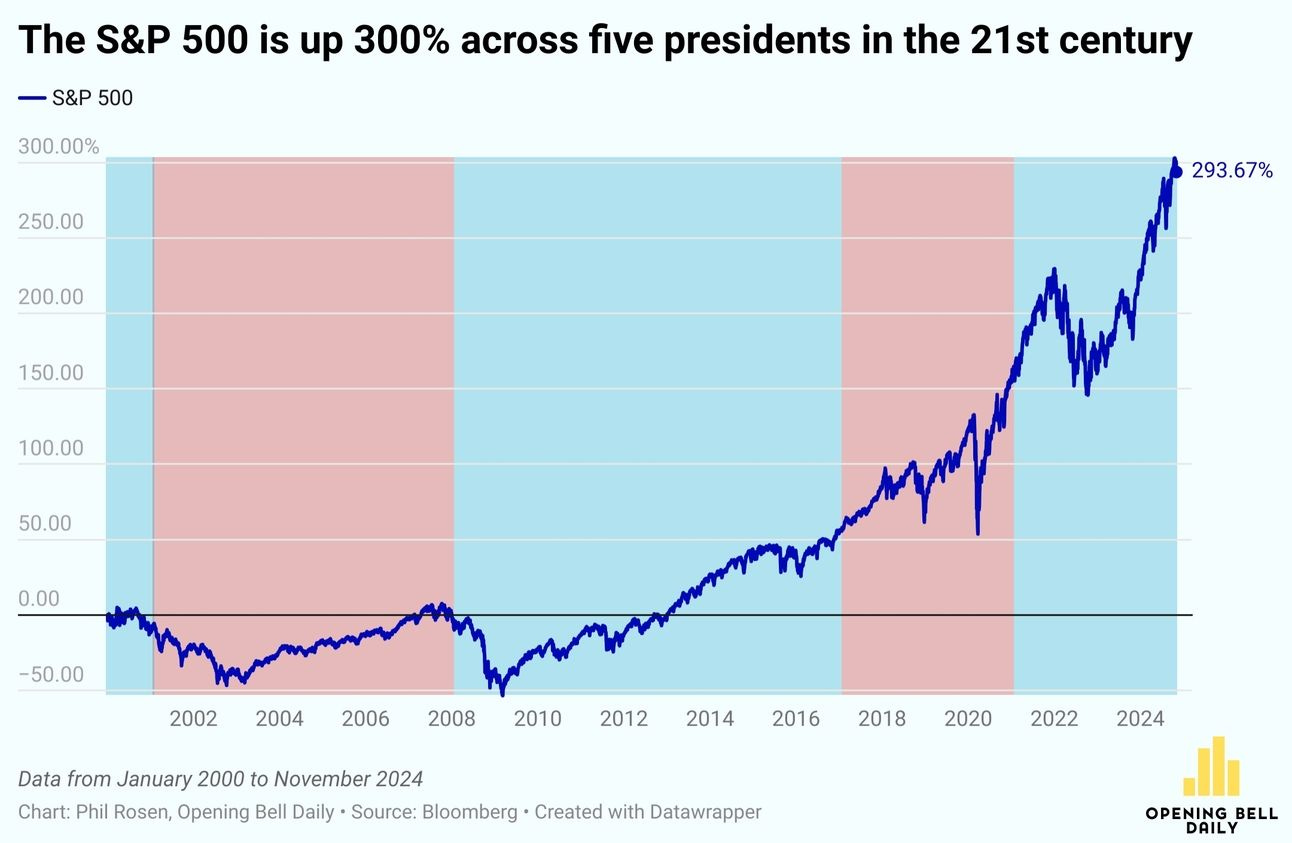
Opening Bell Daily: Stocks love both parties. Don't expect the election to derail the stock market's epic bull-run. Wall Street is overwhelmingly optimistic for the S&P 500 in 2025, no matter who's in the White House.
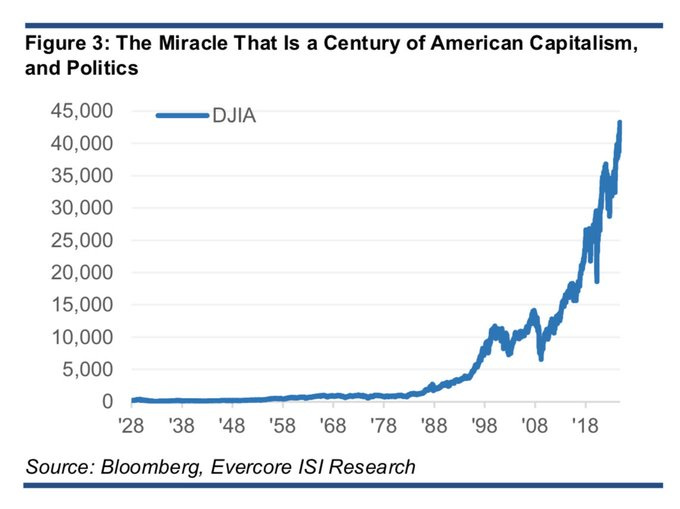
“Since 1928, there have been 17 Presidents, 9 Republican, 8 Democratic; there have been 15 Recessions and the Dow Jones Industrial Average has moved from 200 to 42,000” -ISI
Reuters Morning Bid: World markets firm as America decides
Finviz (for everything else I might have overlooked …)
Moving from some of the news to some of THE VIEWS you might be able to use… here’s SOME of what Global Wall St is sayin’ … seems that there’s quite a bit out there on OIL and middle east and that folks have said what they were gonna say into the evenings election results … still, with hours and hours or miles and miles to go before you sleep (i’m gonna hit the sack EARLY and HOPE to wake up to news of a winner) the inbox over-floweth and so …
ARGUS Market Watch
Daily Spotlight - Monday, November 4, 2024Stock Valuations Reasonable
Our stock/bond asset-allocation model (the Stock-Bond Barometer) is indicating that stocks are the asset class offering the most value at the current market juncture. Our model takes into account real-time levels and forecasts of short-term and long-term government and corporate fixed income yields, inflation, stock prices, GDP, and corporate earnings, among other factors. The output is expressed in terms of standard deviations to the mean, or sigma. The mean reading, going back to 1960, is a modest premium for stocks, of 0.15 sigma, with a standard deviation of 0.97. So stocks normally sell for a slight premium valuation, which they essentially have for the past 30 months. But the current valuation level is a 0.10 sigma discount for stocks, reflecting in large part the recent move lower in long-term interest rates. Other valuation measures also show reasonable multiples for stocks. The current forward P/E ratio for the S&P 500 is approximately 20, within the normal range of 13-24. The current S&P 500 dividend yield of 1.2% is below the historical average of 2.9%, but is also 29% of the 10-year Treasury bond yield, compared to the long-run average of 39% and the all-time low of 18%. Further, the gap between the S&P 500 earnings yield and the benchmark 10-year government bond yield is about 350 basis points, compared to the historical average of 400 and nose-bleed valuation levels of 200. Lastly, the ratio of the S&P 500 price to an ounce of gold is now 2.1, within the historical range of 1-to-3. We expect the results from our stock-bond valuation model to tilt more toward stocks, as interest rates head lower into 2025 and EPS growth picks up. Based in part on the output from our model, our recommended asset-allocation for growth accounts is 70% growth assets and 30% fixed income.BNP: OPEC+ supply increase: More delays expected
In line with our expectations, OPEC+ delayed unwinding its production cuts by another month.
We believe that seasonal softness drives further delays in returning supplies; we anticipate the next opportunity for a net increase in supplies will occur in Q3 2025.
We therefore expect fragile crude balances but no price collapse in 2025/26.
We think OPEC’s main aim is to keep crude stocks below their five-year average, and that internal compliance, rather than a fight for market share with non-OPEC suppliers, is the main risk to its current strategy.
The status of compliance and compensation cuts by laggards will therefore be a key signpost for us to monitor.
CitiFX Techs - 7 techs charts into US elections
We look at levels to watch in 7 charts as we head into US elections: DXY, CNH, MXN, JPY, 10y yields, 2s10s curve, S&P e-minis.
… 5. US 10y yields
An engulfing candlestick on November 1 does not mean much as we head into US elections. Thus far the trend has been higher yields, especially after the break back above the 55w MA. To the topside, we flag 4.47-4.49% as the first resistance level to watch (76.4% Fibonacci and July high). Above this, we see resistance at 4.74% (2024 high).To the downside, keep an eye on 4.18% (200d MA), followed by 3.92% (55d MA). However, we only see really strong support at 3.60% (2024 lows).
Source: Citi, Bloomberg
6. US 2s10s curve
The 2s10s curve has been holding below the 23.59 level (September 2024 high). IF we break above on a weekly basis, we could see a move toward move towards 49.30-50.0 (May 2022 high. This would also be supported by the longer term double bottom formation, which suggests a target around ~57.5.For support, we look to 6.4-6.58 (55d MA, 200w MA), followed by stronger support at -11.02 (October 2023 high).
Source: Citi, Bloomberg
MS: Cross-Asset Valuations: What Will Markets Return? 2025 Edition
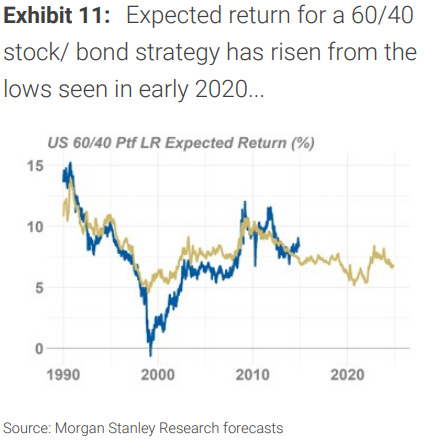
…Long-run expected returns are (mostly) elevated: Relatively high nominal yields support fixed income returns, but lower inflation expectations dampen equities expected returns. Risk premiums have generally become even more compressed compared to last year, but it's the most extreme for US stocks and HY corporates.
Cross-asset relative value – opportunities under the surface: Risk asset valuations may appear stretched, but our valuation framework identifies several pockets of opportunity. European and Japanese equities still screen cheap on both a historical and cross-market basis, while spread products offer compelling risk-adjusted returns.
60/40 equity/bond portfolio – don't dismiss it: The confluence of higher stock-bond correlations, elevated Treasury vol and poor government bond returns has led to fixed income being a less effective diversifier in recent years. However, we think that volatility and correlations normalising, combined with high long-run expected returns, mean that stock/bond portfolios remain a viable diversification strategy.
…A very reasonable question would be whether there's still value in the 60/40 stock/ bond strategy, especially after its poor performance over the last few years. We think the answer is still a resounding yes.
It's true that higher stock-bond correlation, elevated Treasury volatility and poor government bond returns have diminished the effectiveness of fixed income as a portfolio diversifier in recent years. But risk-free bonds being less volatile than stocks by their nature means that there will always be some vol-reduction benefit of having Treasuries in a diversified portfolio. What's more, stock-bond correlations look to be inflecting, and volatility is normalising. And importantly, with bonds' long-run expected returns at attractive extremes, Treasuries are now a source of returns in a diversified portfolio rather than a drag. See Portfolio Theme: 60/40 Equity/Bond Portfolio – Don't Dismiss it…
UBS: Production, deflation, policy, and politics
There is another wave of noise from sentiment polls (today it is the turn of service sector sentiment). French September manufacturing and industrial production data are due (manufacturing sentiment has pointed to a dramatic collapse in production since January 2023. French manufacturing output has risen over the same period).
The UK BRC shop sales data grew less than expected in October. There are suggestions consumers were wary ahead of the budget—but that would suppose consumers care about what politicians say. Rising energy costs are a more visible constrain on consumer spending power. The figures are nominal, so persistent durable goods price deflation will have dragged down the data….
…The US first election results are in. The town of Dixville Notch, New Hampshire cast three votes for US Vice President Harris, and three voted for former US President Trump. The Republican candidate for governor got five votes to the Democrat candidates’ one vote. This means very little of course, but most US political commentary ahead of the other results will mean even less.
Wells Fargo: Middle East Geopolitical Scenario Analysis Update
Summary
More than a year since military conflict erupted in the Middle East, developments have intensified and conditions have shifted in the direction of what we originally envisaged as our “regional conflict” downside scenario. Recent commentary from Iran suggesting a third strike on Israel is under consideration suggests momentum toward de-escalation may be elusive for the time being. With that said, a more forceful push for peace may follow U.S. elections—regardless of who wins the White House—as attention can gravitate toward conflict containment rather than election campaigns. Even as our downside scenario has materialized and the shekel has become a more vulnerable currency, we believe ILS could continue to demonstrate impressive resilience into year-end 2024 and over the course of 2025 …
… And from Global Wall Street inbox TO the WWW …
BESPOKE: 69.6%
The final market close before Election Day 2024 has now come and gone, and since the last Presidential Election Day in 2020, the S&P 500 has risen in price by 69.6%. This has been the best Election Day to Election Day run for the S&P since it gained 100.5% between the 1996 and 2000 Elections.
As shown below, the S&P has actually now posted progressively bigger gains over the last four election cycles (prior election close to the close before the next election).at Peter L BRANDT
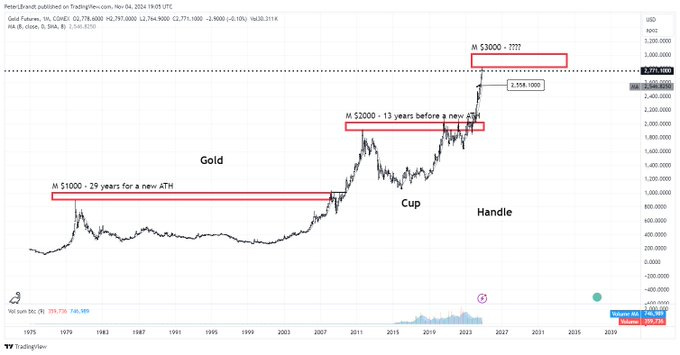
The problem Gold has with Millenials $GTC_F When Gold gets within 10% of a millennial price it's time to be shy When Gold reached $1,000 it was 29 years before a new ATH When Gold reached $2,000 it was 13 years before a new ATH Gold is now in the $3,000 zone Time to be shy????
KIMBLE: Is the Nasdaq 100 Repeating Bearish Topping Pattern?
Large cap technology stocks carry a significant amount of influence on the Nasdaq 100 and broader stock market indices.
Not only do many popular tech stocks carry out-sized market caps that sway the cap weighted indices, but the also factor into market sentiment.
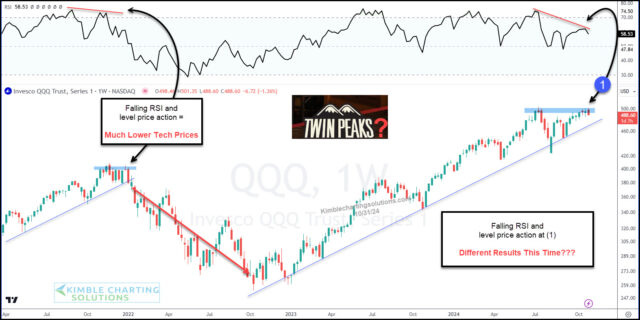
Considering this, today’s “weekly” chart of the Nasdaq 100 shows a few reasons why investors should be cautious near-term and stay tuned.
An eerily similar bearish pattern has emerged in 2024 to one that lead to much lower prices in 2022.
As you can see, we have flat price action along with a falling Relative Strength (RSI) Indicator at (1) just like we had in late 2021/early 2022. And this can be a really bearish combo.
These twin peaks are giving me a case of deja vu. Bulls need to step up soon or lower prices may be in the forecast.
Paulsen Perspectives: Yield Interruptus
For the sixth time, the contemporary bull market is being rudely interrupted by a cranky bond market.… A “yield interruptus” is when the bond market periodically gets a little anxious forcing yields higher until it gets feeling better again about things. Chart 1 demonstrates how frequently and significantly the contemporary Bull market has been subjected to yield-based interruptions. It overlays the S&P 500 Index (blue line, left scale) since the start of this Bull market on October 12, 2022, with the 10-year bond yield (red line shown on an inverted right-side scale). Currently the S&P 500 is reacting to the sixth pause or “Interruptus” during this Bull because the bond market is again having some emotional turmoil. As demonstrated, these pauses vary in length and seriousness. The first three during this Bull market were short-lived and had relatively mild impacts on the stock market. However, the only one in 2023 was massive and lengthy — lasting from May to October resulting in the 10-year bond yield rising from about 3.3% to 5% — and causing the S&P 500 Index to decline by about 10%.
During the first few months of this year, the stock market also endured a yield interruptus when bond yields rose from about 3.8% to 4.7% and the stock market suffered a 5% pullback. Most recently, the 10-year bond yield bottomed in mid-September and has since risen by about 0.8%. The current interruptus facing the S&P 500 Index has thus far been mild, only causing it to decline at its worst by about 3% from recent highs. However, the contemporary bond market emotional meltdown is still in play and could cause a bigger pause yet in this Bull market during the weeks ahead…
Trahan: Macro Monday: An Employment Induced Rate Cut?
Attention will obviously be focused on the U.S. elections this week. It is a light data week, BUT we do have the Fed on deck and a likely 25 basis point rate cut in the offing. Last week was busy on the data front. The ISM Manufacturing Index hit its lowest reading of the cycle while monthly payrolls did the same for October. Importantly, the employment component of the ISM release remained lackluster, pointing to a further slowdown in payrolls in the coming months. Keep an eye out for the ISM Services PMI on Monday and stay tuned next week when more October data will be released.
… I voted over the weekend and while you didn’t ask, I’ll just offer WHO I voted for:
… THAT is all for now. Off to the day job…










Rumor has it once you vote in-person walla! No more political texts! Wouldn't know I voted by mail 3wks ago. Looking forward to no longer seeing Walz Harris & Obama beg for scraps on YT.
Is it the 'miracle' of capitalism & politics....or rather Share Buybacks, Currency Debasement, and Fed/Gov Inflation of currency? Rumor has it w/o Share Buybacks the S&P return this 21st century would be ZERO....
Good gold chart causes this gold bug to ponder....