Are 2yy weekly peaking? Momentum appears oversold, perhaps enough taper/tightening is priced …
For a somewhat MORE sophisticated look and setting of 2yr auction expectations, THIS from a large German bank which shows 2s on the 'fly
… Lets circle back after 1p and this afternoons ‘liquidity event’ where we may learn somewhat more about supply vs demand and ‘the cycle’.
For here and now, though, I’ve little to add to what has already been added so I’m (re)reading and considering this
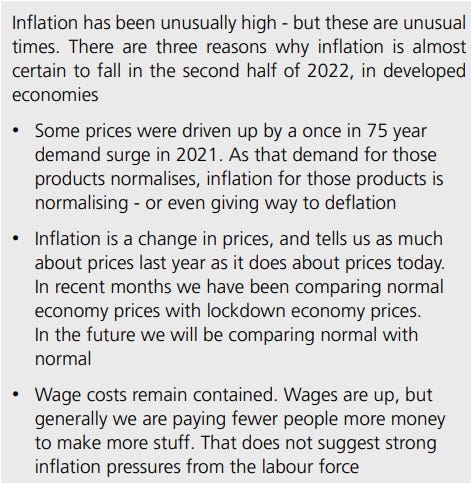
Disaster is a strong but appropriate word that applies perfectly to the state of U.S. monetary policy. Consider the following:
A) The Fed, in reaction to the COVID-19 crisis, dropped the Fed funds rate to 0.25 bps and expanded total reserves of the depository institutions by an average of 63% in 2020 and 2021. This unprecedented growth was achieved by increasing total U.S. Treasury and other securities held outright by $4.5 trillion, equaling 70% of the $6.4 trillion increase in total Treasury securities outstanding. Consequently, the commercial bank deposit component of M2 (that accounts for about 78% of the M2) surged by a record 20.5% over the past two years. This fact reveals the massive coordination of monetary and fiscal policy as government checks were directly funded by monetary largesse. In the face of an unsurpassed breakdown in product delivery systems, this money creation caused a massive imbalance between the demand and supply of goods.
B) The result of the coordinated monetary and fiscal actions was a 5.7% increase in real GDP last year, the best rise since 1984 and a 10.1% rise in nominal GDP, the highest since 1984. With the aggregate demand curve shifting outward and the aggregate supply curve shifting inward, the headline CPI inflation rate jumped from 2.3% in the twelve months ending in December 2019 to 8.5% in the twelve months ending March 2022, the fastest such increase in forty years. Reversing the past monetary and fiscal excess liquidity error will take time and persistence by the Fed…
… the consequences of policies that are tolerant of inflation and government intervention in credit allocation. For McKinnon when inflation is tolerated, it undermines growth and leads to increased calls for government intervention, thereby pushing countries further in the direction of command-and-control economies. The share of the government sector, with its negative multipliers, increases, while the share of the private sector, with its positive multipliers, declines. This reinforces the upward trend of inflation, perpetuating the cycle.
Empirical Evidence Substantial empirical evidence supports the theory. Chart 3, is the scatter diagram of the year over year percent change in real average hourly earnings against the unemployment rate, using monthly data from 1965 through February of this year. As the chart indicates, the result is virtually a flat horizontal line, nothing close to resembling a negatively sloped trade-off curve.
I’d strongly urge you to consider THESE 5pgs (6 if yer counting the disclaimer) before jumping to his conclusion …
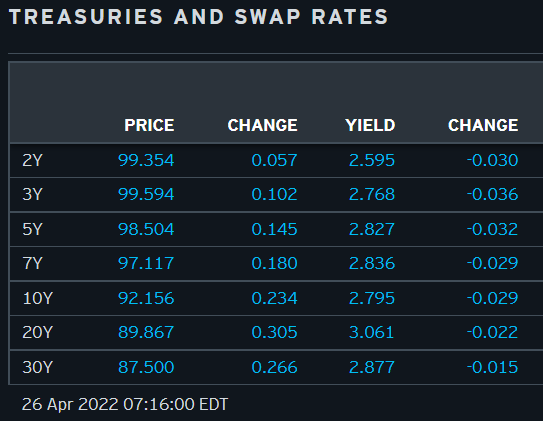
Here is a snapshot OF USTs as of 716a:
… HEREis what this same shop says be behind the price action, you know,
WHILE YOU SLEPT Treasuries are higher with curves leaning steeper ahead of today's data and amid a light news slate (see above). DXY is modestly higher (+0.1%) while front WTI futures are little changed. Asian stocks saw further weakness in Chinese stocks (SHCOMP -1.4%, CSI 300 -0.8%) while others were mixed, EU and UK share markets are modestly higher (SX5E +0.85%) while ES futures are showing -0.4% here at 7am. Our overnight Treasury flows saw 2-way activity (10's and long-end mostly) during Asian hours as prices corrected modestly lower during their hours. There were two block buys(?) in TU futures (3k each) during the Asian morning. Our London desk then noted an intermediate futures-led rally there with better buying seen from credit-linked names (in 10's) and some outright buying in 2's out of Asian real$ ahead of this afternoon's 2-year auction. Overnight Treasury volume was ~105% of average overall.
For yet ANOTHER morning perspective, THIS commentary and excerpt may be of interest,
… Treasuries are reaching a point in the calendar that has historically represented a crossroads of sorts. Specifically, the period between the May refunding auctions and the end of the second quarter tends to be associated with the emergence of a sustainable bid for duration. During this particular episode, the macro horizon also benefits from clarity from the Fed related to next week’s 50 bp rate hike and the balance sheet runoff program. We’ve long maintained that while the Committee has conceded that the supply-driven nature of upward pressure on consumer prices this cycle brings into question the effectiveness of the tools of monetary policy as an offsetting force, monetary policymakers are content to utilize this opportunity to normalize rates and the balance sheet. This conforms with the Fed’s demonstrated urgency to get rates as far off the zero bound as quickly as caution allows…
… and for some MORE of the news you can use » IGMs Press Picks for today (26 April) to help weed thru the noise (some of which can be found over here at Finviz).
And did you hear? TINA Is Dead: Bond Bloodbath Extinguishes Global Negative-Yielding Corporate Debt -ZH
More to the point, Barclays latest Global Macro Thoughts: 'The beatings will continue until morale improves'.
The Fed wants to get to neutral quickly, but not go beyond, and bond markets are saying ‘neutral’ might not be enough. Bonds are unlikely to stabilize in the absence of a further risk-off. We still remain underweight risk.
Chart of the Day: The rebound in global equity indices has in many cases been capped at the falling 200-day average and the subsequent downturn from here now looks to be gaining momentum. For the MSCI AC World Equity Index, we look for not only a retest of the 654 Q1 YTD low, but with the risk seen for a break below here to test the 38.2% retracement of the 2020/2021 uptrend at 615, a further fall of just over 8% from current levels.