Good morning…While I may not have been ‘hard at work’ (here) this weekend, EPBs Eric Basmajian — our modern day Lacy Hunt — was.
Chart of Interest: Growth Slowing Anyway You Cut It On Thursday, the Bureau of Economic Analysis released its first estimate of Q1 real GDP growth. The report showed that the US economy contracted at a 1.4% annualized rate in the first quarter, which immediately surfaced the idea that a recession was a genuine possibility.
Of course, economic growth has been in a declining trend for going on 13 months, but it took a negative GDP number for the economic reality to sink into the conventional wisdom.
It is true that the -1.4% number overstates the magnitude of the economic slowdown, but all the efforts to explain away the contractionary reading miss the more important point.
It is not the level of growth that matters, it is the direction. More specifically, it is the inflection points that cause a paradigm shift in investor psychology and turn bull markets into bear markets.
Whether we look at real GDP growth, real final sales of GDP growth, or core GDP growth, the message is the same: economic growth is declining. The inflection point in the economy happened last summer.
The absolute growth rate is different based on how many items you want to remove from the GDP calculation and what growth rate formula you use, but the takeaway and translation to asset markets are the same.
When economic growth is slowing, recession risk is by definition on the rise, which necessitates an increasingly defensive posture.
Of course, we'll need to keep watching the leading indicators of growth to know where we are heading from here and if another inflection point is on the horizon...
Follow him on TWTR, sign up for his emails and his work. You will not be disappointed.
Here is a snapshot OF USTs as of 715a:
With overnight trading subdued with holidays in UK, here is SOME of the news you can use » IGMs Press Picks for today (02 May) in effort to help weed thru the noise (some of which can be found over here at Finviz).
Here are just a few things from the inbox over the weekend
In the week ahead, the combination of the FOMC meeting, refunding announcement, and April employment report holds the potential to set the trading tone in US rates for the foreseeable future. Following what looked like an inevitable selloff beyond 3% in 10s, the bid that brought yields back from the peaks over the week just passed leaves Treasuries in a far more balanced position from which to incorporate the new information. Despite the first quarter’s economic contraction, Powell’s acknowledgment that a 50 bp hike is on table for Wednesday’s meeting has prepared investors for the first half point hike since May 2000. Along with the upwardly revised target band, the March meeting Minutes also laid the groundwork for the announcement of the start of balance sheet normalization. While there is still some debate on whether lessened Fed reinvestment will begin in May or June, from a macro perspective, the $20 bn difference in Treasury add ons holds negligible consequence, and this biases us to expect that the start of the rundown will get underway at the May refunding auctions.
The timing of the FOMC and Treasury Department’s refunding announcement means that Yellen will not have the required information to adjust issuance plans resulting from what will be likely ultimately be $60 bn less Fed reinvestment per month. While that does not preclude the TBAC details from discussing when coupon sizes will ultimately need to start increasing, further cuts to coupons are broadly anticipated to be revealed on Wednesday morning. From a longer term perspective, the situation on Capitol Hill should also give the Treasury Department a bit more flexibility given that any renewed fiscal push is increasingly unlikely. Even before the midterms and what is assumed to be a change in control in at least one of the chambers of Congress, at this stage the bulk of the stimulus from the fiscal side has played out.
As for what this means for the path of rates over the course of the year, waning influence from the unprecedented amount of fiscal support that has defined the last two years combined with a quickly tightening monetary policy backdrop add to our growing bullishness on the long-end. If GDP fell in Q1 (caveated by trade and inventories’ impact), we struggle to craft a compelling argument for an improving growth outlook given that Powell’s commitment to combat inflation has been unshaken by the specter of a materially decelerated expansion. The stagflation comparison resonates, however the fact that the labor market is still unquestionably strong provides the Fed with ample cover to tighten aggressively. In practical terms, this will keep front-end rates comparatively buoyed while 10- and 30-year yields start to look increasingly appealing.
Indeed, Friday’s price action and the highest employment cost index print on record pushed 10s briefly through 2.93%, but the influence of month end as well as the proximity to the event risk posed by the Fed and NFP left 2.98% the level to beat in terms of renewed selling pressure. We’ve made it this far without a discussion on the state of the labor market simply given the fact that April was almost certainly not the month that showed cracks emerging in hiring. Current consensus for headline NFP is 390k and with an unemployment rate seen at 3.6% - these two factors emphasize the speed of the labor market recovery coming out the pandemic. Potentially holding greater market-moving potential will be any surprise in wages and average hourly earnings that were already running at their fastest yearly pace since the distortions that accompanied the pandemic. While still negative in real terms, strong AHE and increased consumption capacity certainly holds the weight to add to the flattener once the FOMC decision is in hand.
… What does this mean for the Fed’s task of cooling the labor market without a recession? We find that soft landings are more common when private sector financial balances are healthy--including in instances of a major inflation problem. Relatedly, we find that benign increases in the unemployment rate—of 0.35pp or more without a recession—are more common when the private sector is running a surplus.
We see two additional takeaways. First, the surpluses generated today by households and high-yield businesses bolster the outlook for consumer spending and business investment—and will help offset the policy and inflation headwinds. Second, healthy private sector finances imply that the economy may require a greater degree of monetary tightening to slow aggregate demand, other things equal…
BBGs John Authers’ latest contextualizing how bad April was (for stocks … not much better for bonds but…)
MS on GLOBAL RATES:
Overshoots and Ladders With bond yields continuing to climb ladders and equity markets sliding down chutes, the May 3-4 FOMC meeting has taken on greater importance. The US Employment Cost Index has inquiring minds asking about 75bp hikes. Powell's framing of their likelihood will determine the next move in USTs, USD.
… We maintain UST 2s10s and 2s30s flatteners, and add EDU3U6flattener …
MS on M2:
Much Ado About M2 The textbook model of monetary policy indicates that quantitative tightening should lead to a reduction in bank reserves, which should lead to a reduction in the money supply, but the data suggest the link is weak. Instead, financial conditions will be key to watch if QT will affect the economy.
MSs stock - jockey - in - chief writes,
That Escalated Quickly as News Always Follows Stocks As expected, price action turned especially vicious last week as we enter the next phase of the bear market. Negative fundamental data points are also piling up as they tend to follow stocks that have been signaling bad news was coming. 1Q GDP at -1.4% fits the bill and suggests Ice has arrived…
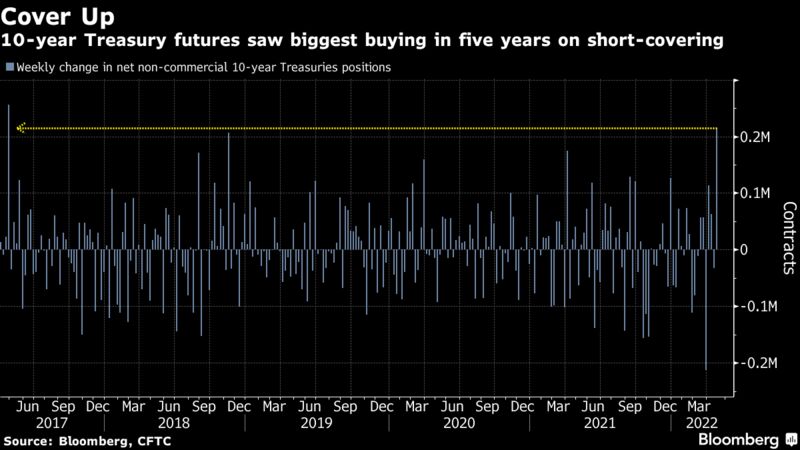
And back TO bonds for a final note / thought / visual from BBG,
… Speculators rushed to cover shorts in 10-year Treasury futures last week, triggering the biggest net purchases in five years. Net-short non-commercial positions shrank by over 200,000 contracts, the biggest upward move since April 2017, according to the latest data from the Commodity Futures Trading Commission -- to last Tuesday. It's not always easy to discern intent from bond futures moves, as they are often used as part of bigger fixed-income trades, but demand for debt seems to have returned. While investors withdrew $27 billion from the largest equities-focused exchange-traded funds in April, they snapped up $6 billion of government bond peers, according to data compiled by Bloomberg. Ten-year Treasury yields plunged to as low as 2.71% on Wednesday on fears over global growth before rebounding above 2.9% on Friday on renewed expectations for aggressive Federal Reserve rate hikes. It's set to be another volatile week with the Fed likely to raise rates by half a percentage point, but the recent Treasuries flows suggest an end to the one-way bearish traffic on bonds that characterized the first few months of the year.
… THAT is all for now. Not sure weekend updates will return to ‘regular’ for a few weeks until AFTER Thing 3 officially becomes a man !! Sorry …. that’s all for now, back off to the day job…


