while WE slept: Rates are BID, vote-A-rama continues; Monthly, quarterly performance; NFP precap & Swiss out with updated (and lowered) 10yr rate guess
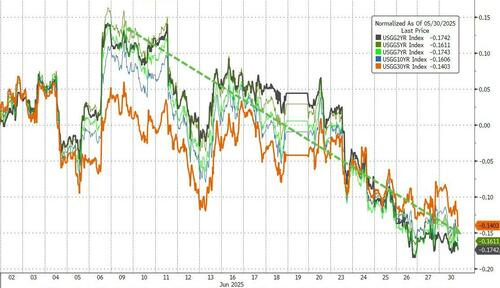
5yy MONTHLY: triangulated support up nearer 3.93% & resistance nearer 3.53% …
… momentum becoming overBOUGHT here on a longer-term basis (and is very much so the case on the DAILY chart) … time at a price (or rate CUTS, I suppose) will help but for now, yields seem content and home on the range …
Happy Canada Day to those neighbors to the North and a very happy Bobby Bonilla Day to … everyone who celebrates!
...From 1992 to 1994, Bonilla was the highest-paid player in the league, earning more than $6 million per year. Since 2011, Bonilla has been paid approximately $1.19 million by the New York Mets each year. The 25 payments come every July 1, which some fans refer to as "Bobby Bonilla Day".[2][3] This was part of a deal made when the Mets released Bonilla before the 2000 season while still owing him $5.9 million for the final year of his contract. The deal expires in 2035, at which point Bonilla will have been paid $29.8 million for a season in which he did not even play for the Mets.[4]
Enjoy the day, Bobby!!
Happy Month and Quarter-end to all on Global Wall celebrating — rebalancing spurred some buying of duration and in concert with comments by Tsy Secretary Bessent, the table was set …
ZH: "Frozen At The Wheel": Bessent Slams Fed For Delay On Rate Decisions In Wide-Ranging Interview
… “As we see inflation come down, I think the whole curve in parallel can shift down,” he said, referencing the Treasury yield curve, a key barometer for economic sentiment…
… 1st half down, 2nd to go and as short weeks always feel longer, JOLTS today, ADP tomorrow and NFP Thursday, I’ve nothing much to add here and now.
The market has gotten very comfortable with rate cuts (maybe, by looks of the belly above, TOO comfortable) and I get it.
I would not fight ‘dipORtunities’ if / when they arise and I’d hopefully recognize them as such. For now, though, a time to reflect on the month and quarter just passed …
ZH: Dollar Crashes To Worst H1 In 52 Years As Stocks Soar To Best Quarter Since Q1 2023 Despite Tariff Tantrum
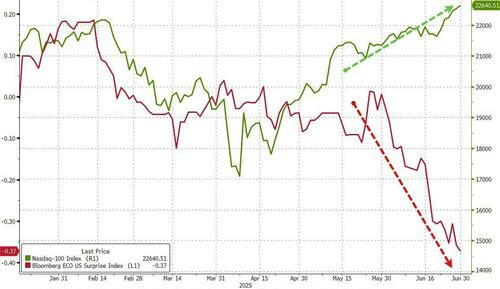
June has seen stocks up, bonds up, crypto up, oil up, and the dollar down bigly as 'uncertainty' tumbled along with US macro data.
…As 'bad news' on the macro-economic front has been good news for stocks...
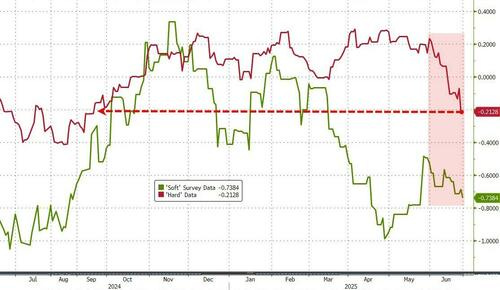
Both 'hard' and 'soft' data plunged in June (dragging them both down on the quarter and YTD)...
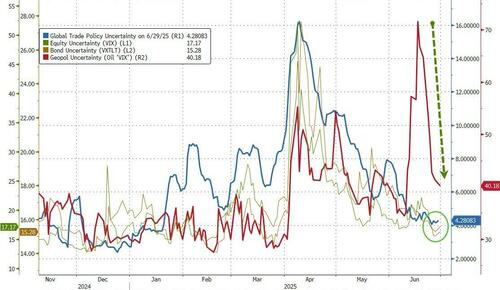
As Uncertainty (global trade policy and geopolitical) have plummeted from crisis highs...
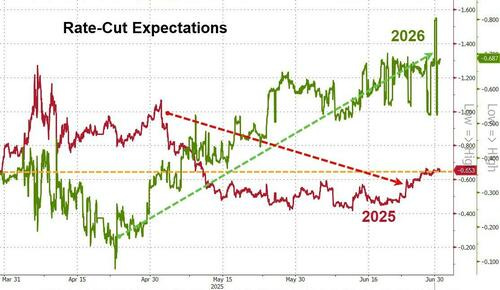
The bad news in macro has also translated into higher rate-cut expectations. However, all the quarter's dovish shift has been concentrated in 2026 with 2025 expectations (of 2-3 cuts) flat on the quarter...
…...but June was (almost) a one-way street bid for Treasuries as a whole (with the whole curve down 14-17bps)...
AND … I’m done. Moving on but first … here is a snapshot OF USTs as of 705a:
… for somewhat MORE of the news you might be able to use … a few more curated links for your dining and dancing pleasure …
FT: US narrows trade focus to secure deals before Donald Trump’s tariff deadline … President’s 90-day pause on reciprocal levies expires on July 9
NEWSQUAWK US Market Open: Markets await Powell and US Senate vote-a-rama which Thune suggests is "getting to the end" … Complex is bid, continuing Monday's gains. Supported by the deteriorating risk tone and digesting/awaiting numerous central bank officials. USTs continue to bull-flatten this morning, extending the bias that was seen on Monday amid quarter-end, soft Chicago PMI data and Bessent dialling back expectations he will term out the debt. USTs are just off best in a 112-00 to 112-12 band, surpassing the 112-05 June high and now eyeing the 112-23 May peak…
While the currency is expected to remain the world's No.1. reserve currency for some time to come given the size of the U.S. economy and the unrivalled depth of its capital markets, sentiment towards the dollar has taken a hit this year against a backdrop of concern about erratic U.S. policy making, trade tensions and worries about Fed independence.
Finviz (for everything else I might have overlooked …)
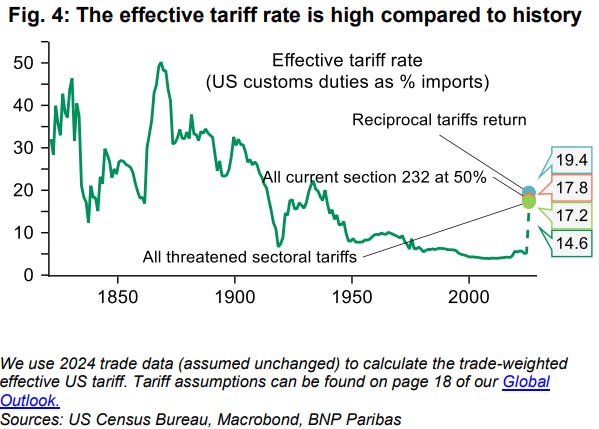
The end of the 90-day US tariff pause on 9 July is unlikely to provide final clarity on American trade policy, but should indicate that the peak of tensions has passed.
We expect that framework agreements will be reached and/or the deadline will be extended to allow for continued negotiations. This would maintain the current 10% ‘baseline’ tariff and sector-specific levies, but avoid reinstating the higher tariff rates from 2 April.
If we are right, the market will be more sensitive to signs of economic impact from tariffs – particularly upcoming US inflation data – than to announcements on trade policy.
Risks are skewed toward a worse outcome. Failure to reach agreements by 9 July could lead to the reimposition of severe ‘reciprocal’ tariffs. However, we think the probability of such an outcome is low and the market will need to see it sustained to react meaningfully.
… If you'd have told me on April 8th, when the S&P 500 was already around -12% in the first week of the quarter, that it would ultimately end up +10.94% at the end of the three months in total return terms, I would have probably asked you if you needed to sit down and have a warm, cold or stiff drink to compose yourself. It's easy to forget now that at the start of the quarter, the S&P 500 had its fifth largest two-day slump since WWII. Also noteworthy in Henry's piece is that the dollar posted its worst H1 performance since 1973. So the impact of events around Liberation Day has still left a big mark even with the big equity bounce.
It was fitting that the quarter ended on a positive note with the S&P 500 (+0.52%) seeing a third consecutive advance and a fresh ATH. Several factors powered the rally forward, but the main ones were growing optimism around US trade deals, along with continuing anticipation that the Fed would be cutting rates by year-end. So that helped spur a notably cross-asset rally, with US HY spreads (-2bps) closing at their tightest since early March, at 290bps, whilst the 10yr Treasury yield also fell -4.9bps to 4.228%…
…Otherwise, there was growing anticipation about Fed rate cuts this year, which helped to propel risk assets higher. This came as the White House once again called on Fed Chair Powell and the FOMC to lower rates over 250bps. Indeed, the amount of cuts priced in by the December meeting moved up +2.5bps on the day to 66.6bps, the most since early May. So that supported a rally in US Treasuries, with the 10yr yield coming down -4.9bps on the day to 4.228%, whilst the 2yr yield fell -2.9bps to 3.72% …
Germany with a monthly / quarterly asset update …
01 July 2025 DB: June and Q2 2025 Performance Review
Q2 was one of the most tumultuous of recent years, although you wouldn’t know it if you just looked at the performance of most assets. The turmoil began after the announcement of reciprocal US tariffs, which saw the S&P 500 post its 5th biggest two-day decline since WWII. But after President Trump delayed the tariffs by 90 days, calm returned to markets, and the S&P 500 ultimately ended the quarter at a new record, rising +10.9% in total return terms. That came as the global economy was broadly resilient, and there were few signs of tariffs impacting inflation yet either. Elsewhere, the main themes were on the geopolitical side, with significant oil price volatility after Israel launched attacks on Iran’s nuclear facilities in June, although a ceasefire was agreed a week-and-a-half later. US fiscal concerns were also a big theme, with long-end Treasury yields moving higher as a result. Otherwise, a broader story was the continued decline in the US Dollar, with the dollar index having now seen its worst H1 performance since 1973…
…Which assets saw the biggest gains in Q2? …Sovereign bonds: In total return terms, it was a good quarter for government bonds, with US Treasuries (+0.8%) …
Germany with a chart …
30 June 2025 DB CoTD: The most inflationary half century in history….
… Today's CoTD shows that since the Bretton Woods system collapsed in 1971, none of the 152 countries we have global data for have managed to keep average annual inflation below 2% …
An updated NFP precap (in support of several rate cuts next year) …
June 30, 2025 MS: Employment Report Preview: A further downshift in hiring
The underlying pace of payrolls is slowing. For June, we think the slowdown remains modest: payrolls 140k, private 120k. With tightened immigration, slower payrolls don’t cause greater slack, and we forecast the UE rate unchanged at 4.2% with LFPR also unchanged. AHE 0.3%.
… and same shop with an idea on the front-end …
June 30, 2025 MS: Buy SFRZ5 as Downside Risks Not Yet Priced Appropriately | US Rates Strategy
Slowing labor and softer inflation data have shifted investor expectations in the direction of multiple rate cuts in 2025. The upcoming May JOLTS and June NFP reports carry more potential to reinforce this trend, rather than halt it. Downside labor risks are still underpriced; Buy SFRZ5 futures.
Key takeaways
Slowing labor and softer inflation data have formed a two-part test that have kept investors engaged in trades that play for the risk of rate cuts this year.
Important labor data (May JOLTS, June NFP) released this week carry potential to further entice investors to trade in the direction of multiple rate cuts.
Downside risks to US labor market data remain underpriced, especially considering the potential for near 0k payroll prints starting as soon as July.
We recommend investors go long SFRZ5 futures contracts as this week's labor market data provide an attractive asymmetry for the near-term policy rate path.
In light of interest, we share notes from last week’s Money Fund Symposium on several key debates as well as emerging macro themes such as stablecoins.
An idea, or a map ahead of / in to jobs report and budget, from Swiss folks … and oh, yeah, a lowered 10yy f’cast / tg … now thinking 4.10% …
30 June 2025 UBS: Global Rates Strategy Rates Map - Longs and steepeners into US jobs and budget
US - Between cycle (jobs) and trend (fiscal); we pick cycle We keep our longs and steepeners into the US jobs reports and budget. UBS economics expects an increase of 100k in nonfarm employment (113k expected) and unemployment at 4.3% in line with consensus. But continuing claims have increased, and we think that rates will shift lower if unemployment surprises to the upside. We lower our target on long 10y US to 4.10% (from 4.20%) with a stop at 4.40% (from 4.60%). The cumulative increase in imported goods prices at major retailers remains relatively modest at 3% since early March, but the baseline from clients in recent conversations is that US consumer inflation is set to rise materially in July and August. There is a group of clients who think the transmission of higher prices could take half a year or even longer.
One of our themes last year was that greater uncertainty about the cycle would force both central bankers and investors to pay more attention to lagging indicators such as inflation, unemployment and wages. The near-term impact of tariffs makes it harder again to separate signal from noise, but job vacancy rates have fallen back to 2019 levels and US10y rates are relatively elevated compared to current levels of inflation and unemployment if the 2010s are your reference point (Figure 4-5). At a US vacancy rate of 4.6%, we are slightly above the level of 4.5% at which governor Waller estimated back in 2022 we could see a significant increase in the unemployment rate. In the US front end, we have held a SOFR Z5Z6 flattener because we want to position for more cuts but also acknowledge that a hump in inflation would delay any Fed easing.
US 5-30s steepeners remains a core conviction for us. These steepeners should work in a world where the Fed is not done easing yet, the impact of tariffs is uncertain and US coupon supply will be ample. The US Senate bill, for example, would likely increase deficits compared to the House version. We remain of the view that the market can digest US coupon issuance in the near-term before the outlook turns more dire in 2027. Tariff revenues are also better than expected, reaching $22bn in May and running at a $266bn annualized pace.
The Fed's SLR proposal and the removal of section 899 in the Senate Bill will help to alleviate investor concerns about fragmentation of the international monetary system. Divergence in regulation across countries was a topic at the 31st UBS reserve manager conference, but the Fed board memo states that the SLR proposal would be consistent with the leverage ratio framework published by the Basel Committee, unlike the 2020 temporary exclusions. During the mid1980s, the Fed and the Bank of England took steps to agree on a common approach to regulation of large internationally active banks via the Basel Committee (see chapter 19 here). The Fed’s SLR proposal would not exclude all cash/Treasury from the leverage ratio, turning a long US 30y vs SOFR into a carry trade, even if the reform could still exclude held-for-trading Treasuries.
…Charts of the week Figure 2: We lower the target on our long US 10y to 4.10%. Job growth slowed to 124k/m in the first 5 months of 2025, compared to 180k/m in 2024. UBS expects a further slow down in the payroll numbers. Meanwhile continuing claims have increased, and we think that rates will shift lower if unemployment rises above the consensus of 4.3%.
Same shop with an update on 90 trade deals in 90 days …
The US administration seems to be retreating from the idea of “90 trade deals in 90 days”. With less than a week to go, they have a half-hearted agreement with the UK and a de-escalation with China, and little else. The idea is that interim agreements will be sought, retaining the 10% tax on US consumers of foreign products. Uncertainty about future product-specific taxes appears to be making it more difficult to do deals.
The US Senate continues to debate plans to keep an unsustainable fiscal deficit. Two Republican senators oppose the budget, and three opponents could stop the bill passing. Markets assume a broadly unchanged deficit, offering no fiscal stimulus, but the redistribution of income implied in the proposals has economic consequences.
US and Japanese business sentiment data are released, and are unlikely to offer much insight in an uncertain world. The US job openings data is unfortunately based on one of the least reliable official surveys in the US—accurate data would be useful, as firms’ hiring intentions amidst policy uncertainty do matter…
… And from the Global Wall Street inbox TO the intertubes, a few curated links …
The daily data for the top 10 airports in the US shows some weakness among foreign arrivals, see the first chart below.
However, the weakness among foreign arrivals is offset by the continued strength in travel for US citizens, and the overall TSA data for the number of passengers traveling on airplanes originating in the US remains remarkably resilient, see the second chart below.
With the trade-weighted dollar down 10% since the beginning of the year, we expect to see an increase in foreign arrivals over the summer and a decline in US citizens traveling abroad.
Note: Airports included are ATL, LAX, DFW, MIA, ORD, DEN, IAD, SFO, MCO, and JFK. Sources: CBP, Apollo Chief Economist
From The Terminal dot com if you’ve ever wondered where would FF be NEXT December …
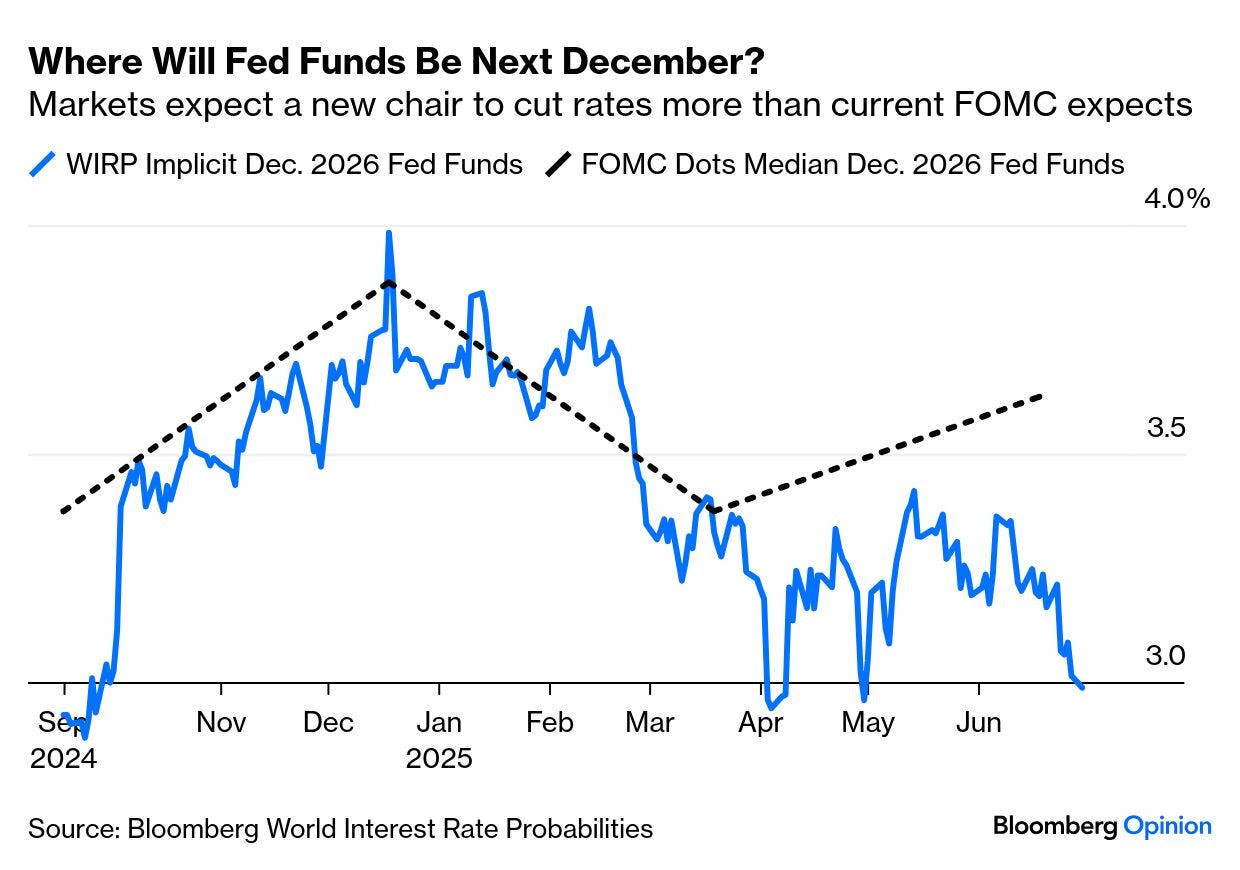
July 1, 2025 at 4:00 AM UTC Bloomberg: If Anyone Needs Independence Day, It's the Fed Lighten up the pressure on Powell. Trump has a point on lower rates, but not 1%. By John Authers
… Bloomberg’s World Interest Rate Probabilities function shows futures predicting fed funds of below 3% by the end of next year, its lowest forecast since last September’s “jumbo cut.” This is a big divergence from the “dot plot” published two weeks ago by the Fed, which had the median FOMC member expecting three cuts fewer:
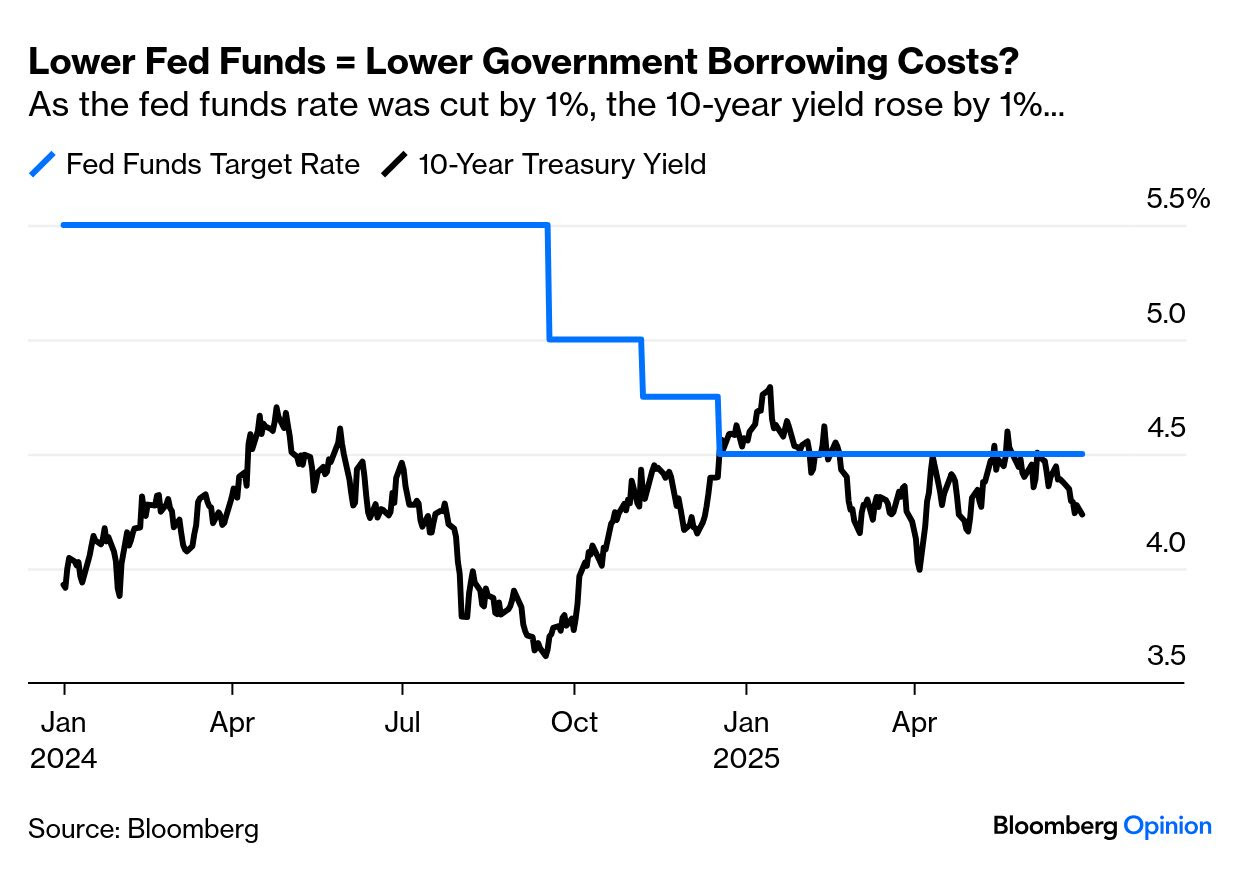
The presidential assertion that a lenient Fed could bring government borrowing costs down to 1% doesn’t hold up to scrutiny. As has been clear for 20 years, central banks can control overnight rates but not 10-year bond yields. In the mid-2000s, Alan Greenspan moaned about the conundrum that the 10-year yield stayed stable as he hiked fed funds again and again — and last year, the 10-year greeted a one percentage point fall in fed funds with a one percentage point rise of its own:
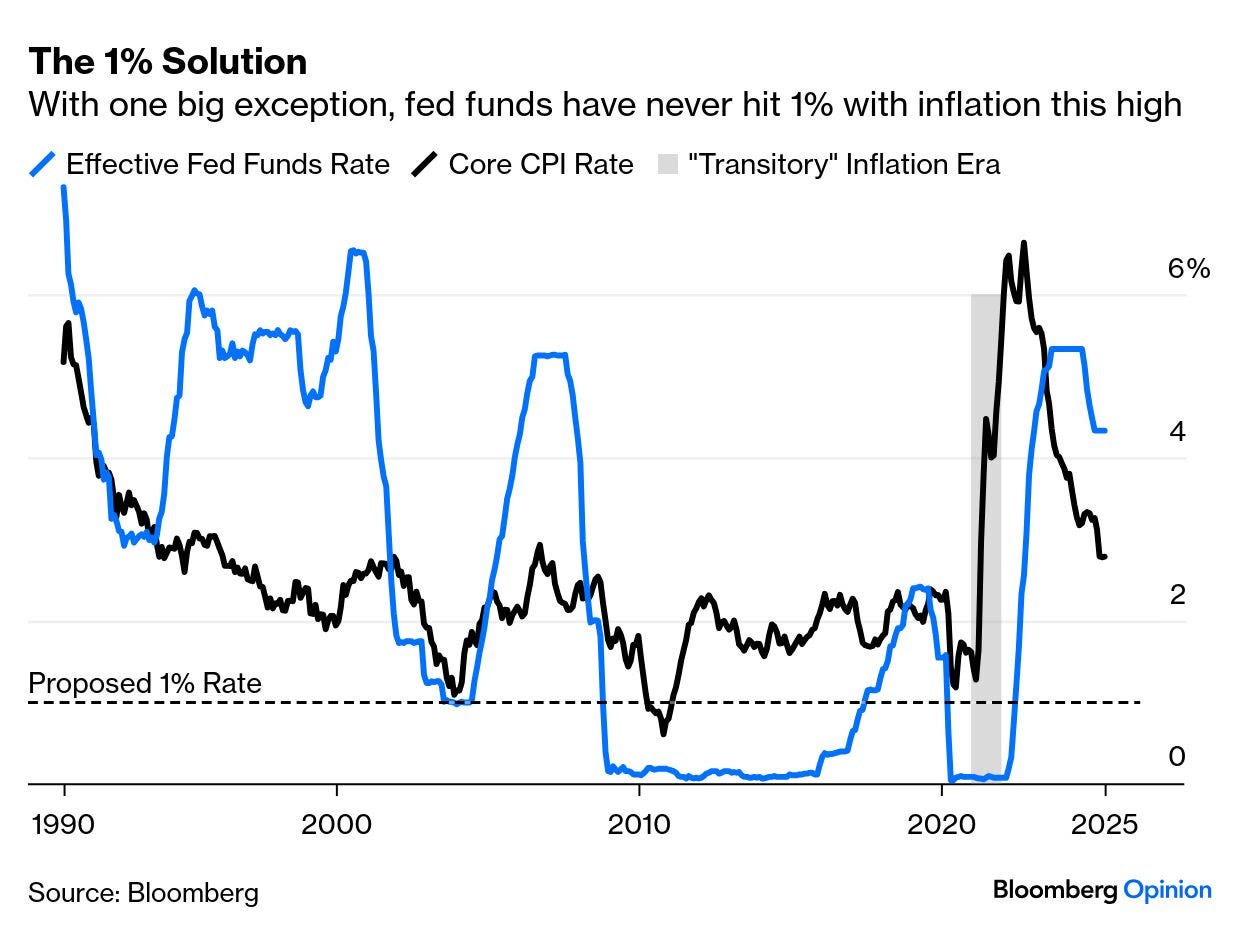
While 1% fed funds probably wouldn’t help the government finance its deficit, history suggests it would stoke inflation. Since 1990, there is only one instance of the rate dropping that low when core inflation is as high as it is now — in 2021, the year of the Powell Fed’s notorious “transitory” mistake. There are good arguments that the rate should be lower than it is now. There is no sensible case that it should be as low as 1%:
Are current rates damaging? There are various ways to measure this, but again it’s hard to justify the Trumpian ire. To determine how tight a rate is, compare it to inflation. That could be done using the latest actual inflation number, or the breakeven bond market prediction for the next year. Or you could look at the 10-year TIPS yield, reflecting the rate borrowers will get above inflation.
Those measures are laid out here. They agree that policy was way too loose in 2021. They also concur that the current real rate is a bit below 2%, which is on the high side but lower than rates on the eve of the Global Financial Crisis — when hindsight suggests they were too low:
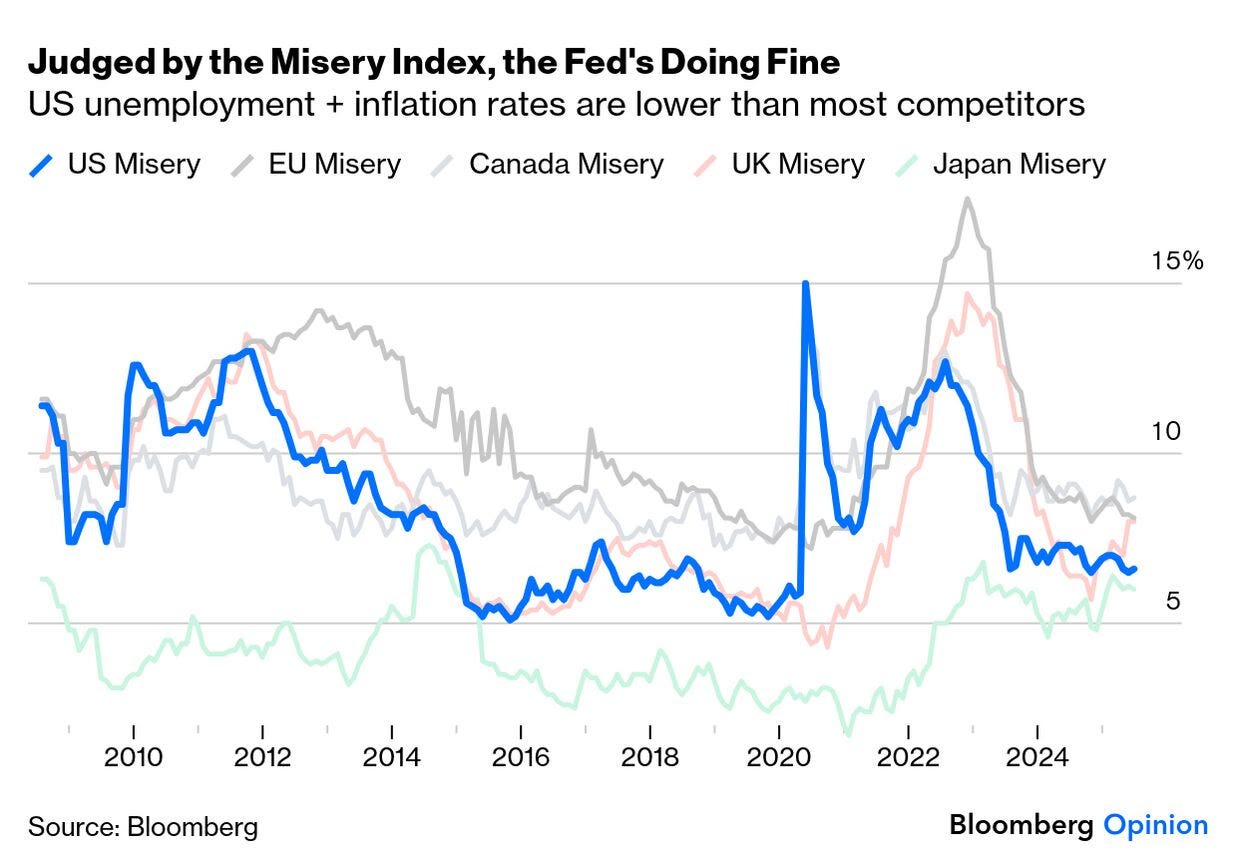
Is this hurting? Since Jimmy Carter, the “misery index” — the unemployment rate plus the inflation rate — has been a standard measure, which handily captures both sides of the Fed’s mandate. The US index is low, and below all major peers except Japan — and even there, the gap is closing. Rates aren’t hurting yet:
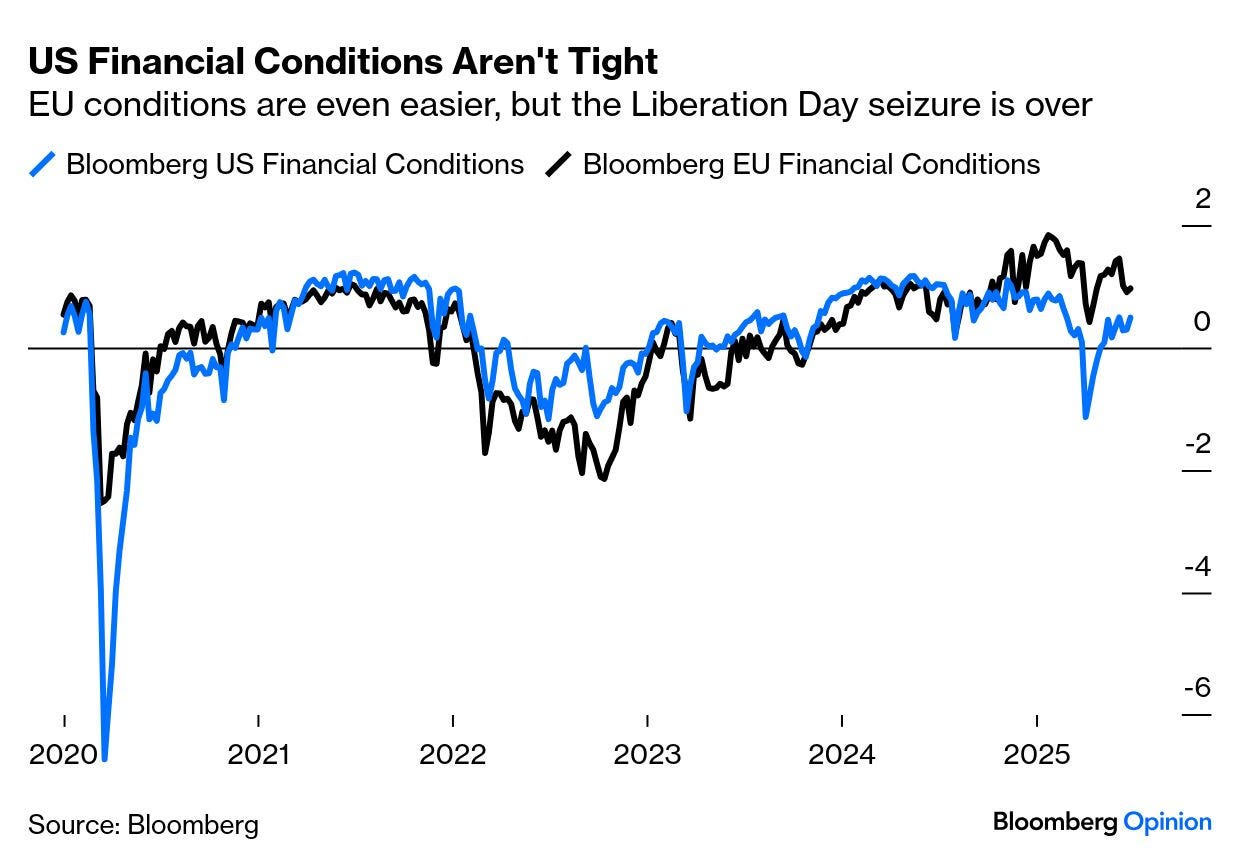
Viewing financial conditions more broadly, including credit spreads and equity valuations to capture how hard it is to raise finance, again suggests that the Fed isn’t tightening the screws. Conditions are slightly easier in the euro zone, which has a weaker economy. Any number above zero suggests conditions are loose:
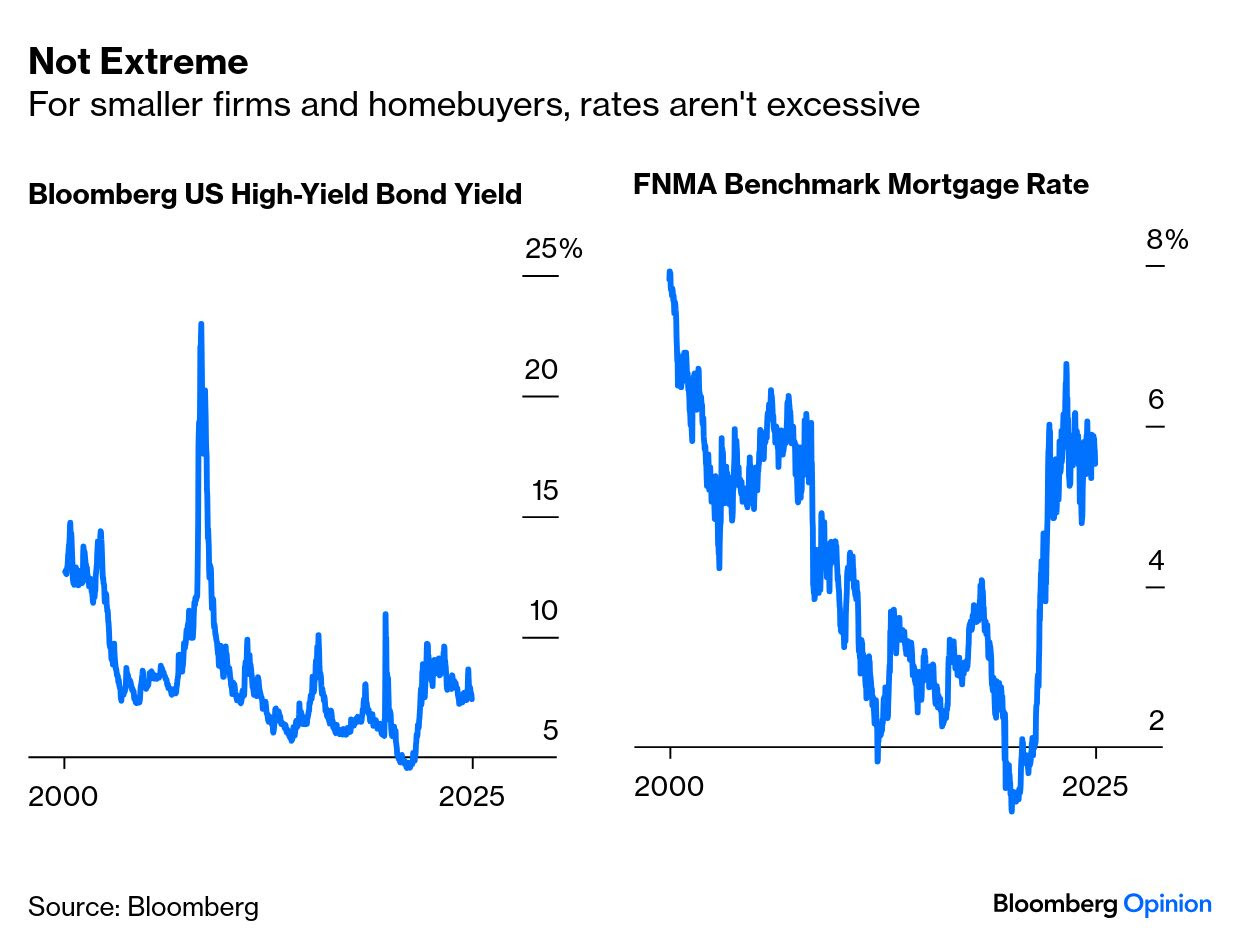
And while rates seem high by recent experience, they are arguably only normalizing after years of artificial stimulus to tide the economy through after the GFC. That is true of mortgage rates, while the yields on junk bonds are unremarkably low even in absolute terms:
A big MACRO week ahead, starting later on today …
June 30, 2025 Macro Monday: A Pivotal Week For Future Rate Cuts
The Fed Will Be Watching This Pivotal Week For Labor Data
With core PCE now at 2.7% for May, inflation seems to be entering a zone that gives the Fed comfort. This means attention is set to quickly shift back to the labor market.
And this week could be a turning point.
First, there are a wave of PMIs coming out this week, each with an employment component that will offer a read on hiring momentum.
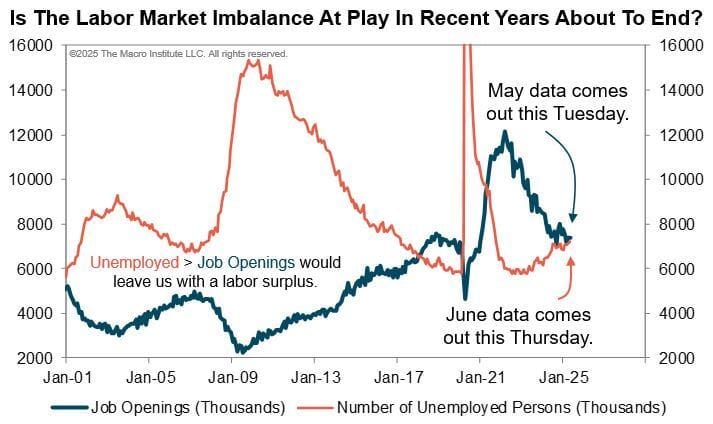
Then on Tuesday we get the JOLTS report. The Job Openings series may confirm a major shift. The U.S. labor market could be back in surplus territory for the first time since 2021. This is what we highlight in this week’s chart.
And in a rare twist, the holiday-shortened week gives us a Thursday double feature. Jobless Claims and Nonfarm Payrolls are both on the same day before the fireworks.
It’s hard to imagine a more consequential stretch of data for the Fed’s September decision. It’s a shortened week, but the market will certainly be paying attention…
😀 The Market’s Optimism May Be Overdone
Economic policy uncertainty is cooling but not gone completely. After hitting record highs in April, uncertainty has eased as trade tensions have largely deescalated.
Reports from the WSJ and Bloomberg confirm U.S.–China negotiations are back on track, with China accelerating rare earth approvals and the U.S. easing tech export restrictions. EU talks look promising. Canada, however, is off the table after its digital tax triggered a hard stop from the White House.
Still, the narrative has clearly shifted. Deadlines are being extended, deals are in motion, and the market is pricing in a resolution by Labor Day. That optimism helped push the S&P 500 to all-time highs on Friday. But trade isn’t the only tailwind.
Falling inflation, now back near 2%, has driven a re-rating in the S&P 500 to 21x forward earnings. Markets love this setup: easing inflation + dovish Fed = higher multiples. However, the fundamentals aren’t as clean.
Earnings growth forecasts are still too high (6%–7% vs. 12% at the start of the year), and margin pressure is bubbling beneath the surface. Despite that, Fed futures show a 91% chance of a September rate cut. Chairman Powell said policy is already restrictive. San Francisco’s Mary Daly echoed that a fall cut looks increasingly likely if tariff-related inflation stays muted.
But here’s the contradiction. The Fed’s own projections now show 2025 Core PCE rising to 3.1%, up from 2.8% in March. May’s Core PCE came in at 2.7%, still above target. So, are rate cuts really a done deal?
Markets seem convinced, but unless the labor market cracks soon, the Fed may be forced to push back against those expectations.
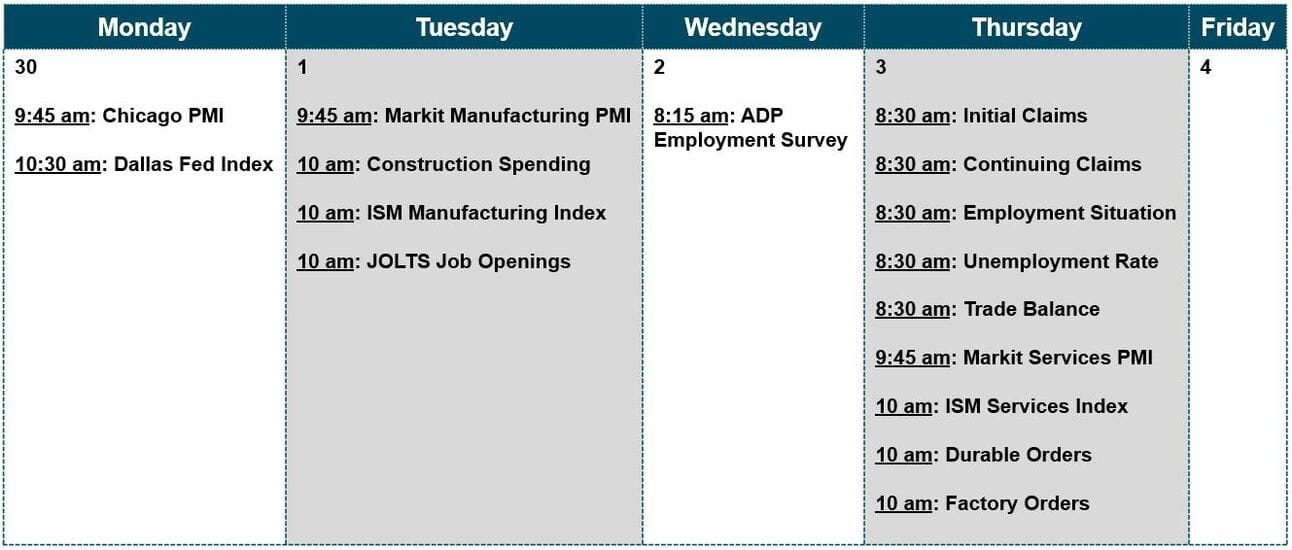
🗽 A Short, But Important Week
Markets are closed Friday for July 4th, but the calendar for the week is stacked.
On Monday, it’s the Chicago and Dallas Fed. Tuesday brings us the ISM Manufacturing Index. Last month’s ISM was 48.5 (contractionary). Regional readings suggest stabilization, but volatility remains.
Prices Paid remains the stat to watch. It hit 70 in May, the highest of the cycle, but still shy of the post-COVID peak of 90. These figures are strong leading indicators for CPI and PCE.
For now, we’re not overreacting to a one month’s rebound, but if June confirms the trend, it could shift the inflation narrative quickly.
💼 All Eyes On The Labor Market
Employment data dominates the week. While labor markets have held strong, cracks are showing. Jobless claims are rising, labor market surprise indices have turned negative, and “jobs easy to get” sentiment is slipping.
On Tuesday, we’ll see S&P Employment Indices plus JOLTS. We’ll watch for softness in openings, quits, and layoff rates. June nonfarm payrolls and the unemployment rate drop on Thursday this month due to the holiday. This is the big one. The Fed expects unemployment to rise from 4.2% to 4.5% by year-end. Surveys suggest we’re already past the trough and headed toward 5%.
If that happens, the Fed may be right to stay dovish, but we’re not there yet.
So, what does the SLR have to do with the bond market? We discussed this recently in our Daily Market Commentary when this rule change was first mentioned. To wit:
“Yes, I believe we will. I have, for a long time, like others, been somewhat concerned about the levels of liquidity in the Treasury market. The amount of Treasuries has grown much faster than the intermediation capacity has grown, and one obvious thing to do is to lower, is to reduce the effective supplementary leverage ratio, the bindingness of it. So that’s something I do expect we will return to and work on with our new colleagues at the other agencies, and get done.” – Fed Chairman, Jerome Powell.
Following the 2020 COVID pandemic, bonds have been in a bear market as yields have risen with inflationary pressures and increased Fed funds rates. That yield rise was also compounded by increased Treasury debt issuance in recent years to fund the massive stimulus and spending programs during the Biden Administration. However, the largest Wall Street banks have been reluctant to step in due to regulatory capital constraints. That reluctance keeps yields higher, particularly at the long end of the curve.
With the SLR reform, banks can deploy excess capital into Treasuries without running afoul of leverage rules. This newfound demand could absorb a meaningful portion of net new issuance. The result? A downward pressure on yields, particularly during market volatility when banks typically pull back. In effect, this reform could smooth Treasury market functioning and reduce the risk of another episode like the September 2019 repo blow-up or the March 2020 liquidity crisis.
Furthermore, another underappreciated impact of the SLR change is its effect on the Total Loss Absorbing Capital (TLAC) and Long-Term Debt (LTD) requirements. These rules, intended to ensure that large banks can be wound down in an orderly fashion, also tie into leverage ratios.
Under the new proposal, TLAC and LTD requirements would be reduced by ~5% and ~16% respectively, freeing up roughly $95 billion in wholesale debt across the five largest U.S. banks. In a rising rate environment, that’s not just regulatory relief—it’s a cost-saving measure. Lower funding costs will flow through to margins, providing yet another reason for banks to reallocate capital into U.S. Treasuries and repo financing.
Portfolio Strategy: What Investors Should Do Now
From a portfolio management perspective, this shift is another reminder that the regulatory structure matters as much as monetary policy.
While most investors focus on the Fed’s interest rate decisions, regulatory plumbing like the SLR plays a significant role in shaping asset flows, risk preferences, and liquidity conditions. With banks now likely to increase Treasury holdings, investors should prepare for downward pressure on long-term yields, especially during risk-off periods when the bid for safety intensifies.
The substantial short position against US Treasury bonds could amplify the downward pressure if an event forces a rapid unwind. As we discussed previously:
“Short positions in TLT, the popular 20-year US Treasury Bond ETF, have spiked to over 130 million shares, up from 107 million last month. TLT has 541 million shares outstanding. Consequently, the short interest has risen from 20% to 24% of the float. Furthermore, TLT’s days to cover ratio (short position/average trading volume) is nearly 3.5 days. As the graph below shows, that is far and away the most prominent short position in the ETF in at least the last 15 years.”
This doesn’t necessarily guarantee a bond rally, but it significantlytilts the risk-reward back in favor of duration, particularly in high-quality fixed income. For equity markets, lower long-term yields are a mixed bag. Lower yields are historically bullish for growth stocks, UNLESS yields are dropping rapidly due to slowing economic momentum or recession risk.
Portfolio construction should always remain anchored in risk management, and the risk of being short Treasury bonds is clearly on the rise.
Bottom Line
The Fed’s proposed SLR reforms are not just regulatory housekeeping—they’re a targeted effort to shore up the financial plumbing of the Treasury and repo markets. The Fed is engineering a quiet but meaningful boost to Treasury demand by giving banks more flexibility to hold safe assets.
For investors, that means better liquidity, lower yields, and perhaps a more stable financial system, as long as the unintended consequences stay in check.
As we’ve said before, the devil is always in the details. And sometimes, those details make all the difference.
AND finally, from ZH above and (in)directly from Truth …


.jpg?itok=dn8iQ21T)
10 yr bond yield.....how low can they go ??