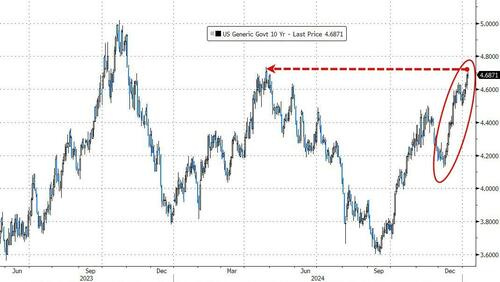
while WE slept: quiet (holiday)mkts; 10s vs 'KEY' level (4.74, 2024 'cheaps'); "Lots of Equity Risk. Not Much Premium" (stocks richest in 22y) & TLT outflows 'tremendous' (but NOT bearish)
Good morning … stocks are closed and bonds close early today. As I continue to get back into the swing of things, I must admit I’ve not had much time to catch up on ‘this stuff’ (a passion is all things macro, RATES related) and dig thoroughly through recent events and calculations / machinations … The day’s math, best I reckon:
ADP + WallE + Long Bonds + FOMC minutes =
ZH: Tech Wrecked As Rate-Rout Wreaks Havoc; Crude & Crypto Crumble
Rates remain front and center into the new year with US 10-year yields now a stunning 60bps higher since early Dec...
Reminder: equities typically struggle when rates rise by 2 standard deviations in a given month, which in today’s terms is ~60bps...
… AND in as far as what all went into the parts of the equation …
ZH: Labor Market Miasma: Jobless Claims Best In 10 Months, ADP Worst In 4 Months
CalculatedRISK: ADP: Private Employment Increased 122,000 in December
… then there’s the Fedspeak from Wall-E (which should be reason ‘nuff to pause …
Bloomberg: Fed’s Waller Supports Further Cuts, Says Inflation Moving Lower
Says pace of cuts depends on inflation progress, labor market
Doesn’t expect tariffs to have significant impact on inflation
… straight from the ‘horses mouth’, HERE is the speech, “Challenges Facing Central Bankers” … Make of it whatever you will. I will say these comments surprised me a bit as he’s normally a hawk and it would appear that he sees / thinks / knows something about fiscal situation and, say … oh, I dunno … HIGHER RATES … which he may not like?
AND this all preceded the long bond auction which, frankly, didn’t suck as it priced at highest yields since ‘07 …
ZH: Rates Jump After 30Y Auction Prices At Highest Yield Since August 2007
… i’ll spare you the field of dreams, build it and they will come, nonsense … onward and upwards TO the FOMC mins …
ZH: FOMC Minutes Show 'Almost All' Fed Members See Higher Inflation Risks, Cite Trump Policies
CalculatedRISK: FOMC Minutes: "The process [of reaching inflation target] could take longer than previously anticipated"
… straight from the ‘horses mouth’, HERE are the minutes in case you are having any trouble sleeping at night … here is a snapshot OF USTs as of 652a:
… for somewhat MORE of the news you might be able to use … a few more curated links for your dining and dancing pleasure …
IGMs Press Picks: January 09 2025
Yield Hunting Daily Note | January 8, 2025 | Trimming Taxables, EIM/VTR Tenders, PCF Cuts
NEWSQUAWK: US Market Open: USD maintains strength ahead of Fed speak, Gilts briefly touched 89.00 but quickly pared … USTs are just about in the green, a light data docket on account of the Federal Holiday for former President Carter though we still get December’s Challenger Layoffs. Currently at the mid-point of a 108-05 to 108-11+ band. Ahead, a slew of Fed speakers dotted throughout the day.
PiQ Overnight News Roundup: Jan 09, 2025
Opening Bell Daily: $28 trillion red flag. The $28 trillion Treasury market is flashing a warning for the economy. Long-term bond yields are hovering near the key psychological level of 5%.
Reuters Morning BID (EZ): Britain at centre of bond market storm
Finviz (for everything else I might have overlooked …)
Moving from some of the news to some of THE VIEWS you might be able to use… here’s some of what Global Wall St is sayin’ …
Here, a UK shop offering some insight on the FOMC minutes …
BARCAP Federal Reserve Commentary: December FOMC minutes: Slower easing amid 'placeholder' assumptions
The minutes of the December FOMC meeting indicate that FOMC participants expressed broad support for proceeding with additional rate cuts, but at a slower pace. They provided also more detail about the implications of “placeholder” assumptions regarding potential upcoming policy changes.
The minutes of the December FOMC meeting show broad support for additional rate cuts this year, provided that inflation continues to moderate.
However, participants favored lowering rates at a slower pace given a variety of factors and risks. This makes a January pause highly likely.
A "number" of participants incorporated "placeholder" assumptions regarding potential upcoming changes to trade, immigration, fiscal and regulatory policies into their projections. Participants commented that potential changes in trade and immigration policy could slow the disinflation process.
The staff projections, which now include "placeholder" assumptions about potential changes to trade, immigration, fiscal and regulatory policies, were revised down for real GDP growth, up slightly for unemployment, and higher for inflation.
We retain our baseline call of two 25bp rate cuts this year, in March and June, pending news about the magnitude and timing of tariffs. With tariffs expected to boost inflation throughout H2 25 and in Q1 26, we expect the committee to remain on hold. We are penciling in 25bp cuts in June and September 2026, when data should make it evident that price pressures are not persisting.
… while this NEXT note MAY be 1st update of the new year …
BARCAP: US Economics: Revisions erase deep small-business slump
We update our aggregate activity estimates for SMEs through Q3 24, folding in recent revisions to income aggregates. Upward revisions to income imply a less-prolonged — and much shallower — downturn for SMEs than before, likely reflecting measurement challenges posed by new business creation.
With indications of an upturn in small business sentiment following last year's election, we update our estimates of aggregate activity in the small- and medium-sized business sector (SMEs) using the methodology we introduced in April 2024. Currently, such estimates are not published in the NIPAs.
Our prior estimates had pointed to a remarkably deep slump in SME activity from Q1 22 through Q1 24, which we inferred by measuring the residual between published estimates for the overall economy and other sectors. Even so, we were skeptical that this deep downturn would undermine the overall expansion, as these struggles had coexisted with robust overall growth.
Our update, which extends through Q3 24, revises the prior trajectory to account for the substantial upward revisions to the income side of the economy from last September's annual NIPA revision. These are disproportionately focused within the nonfinancial noncorporate business (NFNCB) sector of the economy, implying a less prolonged, and much shallower, downturn for SMEs than before. Revisions to activity in the nonfinancial corporate business sector are comparatively modest.
In our view, these revisions are consistent with measures showing an exceptionally strong pace of new business creation since the onset of the pandemic. Such new business activity likely slips through the cracks of the initial estimates, since newly created establishments are not reflected in existing sample-based surveys.
Mechanically, our upward revisions to activity of SMEs also imply upward revisions to hourly productivity, business profits, and markups, as well as downward revisions to unit labor costs. Although productivity remains lackluster compared with pre-pandemic norms for this sector, the updated trajectory is not nearly as dismal as before.
A few weeks ago, we had highlighted the possibility that improved "animal spirits" could drive a resurgence of activity by SMEs in the coming quarters, thereby helping to offset the aggregate supply drag from tighter immigration limits and tariffs. In light of our updated estimates, this potential source of pent-up demand seems more limited.
… and a note from same shop on VOL as we head into DJT 2.0 …
BARCAP: Volatility Outlook 2025
AI/policy/political disruptions will shape volatility, which will likely stay supported/reflate; with the whole world on the same trade, flows, positioning, exuberance key to watch, sharp vol reactions likely; we launch a euphoria barometer, dive deep into dispersion, and lay out key tactical ideas
… Introducing Barclays 'Equity Euphoria Indicator' (EEI): Following the flows, being mindful of stretched positioning and watching out for signs of irrational exuberance will be key. To add to our extensive flow/ positioning repertoire, we therefore launch a new indicator, which uses derivatives flow insights to capture the breadth and strength of 'animal spirits' among stocks. Interestingly, with many drawing parallels between the AI revolution and the 2000s Tech bubble, the EEI is the most stretched since then, warranting some caution.
… and from US vol and euphoria TO China …
BARCAP China: Another year of low prices
We expect China's CPI to stay low for longer, and expect PPI to remain in deflation throughout 2025 following over two years of deflation. We cut our below-consensus 2025 full-year CPI forecast to 0.4%, given absence of DM-like demand-side stimulus, looming tariff hikes and structural headwinds.
… best in show ‘bout FOMC mins …
BMO FOMC Minutes: Trade and Immigration Uncertainty
The FOMC Minutes didn't offer any grand revelations; if nothing else, it was simply the passing of an event risk. On the inflation front: "Participants expected that inflation would continue to move toward 2%, although they noted that recent higher-than-expected readings on inflation, and the effects of potential changes in trade and immigration policy, suggested that the process could take longer than previously anticipated." This is consistent with "a number" of members incorporating tariffs and immigration into the outlook. On the Trump topic: “All participants judged that uncertainty about the scope, timing, and economic effects of potential changes in policies affecting foreign trade and immigration was elevated. Reflecting that uncertainty, participants took varied approaches in accounting for these effects. A number of participants indicated that they incorporated placeholder assumptions to one degree or another into their projections. Other participants indicated that they did not incorporate such assumptions, and a few participants did not indicate whether they incorporated such assumptions.” A rewording of what Powell said at the press conference.
There wasn't much on the balance sheet -- the only details were the dealer survey responses. Specifically, "The average estimate of survey respondents for the timing of the end of balance sheet runoff shifted a bit later, to June 2025. This shift mainly reflected revisions to estimates by respondents who had expected balance sheet runoff to end in the last quarter of 2024 or in early 2025." The longer-end of the Treasury market was cheaper ahead of the release and that price action has been retained, but not extended.
… ahead of the inauguration, how about some TRADES …
BNP US: Presidential inauguration trades
KEY MESSAGES
We think that US 10y real yields have moved too far and like being received at current levels.
The market seems to be underpricing potential tariffs on Canada and we like USDCAD topside.
We see scope for more volatility in US equities and like owning VIX call spreads.
…What’s particularly striking to us is how much US real yields have risen since the election. The increase is not just material in absolute terms, but also has significantly outpaced the move in real yields after the 2016 Red Wave (Figure 1).
Admittedly, much of the real yield move was Fed-driven. In our 2025 Outlook, dated 6 December 2024, we made an out-of-consensus call that the Fed would remain on hold for all of this year. After the more hawkish-than-expected December FOMC meeting, markets have quickly repriced toward our view …
…Rates Trade: Buy 10y TIPS, Entry: 228bp, Target: 190bp, Stop: 240bp, Allocation: USD50,000 DV01
… pausing and interrupting for a KEY LEVEL, visual update, from best in the (TECH) biz … a note with levels to watch on 10s (as well as 2s, 5s and bonds) …
CitiFX Techs: US 10y yields face a key level
US 10y yields have tested the pivotal 4.74% resistance level (2024 high) on Wednesday. This is a very important level to watch as we head into NFP: there are no strong resistances above this point till the 5% handle (2023 high), and momentum suggests a move higher seems more likely at this point. More on this, as well as the rest of the US yield curve in this update.
US 10y yields
Yields have broken past the 4.64% resistance (May 29 high) that we had flagged in a faster-than-expected manner over the past two days. Yields have quickly tested the 4.74% resistance on Wednesday (2024 high).With NFP approaching, we are at a very key level. 4.74% is a pivotal level as there are no strong resistances above that till the 5.00-5.02% range (psychological level, 2023 high). That amounts to another 27bps move higher.
IF we close above 4.74%, it would be a sign that we could see even higher yields. This would be with the backdrop of momentum in yields moving higher - evidenced by weekly slow stochastics moving higher despite being in 'overbought' territory.
On the other side, we see support first at 4.64%, followed by 4.50%.
… with TECHNICAL levels in mind, a fan favorite German analyst on world tour with 2025 outlook putting some FUN back into FUNduhMENTALs, talking about / reCAPPING action yesterday far better than I (or even ZH) could …
DB: Early Morning Reid
…The bond market mini-meltdown continued yesterday even if US yields reversed back earlier declines to be broadly unchanged on the day. However generally long-end yields pushed up to new highs across the globe. The current concerns are that they echo what we saw around September-October 2023, when the S&P 500 experienced a technical correction as the 10yr Treasury briefly moved above 5% intraday. To be fair, we’re still some way from that point, but yesterday saw the 20yr Treasury yield move above 5% intraday for the first time since November 2023, so part of the curve has already briefly breached that milestone. The 30yr yield (+1.8bps) also neared that level, reaching an intraday high of 4.967% before closing at 4.93% following a decent 30yr auction that helped soothe some of the market nerves. This morning in Asia, yields on the 10yr USTs are around -2.5bps lower trading at 4.66% as I type, with similar moves across the rest of the curve.
At the front-end of the curve the market was better bid for the entire day yesterday, meaning we got a fresh curve steepening that pushed the 2s10s yield curve up to 40.2bps. That followed some dovish-leaning comments from Fed Governor Waller, who said “my bottom-line message is that I believe more cuts will be appropriate ”. So that pushed back against speculation that the Fed might not cut at all this year, particularly after the previous day’s spike in the prices paid indicator of the ISM services index. On top of that, Waller also sounded relaxed about the inflationary impact of tariffs, saying “If, as I expect, tariffs do not have a significant or persistent effect on inflation, they are unlikely to affect my view of appropriate monetary policy.”
Later in the session, the FOMC minutes echoed the signal of a hawkish December rate cut. The majority of the FOMC saw the decision as “finely balanced” and some “stated that there was merit” in keeping rates unchanged, as “almost all participants judged that upside risks” to inflation had increased. Looking forward, “many” on the FOMC saw “the need for a careful approach to monetary policy decisions over coming quarters”…
… same shop asking a very poignant question …
DB: Mapping Markets: Can equities turn down without a recession?
Given increasingly high equity valuations, a lot of questions have been asked to the effect of “how long can this last for?” After all, the S&P 500 has posted back-to-back annual returns above 20% for the first time since the 1990s.
Historically, the most common driver of significant losses are recessions. The huge plunges in 2020 and 2008 required an economic contraction, and the bursting of the dot com bubble also happened amidst a slowdown that ended up in a recession in 2001. But right now, there’s no sign of a slowdown, and if anything, several leading indicators are looking increasingly positive.
This got us thinking about whether there could be an equity decline without a recession. The answer is yes, but large selloffs outside a recession are pretty infrequent. Moreover, when they do happen, it’s often like 2022 as investors start to fear and price in a recession, even if one hasn’t happened yet. Another very common theme across these declines are Fed rate hikes beforehand.
So if economic growth stays robust and the Fed don’t start pivoting in a hawkish direction, it’s not implausible that elevated valuations continue for some time. However, if signs of a slowdown emerge or rate hikes move back on the table, the historic precedents show that equities are capable of a notable decline, even without a recession.
… from vol outlook (above) TO hoping for peace and calm because …
ING: Rates Spark: A quieter US can help to calm things for a bit
US Treasuries remain heavy, but it's not all about the US this time. The Euro curve remains under steepening pressure. Without a catalyst to reassess the ECB path, the front-end will remain anchored, while the back-end plays out inflation concerns and supply pressures. Gilt yields also continue to rise sharply. But a quieter US on Thursday might just calm things for a bit
… looking beyond tomorrows NFP to next week where we’ll get CPI (Wed) …
MS US Inflation Monitor: CPI Preview: Core down, headline up
We see core CPI at 0.26% m/m in December (3.3% y/y). Core inflation decelerates on core goods. We see slightly firmer core services as rents rebound. Seasonally adjusted energy inflation accelerates bringing headline above core: 0.37% m/m, 2.9% y/y, NSA Index: 315.619.
… Swiss weighing in …
UBS: Ninety one days
The Federal Reserve meeting minutes reflect the rather chaotic swings of view that occur under Fed Chair Powell. After an emergency rate cut without an emergency in September, the Fed has moved to slowing the pace of rate cuts being “appropriate” in December. The basic idea is unchanged— follow inflation down. Concerns were raised about US President-elect Trump’s trade tax and deportation policies in discussions about inflation, but they were not the central focus of the inflation debate.
China’s December inflation data showed basically stable consumer prices. This reflects normalizing food prices (food being a significant weighting for a country like China). Non-food prices had limited increases, in spite of attempts to encourage domestic consumer spending. Producer prices remain mired in deflation…
UBS: FOMC: Slower but still expect to cut
FOMC minutes and Governor Waller signal intention to keep cutting rates
Governor Waller this morning said he would likely support continuing to lower interest rates in 2025, conditional on progress on inflation, weighed against the risks to the labor market expansion. The December FOMC minutes contained a somewhat similar sentiment, combined with policy was"well positioned to take time to assess the evolving outlook." In other words, they don't think they are lowering rates in January, and at the time had three months to figure out what to do in March.The minutes reveal more concern over inflation stalling than at the preceding two meetings, and some concern over the risks from the incoming administration's potential policies. However, even conditional on these concerns, the general message from both Waller and the minutes was a general intention to continue to move monetary policy toward a more neutral stance over time. While sentiment seems pretty universal to slow the pace from the 100 bps of cuts in the space of the last three meetings, sentiment also seems to suggest the future pace would depend upon the progress made on inflation and the risks to the labor market expansion. In either case, there seemed to be a willingness to cut less or more than currently assumed, depending on how the data shapes up - and that may depend on incoming administration policy outcomes…
… AND for any / all longing for the days of ‘NORMAL’ … well, here you go. Rejoice …
YARDENI: Bond Yields Have Normalized
The backup in bond yields since mid-September did not surprise us. But it has surprised lots of other financial pundits, who are warning that this could be bad news for stocks. It could be, especially if the 10-year US Treasury bond yield revisits last year's high of 5.00%. That would probably bring a buying opportunity in the bond and stock markets. We think that bond yields have normalized. The 10-year yield should range between 4.00% and 5.00%, as it did in the years before the Great Financial Crisis. Consider the following related developments:
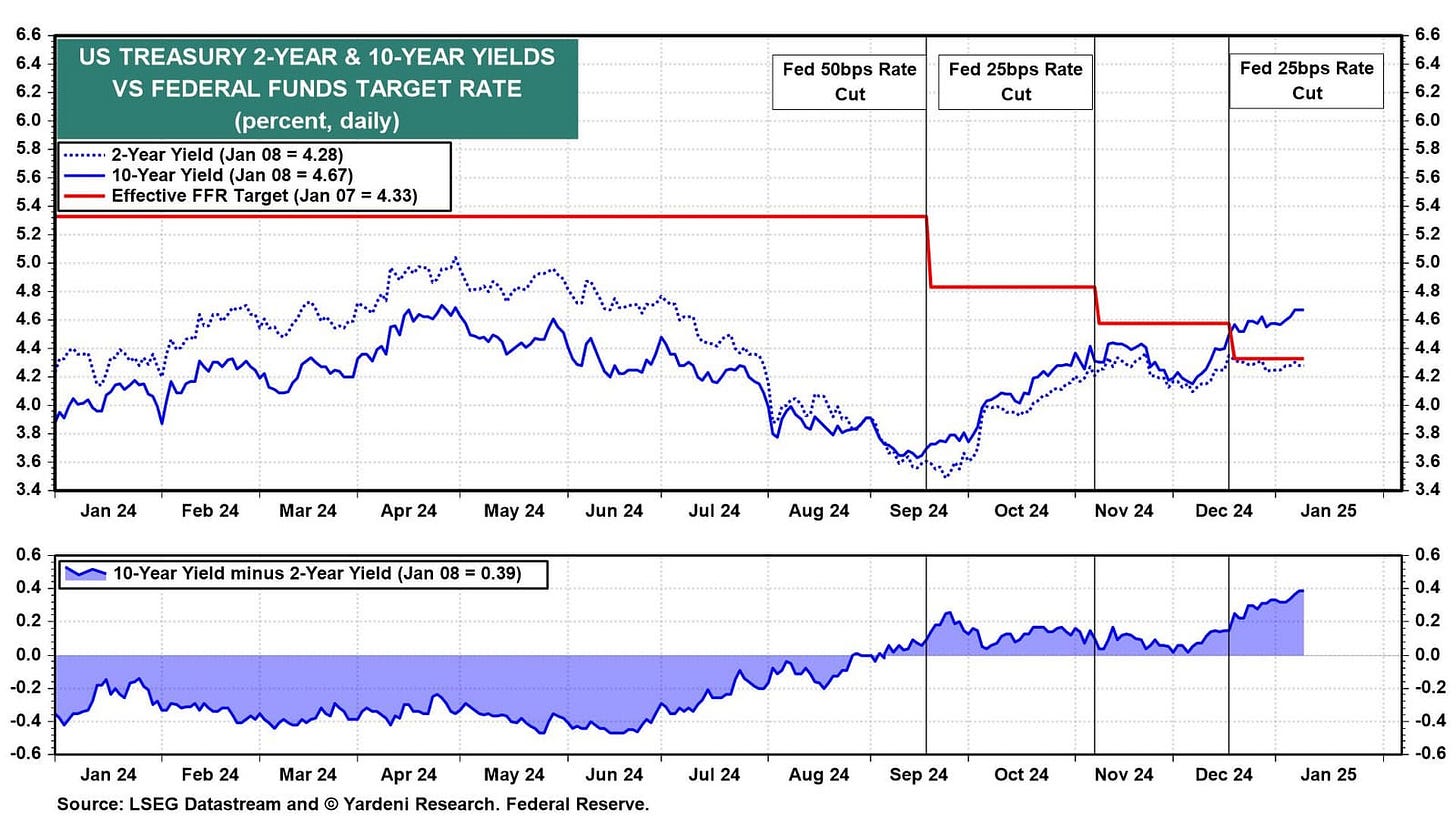
(1) The yield curve. The US Treasury yield curve steepened to a positive 39bps today, its highest reading since May 2022 (chart). The yield curve has "bear steepened," meaning the 10-year yield has risen faster than the 2-year yield.
The yield curve was roughly flat before the Federal Open Market Committee's (FOMC) jumbo 50bps cut on September 18. Despite strong economic data during Q4 and signs of stickier inflation, the Fed cut the federal funds rate (FFR) by additional 25bps on November 7 and again on December 18 for a full 100bps of easing.
That led the Bond Vigilantes to conclude that monetary policy is stimulating an economy that doesn't need to be stimulated. That's been our assessment since August of last year, and we predicted that yields would rise, especially after the Fed eased. The 10-year yield is up 100bps since the day before the Fed started easing on September 18.
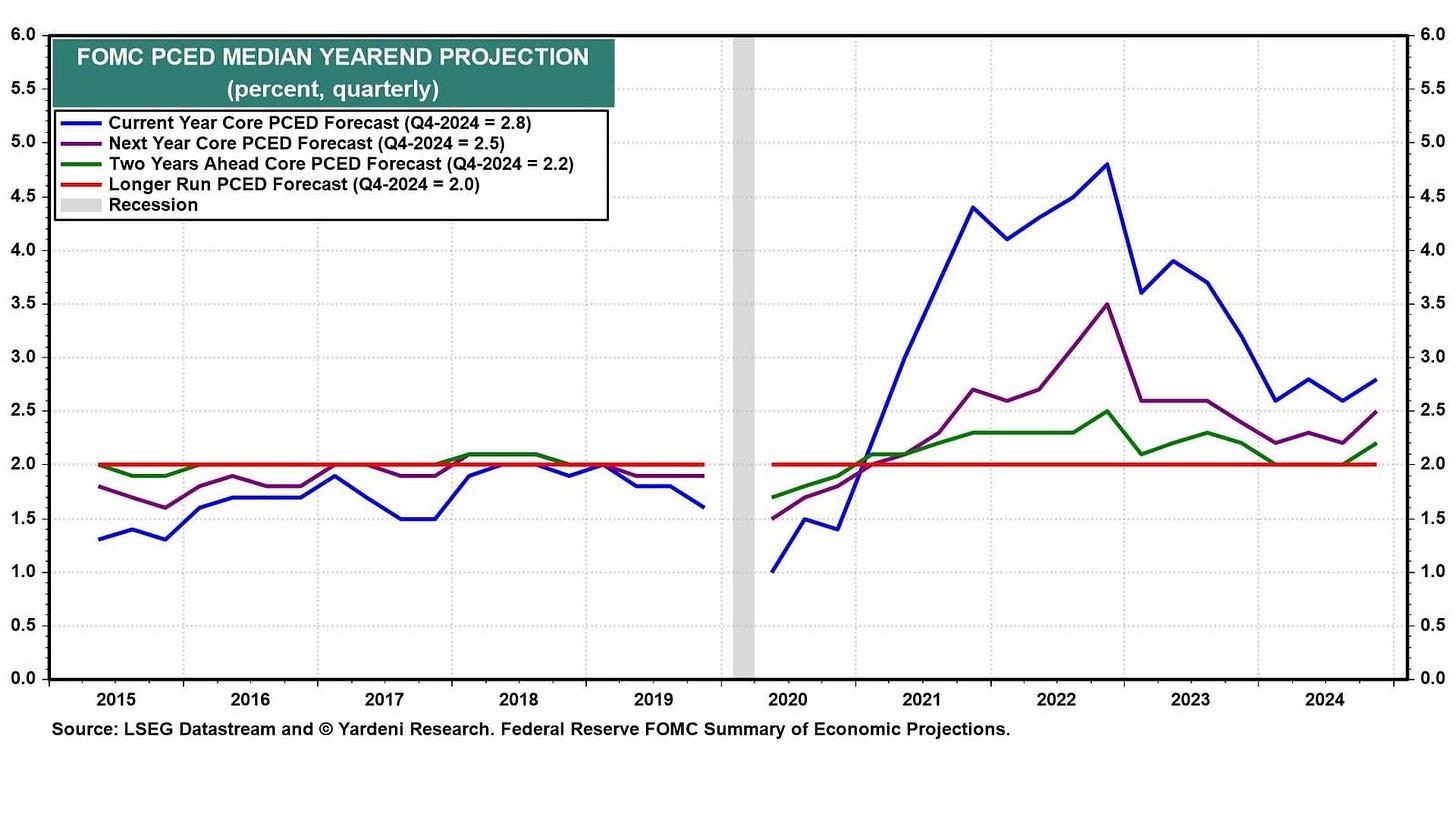
(2) The Fed. At the FOMC's December meeting, the median core PCED inflation projection of the participants rose from 2.2% to 2.5% (chart). Minutes from that meeting, released today, showed participants partly raised their projections due to worries about tariff and deportation policies under Trump 2.0.
Meanwhile, Fed Governor Christopher Waller suggested in comments earlier today that he expects to brush off any price impacts from tariffs: "If, as I expect, tariffs do not have a significant or persistent effect on inflation, they are unlikely to affect my view of appropriate monetary policy." His views and Fed Chair Jerome Powell's have aligned for several months.
FFR futures are pricing in roughly two or three more 25bps rate cuts this year (chart). We don't think the economy needs the extra juice. Additional rate cuts would likely prompt us to increase our odds of a stock market meltup from 25% to 30%…
… And from the Global Wall Street inbox TO the WWW … a few curated links …
First up from a an xpat here in the US with a VIEW … and this one especially good not JUST for the TRUSS ‘ish releated visual of GILTS but also for lengthy diatribe on GREENSPAN, the conundrum and FED MODEL, and visual, showing “Lots of Equity Risk. Not Much Premium. Spiking bond yields make stocks look their most expensive in 22 years…”
Bloomberg: Gilts yields surge, and so do Truss sequel fears
The global move in bonds has already vaporized the UK’s budget buffer, making spending cuts even more likely.… Truss’ ill-fated tax-cutting budget pushed the 10-year gilt spread over Treasuries to its highest in over a decade. To date, this mess is far less extreme, but needs urgent sorting. The UK’s current and capital account deficit leave it vulnerable to foreign investors who might demand higher yields and a cheaper pound before they’re prepared to buy gilts. The country is “dependent on foreigners,” as one investment banker put it. The surge in the 30-year gilt back at levels not seen since before the financial crisis caused by the little-remembered Russian default of 1998 shows that the situation is serious:
…Of Irrational Exuberance and Animal Spirits
When all else fails, and you cannot explain why markets are so high, John Maynard Keynes and Alan Greenspan have some concepts to help. You can blame “animal spirits” (Keynes) or “irrational exuberance (Greenspan). The question is whether they really explain anything.Greenspan gave us the concept of irrational exuberance in December 1996. Bill Clinton had just been reelected and stocks were motoring along. In a speech, Greenspan asked this question:
How do we know when irrational exuberance has unduly escalated asset values, which then become subject to unexpected and prolonged contractions…? And how do we factor that assessment into monetary policy?
Markets took him to mean that he thought asset prices too high and was intending to do something about it. Stocks fell. Three months later, he followed up with a 25 basis-point hike, driving a correction in the S&P 500 of nearly 10%. But rates didn’t move again for 18 months.
To explain why he was worried, we can use another Greenspan concept, the Fed Model. Testifying to Congress, he often compared the earnings yield (inverse of price/earnings) for stocks with bond yields. The higher equity yields reached compared to bonds, the cheaper stocks were. And vice versa. High bond yields made stretched equity valuations harder to justify.
We can illustrate this with the spread of the S&P earnings yield over the 10-year Treasury. When it drops, or falls below zero, stocks are expensive. This simple model (there are more sophisticated versions, but this captures Greenspan’s concept) showed that stocks were way too expensive:
For current purposes, this measure now says that stocks are their most expensive since 2002 — and coincidentally at exactly the level on Dec. 5, 1996, that prompted Greenspan to sound his warning. So concerns about irrational exuberance seem justified. There is also something of a morality tale in what happened in the autumn of 1998. Following the Russian default and the meltdown of the Long-Term Capital Management hedge fund, the spread went positive again — stocks yielded slightly more than bonds. But the corporate credit market was becalmed, and Greenspan decided to cut the fed funds rate between meetings, launching the most extreme phase of the dot-com boom. We cannot know what would have happened if the Fed had held its nerve after LTCM, but with hindsight it looks like a mistake.
Some six decades before Greenspan, Keynes offered the concept of animal spirits in his General Theory. This is how he introduced it:
A large proportion of our positive activities depend on spontaneous optimism rather than on a mathematical expectation… Most, probably, of our decisions to do something positive, can only be taken as a result of animal spirits — of a spontaneous urge to action rather than inaction, and not as the outcome of a weighted average of quantitative benefits multiplied by quantitative probabilities.
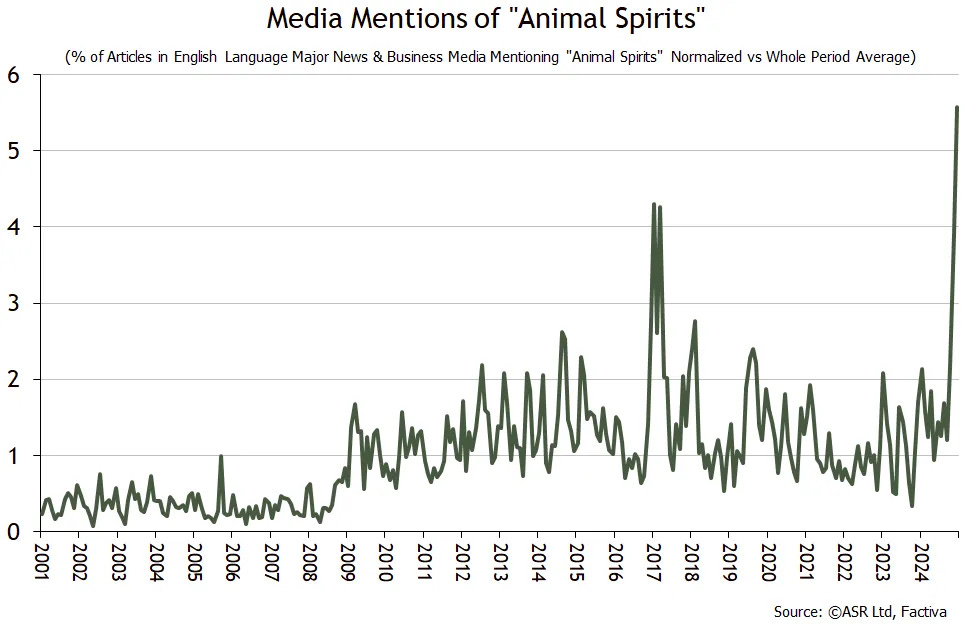
Most of the time, Keynes’ cost-benefit analysis will satisfactorily explain asset price moves, but sometimes it won’t. When we can’t understand what’s going on, we tend to cite “animal spirits” as a get-out clause. Use of the term might therefore offer a guide to when valuations have become inexplicable (or, as Greenspan would have it, irrationally exuberant). Ian Harnett of Absolute Strategy Research tried using it this way, and produced the following search of English language articles on the Factiva database. It goes back to 2001, and shows that invocations of animal spirits ended last year at an extreme:
If there are animal spirits at work, Harnett warns, “then investors might want to be wary of what kind of ‘spirits’ they really are!” In his experience, “they tend to be capricious little things with a nasty bite.”
Personally, I think that this is a pretty incredible/scary chart. To my mind, “animal spirits” tend to be what people rely on to explain things when markets are completely out of whack with underlying fundamentals and valuations can no longer be justified, but people still expect markets to go higher!
I delved further into this with a Bloomberg News Trends search, which counted all references to animal spirits in stories published on the Bloomberg terminal from all sources. This goes back to only 2015, but might have the advantage of being drawn more exclusively from stories aimed at people in finance. Using this version confirms a surge in excitement about animal spirits, but suggests they were causing even more excitement in early 2017, when Trump was taking office the first time:
There was a second surge in the term in January 2018 when the Trump tax cuts went into effect, much against widespread expectation. Their passage had looked unlikely until late in 2017, so this was a positive surprise. Harnett’s Factiva chart also shows a rise in animal spirits after Trump’s first election.
Where does this leave us? It’s hard to explain current asset prices without invoking a woolly concept like animal spirits. Trump is the best explanation for their resurgence. Stocks are riding on potent optimism that Trump 2.0 will be good for the market. Should he disappoint in the months ahead, the exuberance will fade, and we would be left with a stock market that looks way too expensive.
AND for a quick look at CHINA yields …
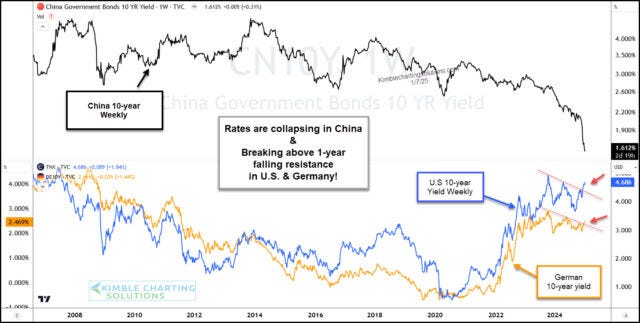
Kimble: Chinese Bond Yields Collapse; U.S., German Yields Breaking Out?
… flation bad …
LPL: Bad Omen for Sticky Inflation
…As discussed in our Outlook 2025: Pragmatic Optimism, we expect stocks to move modestly higher in 2025, while acknowledging reasonable upside and downside scenarios. We cannot rule out the possibility of short-term weakness as sentiment remains stretched and a lot of good news is priced into markets. Upside support could come from economic growth, a supportive Fed, strong corporate profits, and supportive policies from the Trump administration. The most likely downside scenarios involve re-accelerating inflation, higher interest rates, and geopolitical threats that do economic harm. If inflation re-accelerates, equities may need to readjust to what could be a slower and shallower Fed rate-cutting cycle than markets are currently pricing in.
… playing RATES in the ‘sandbox’ …
SANDBOX: The wheels on the bus screaming rates, rates, rates
A huge level of interest for rates come into focus
The deterioration across many corners of the market over the last few weeks has the attention of many.While index prices have proved resilient, the churning under the hood should not be dismissed. Lackluster market breadth (exhibit below) and traditional momentum gauges like MACD have rolled over – leading to some early concern if equities are headed for a long winter.
One culprit for the messy tape are U.S. Treasury yields, whose short-term breakout since December 18 remains a meaningfully bearish headwind for stocks.
Just yesterday, President-elect and hyper market-focused Donald Trump quipped that “interest rates are far too high.”
Treasury yields have been on the move for various reasons, including but not limited to a rising term premium (similar to the first Trump election – see below), higher expected economic growth under a Trump 47 Presidency, and a modest increase in inflation expectations.
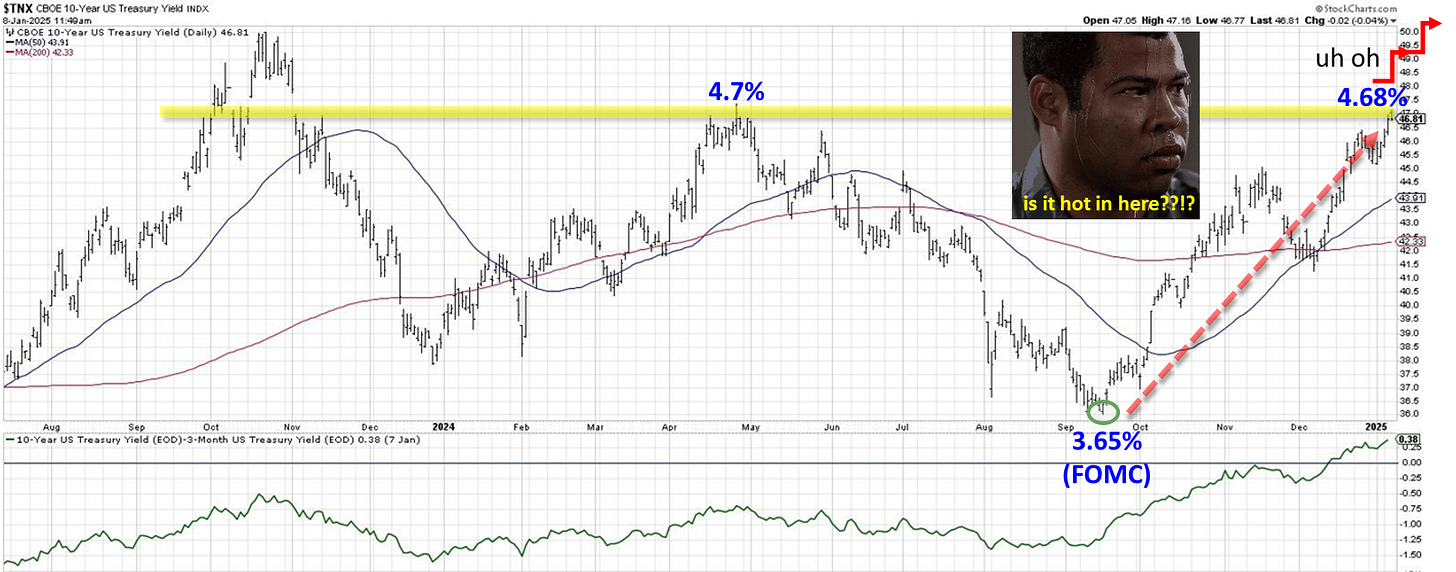
The 10-year yield spent much of the last year oscillating back and forth between 3.8% and 4.6%.
Since the September 18 FOMC meeting – when the first interest rate cut was announced by Fed Chair Jerome Powell – the 10-year Treasury has marched higher from 3.65% to 4.68% in nearly a straight line.
So, while the key policy Fed Funds Rate has been slashed by 1%, the much-followed 10-year market rate has increased by that same amount.
The current level is an important spot which should become a fiery battleground in the days and weeks to come. At ~4.7%, this coincides with the April 2024 peak in yields and must be considered a significant yield-based area of resistance.
If/when this level successfully holds and results in a turn back lower for yields, such a move would likely be greeted positively by risk assets and should result in a much-anticipated January bounce.
On the flip side, if 4.7% is exceeded on the 10-year UST, one could reasonably expect the S&P 500 undercutting ~5830-5860, which is critical support for U.S. equities and of similar importance to the market. In this scenario, bears would be rejoicing around the winter campfire.
Source: StockCharts.com, Ned Davis Research
… finally, with yesterday’s SECULAR TREND visual in mind …
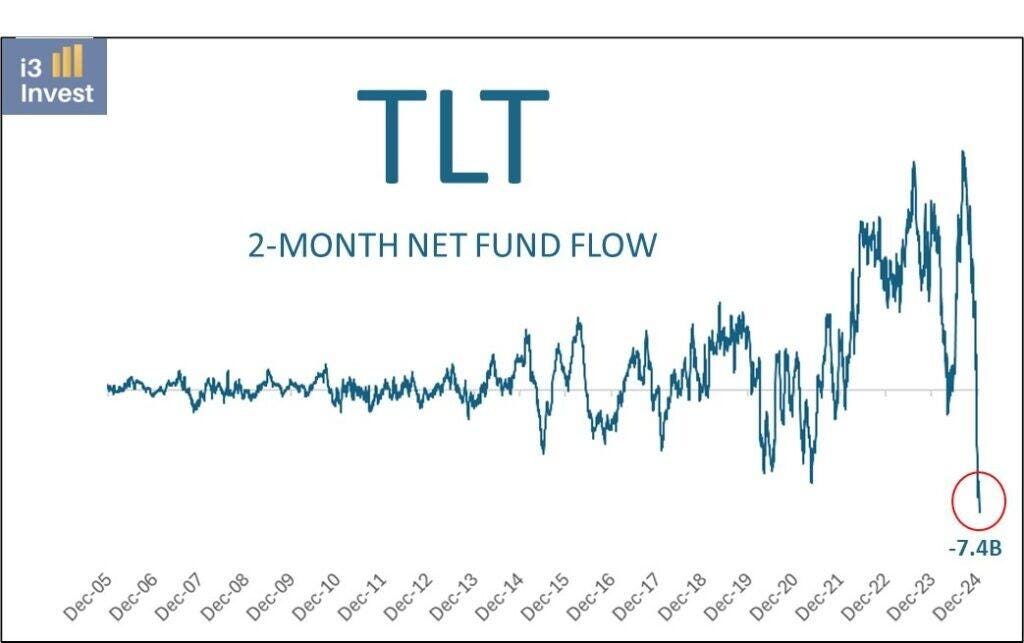
ZH: Outflows From TLT Are Tremendous
… For instance, as the graph of TLT below shows, fund inflows were at record-high levels in 2022 as TLT sold off precipitously.
Bonds are out of favor, and as shown below, TLT, the 20-year U.S. Treasury bond ETF, has seen record outflows.
There are numerous ways to interpret the graph.
Our take is that much of the recent decline is tax-related. With stocks gaining 40+% over the last two years, TLT is one of the few investor holdings that experienced a loss over the period.
Therefore, investors looking to offset tax gains with losses were likely to sell TLT. Some TLT investors were probably selling TLT but buying Treasury bonds to maintain their bond exposure.
Thus, selling the ETF and buying bonds created an arbitrage for dealers. That partially explains the large outflows from the ETF.
However, some were undoubtedly due to selling pressure in bonds and bond ETFs like TLT.
For those interpreting the outflows as bearish, we offer up advice from legendary investor Sir John Templeton:
“The time of maximum pessimism is the best time to buy, and the time of maximum optimism is the best time to sell.”
… THAT is all for now. Off to the day job…


