while WE slept: mkts remain on edge; 10yy WEEKLY (no signal); HIMCO quarterly (tariff excerpt); "Range Trading Continues Until Clarity Arrives" (MS on stocks)
Good morning bond jockeys (and every one else who’s stumbled on this ‘stack for whatever reason) … Things are ALMOST back to normal but with holiday in the EZ and the passing of the pope, things are understandably quiet out there. Jumpin’ in …
Equity futures are down and bond yields are UP (interesting combo) as threats on JPOW persist over the weekend …
Mon, April 21, 2025 at 4:38 AM EDT Bloomberg: US Stock Futures and Dollar Sink on Powell Threats: Markets Wrap (Bloomberg) -- US stock futures and the dollar weakened sharply as traders reacted to the possibility that President Donald Trump will try to remove Federal Reserve Chairman Jerome Powell…
… which leads to the natural question …
Mon, April 21, 2025 at 4:00 AM EDT Yahoo: Who could replace Jay Powell as Fed chair — whenever it happens
…The favorite, according to people close to the administration, is former Fed governor Kevin Warsh, who served as former Fed Chair Ben Bernanke’s liaison to Wall Street during the chaos of the 2008 financial crisis…
… and as NO debates will be settled this early I’ll move along and note stocks AND bonds are both lower (glimpse of what may be to come, IF …) and lean back to look at yields …
10yy WEEKLY: TLINEs etched in are a GUIDE, not hard and fast rules …
… we’re triangulating in / around what appears to be levels with both 2020 UPtrend (bearish) and end 2023 DOWNtrend (BULLISH) … fitting, too, (weekly)momentum offering NO signal and so, at times like these, it may be best simply to acknowledge price action may be as much NOISE as signal, offering one to see whatever one may want / need in defence of position to compliance / risk managers … either look elsewhere (shorter-term / longer-term charts) for inspiration and / or simply be patient …
… on THAT note … if you hadn’t already seen / heard / READ the news, latest (and yes, STILL BULLISH BONDS) quarterly thoughts from Dr. Lacy Hunt arrived and were passed along HERE. It’s only a few pages (directly, HERE) and are, as always, worth the wait, in gold … While I excerpted some (and bullish bond) conclusion over the weekend, I thought might be a good place to start the week ahead, devoid of economic funDUHmentals (and so, the bond market ripe to be pushed around by technicals, other markets and … HEADLINES) …
…Tariffs Unintended Consequences The philosopher George Santayana's words, "Those who forget the lessons of history are doomed to repeat it," ring true in current economic policy. The currency devaluations by the Dutch East Indies and Australia in the late 1920s, which quickly led to multiple country currency devaluations, the Smoot-Hawley Tariff Act of 1930, and devaluations of the British pound and U.S. dollar, respectively, in 1930 and 1933, serve as stark reminders of the unintended consequences of economic decisions. Similar "beggar thy neighbor" (BTN) practices occurred until the start of World War II, contributing to deflation and severely suppressing world economic activity. Basic economic theory was at work. Except for energy products, the demand for nearly all internationally traded goods is price elastic. This price elasticity means, in percentage terms, the fall in demand will be far greater than the associated tariff-caused price increase, resulting in a drop in total revenue.
The world is witnessing a unique high-stakes game where every player wins or loses big. The winning prize moves the world in the direction of Ricardo's law of comparative advantage and Adam Smith's "invisible hand" and away from mercantilist practices which include undervalued currencies, subsidies, non-enforceability of contracts, use of child and convict labor, nonpayment of fees for patents and copyrights, and drug trafficking. With less mercantilist practices, a more efficient allocation of resources would reduce inflation, improve the standard of living, and start rolling back the debt trap. Continuing the present situation of mercantilist practices characterized by tariffs and retaliatory actions will mean a loss for all. In the 1920s-30s, as today, many foreign countries suffer from below-trend growth rates and cannot accept tariff hikes. Not surprisingly, retaliations against U.S. tariffs have started.
Capital Flows A country's positive capital account is the inverse of a negative current account. If tariffs reduce the current account deficit, fewer foreign funds would be available for fixed investment and the U.S. budget deficit. Thus, tariffs could initiate a downturn in the international trade and capital flow sectors, significantly weakening economic growth…
… As always, a good time to pause and ask … who ya gonna believe? Me, or yer very own lyin’ eyes … TO the CME FedWatch Tool, batman …
… this in concert WITH a chart which stopped ME in my tracks (noted HERE over the weekend — the chart of financial conditions? In response to my plea (thanks, Stephen), a reminder that remains to be all about the HARD data (not YET suggesting recession) vs the soft (survey, recessionary) data …
… and so, rate cuts REMAIN … here is a snapshot OF USTs as of 624a:
… for somewhat MORE of the news you might be able to use … a few more curated links for your dining and dancing pleasure …
Finviz (for everything else I might have overlooked …)
Moving from some of the news to some of THE VIEWS you might be able to use… here’s some of what Global Wall St is sayin’ …
Sunday Tea, anyone?
20 Apr 2025 BNP: Sunday Tea with BNPP: Eye of the tiger
KEY MESSAGES
Fed Chair Powell’s very hawkish remarks suggested the risk of rate hikes should inflation show signs of running away.
USD weakness and rising USD rates into the recent risk-off environment indicate outbound capital flows.
For now, we aren’t especially worried about Powell being removed from his job, as this could be politically and economically counterproductive for the administration.
… The overall tone of his speech last Wednesday was very, very hawkish. “Our obligation is to keep long-term inflation expectations well anchored […]. As we act to meet that obligation, we will balance our […] mandates, keeping in mind that, without price stability, we cannot achieve the long periods of strong labor market conditions that benefit all Americans.” This passage, particularly the use of the word “act,” is as strong a signal as Powell could give of the possibility of rate hikes without directly mentioning them.
We continue to see risks to policy as balanced and think the FOMC would move to rate hikes only if there were clear evidence to support this: a sharp rise in inflation, a further increase in long-term inflation expectations, or large and continued financial market movements (such as USD weakness, rising yields and declining equities) consistent with a repricing of the US economy’s structural characteristics, combined with no evidence of a serious economic downturn that would curb inflation. To get such data by the June FOMC meeting would require a sharp, nonlinear deterioration in the economic environment. We also think that the FOMC would move more directly to prepare the market for this eventuality, especially as public debate is still centered on rate cuts….
And for those stock jockeys among us, one y’all be talkin’ ‘bout round the water cooler …
April 21, 2025 MS: Weekly Warm-up: Range Trading Continues Until Clarity Arrives
The S&P remains in the middle of our 5000-5500 trading range. Dispersion of EPS revisions is picking up, a sign that reporting season is likely more of a rotational driver. We recommend looking for quality stocks in industries where the set up is more de-risked and offer tools for idea generation.
Range Trading Continues...Competing factors are at work, keeping the S&P 500 in the middle of our 5000-5500 near-term trading range. The recent reciprocal tariff pause and exemptions show that the administration is willing to show some flexibility on tariff policy—a positive as this was unknown 2 weeks ago. However, on the negative side, earnings revisions remain in a downtrend, the Fed remains on hold, back-end rates remain somewhat sticky and uncertainty around trade policy persists despite recent developments. Upside risks that could potentially drive a break above 5500 in our view include a more dovish Fed, a broader trade deal with China, back-end rates below ~4.0% (without recessionary data) or an upward inflection in earnings revisions. Downside risks that we believe could lead to a possible break below 5000 are a further drop in business confidence that causes an unemployment cycle, back-end rates above ~5.0%, or a further breakdown in EPS revisions that's pervasive across industries.
Dispersion of Earnings Revisions Is Picking Up...This is a sign that earnings season is likely to be more of a rotational catalyst than an index level one (i.e., a range bound market with elevated dispersion in the near term). We would recommend looking for high quality single stock opportunities in industries where the set up is more de-risked (Transports, Materials, Pharma/ Biotech, Tech Hardware) and where management teams are more likely to take a conservative approach on guidance given the macro/policy uncertainty. Tools from us that can help: (1) our new industry framework focused on areas of the market that are more/less de-risked into earnings season, (2) our quality single stock screens across cyclicals, growth and defensive cohorts (see Screens), and (3) our earnings season preview and highlights sections in today's note (see 1Q Earnings Preview and 1Q Earnings Highlights )…
… With that said, there is also a greater risk of a recession now, which is a different kind of slowdown that has not been fully priced at the index level, in our view. So as long as that risk remains elevated, we need to remain balanced with our short-term views even if we believe the odds of a positive outcome for growth and equities are more likely than consensus does over the intermediate term. Hence, the range trade for now. Further clouding the picture is the fact that companies face more uncertainty than they have since the early days of the pandemic, in our view. This is weighing on earnings revisions as noted above. In fact, earnings revisions breadth is now at levels rarely witnessed with S&P 500 revisions breadth now approaching downside extremes (in the absence of a recession). Keep in mind that these revisions peaked almost a year ago, well before the S&P 500 topped, further supporting our view that this correction is much more advanced than acknowledged by the consensus. This is why we are now more interested in looking at stocks/sectors that may have discounted a mild recession already even if the broader index has not. In short, if a recession is averted, markets likely made their lows 2 weeks ago. If not, the S&P 500 will likely take those lows out. There are other factors that could take us below 4800 in a bear case outcome, too—i.e., the Fed gets more hawkish due to tariff-driven inflation (likely a lower probability outcome) or the term premium blows out, taking 10-year Treasury yields above 5%. Nevertheless, we think recession probability is the big wildcard now that markets are wrestling with. In S&P terms, we think 5000-5500 is the appropriate range until this risk is either confirmed or refuted by the hard data with labor being the most important…
In looking at Exhibit 4 , we note that international earnings revisions are now catching down to US revisions at an accelerating rate. In the case of Europe and China, this adjustment appears to be more advanced. We would highlight that US versus Europe relative earnings revisions may now have upside due to the weakness in the USD YTD. This is supportive of our call from a couple of weeks ago, that the relative performance of the US versus Europe can now swing back in favor of the US (even in a down market). This may be even more of a global phenomenon as well given that US relative performance may be stabilizing at long-term support and US earnings streams are less volatile than international peers (see exhibits below).
US National Economic Council Director Hassett said US President Trump was investigating whether they could fire Federal Reserve Chair Powell. Investors seem less than happy with the idea of a politicized Fed—the US dollar and long-dated government bonds have weakened. There are checks on the president’s authority. Fed governors need to be confirmed by the Senate. The FOMC chair does not have to be the Fed chair. However, some of these checks depend on rule of law.
Arguably, the great moderation of inflation was driven by a trend toward central bank independence. While monetary policy is a relatively blunt weapon, it can be wielded to control medium-term inflation. This depends on trust in the central bank. Building that trust takes years. Losing that trust can happen overnight…
… And from the Global Wall Street inbox TO the intertubes, a few curated links …
Ever wonder what the avg decline in earnings and / or GDP was in recessions? 11% / 2.3%, with charts and data from one of the better in the biz ….
April 21, 2025 Apollo: Average Decline in GDP and EPS During Recessions
Looking back at all recessions since World War II shows that GDP on average declines 2.3% and S&P 500 earnings on average decline 11%, see chart below.
A VIEW from Terminal …
April 21, 2025 at 5:00 AM UTC Bloomberg: Say ‘You’re Fired’ and Watch What Happens Sacking Powell now could trigger an epic financial crisis. Best to wait for his term to end.
…Does Powell Really Deserve to Be Fired? If economic outcomes can really be “cause” for dismissal, they need to be really bad. The hideous policy error of 2021, when the Fed continued with QE and zero rates amid rising inflation, is the obvious candidate. That was unquestionably a bad mistake in hindsight, although plenty defended it in real time. The unprecedented conditions of the pandemic made policy-setting difficult. But how bad was it?
Since Jimmy Carter, the shorthand for combining the Fed’s two mandates has been the Misery Index — the unemployment rate plus the inflation rate. That currently stands at 6.6%. Historically, that’s pretty good. Why fire the guy now?
Trump’s argument that Powell is “too late” and should be cutting rates further also has plenty to recommend it; many reputable economists agree, and few would dismiss it out of hand. But it’s hard to argue that financial conditions are unduly restrictive at present, or that monetary policy is harmful.
Bloomberg’s US financial conditions index, which smooshes together indicators from cash, bond and equity markets to gauge risk appetite, has indeed tightened of late (any number below zero denotes restrictive conditions). Why? The circumstantial evidence points to tariffs, not monetary policy that has been unchanged since the last rate cut in December:
Will Denyer of Gavekal Economics argues that indexes like this gauge risk appetite, not the “true” conditions that foster credit growth. The following index captures it by combining money supply growth, the yield curve, metrics of vitality in the banking sector, the spread between the rate of return on corporate investments in real assets and the real cost of financing those investments, and measures of housing affordability. It showed terribly tight conditions as the Fed belatedly took on inflation in 2022 — and a normal, slightly loose environment now:
The Fed stayed too easy for too long in 2021. But why punish Powell now? At this point, the economy is almost near Goldilocks conditions, and the Fed has dealt with the worst inflation outbreak in decades without causing a recession. Then there is the issue of what impact the firing in itself might have…
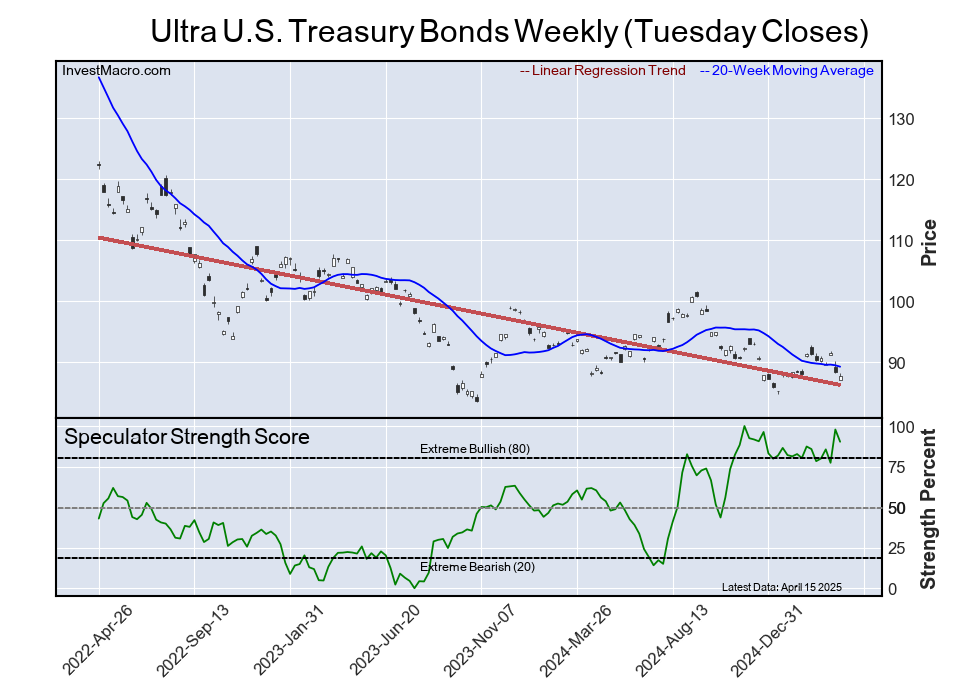
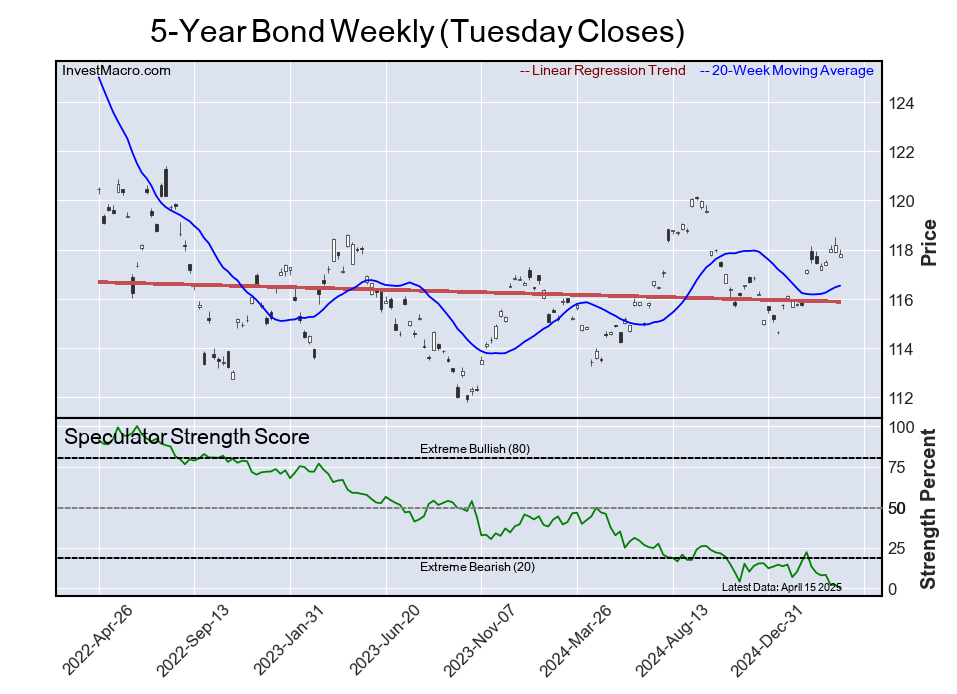
Positions matter and with such great interest in belly of UST curve lately, I thought this was funTERtaining recap of speculative positions …
Apr 20, 2025 InvestMacro: COT Speculator Extremes: Yen, Brazilian Real, 5-Year Bonds & WTI Crude lead Weekly Positions Here are the latest links to our coverage of the Commitment of Traders data changes. Data updated through April 15th.
…Here Are This Week’s Most Bullish Speculator Positions: …Ultra U.S. Treasury Bonds
The Ultra U.S. Treasury Bonds speculator position comes up number four in the extreme standings this week. The Ultra U.S. Treasury Bonds speculator level is at a 90.3 percent score of its 3-year range.
The six-week trend for the speculator strength score totaled a change of 4.5 this week. The overall speculator position was -220,057 net contracts this week with a decline of -19,747 contracts in the speculator bets.
…This Week’s Most Bearish Speculator Positions: 5-Year Bond
The 5-Year Bond speculator position comes in as the most bearish extreme standing this week. The 5-Year Bond speculator level is at a 0.0 percent score of its 3-year range.
The six-week trend for the speculator strength score was -13.4 this week. The overall speculator position totals -2,061,575 net contracts this week with a drop of -40,000 contracts in the speculator bets…
Ever wonder WHAT the drivers of the yield curve are? Well then, today’s yer luck day (and / or you’ve got issues, which is likely why we get along) …
The yield curve is really just a reflection of Fed policy. In fact, it correlates fairly well across history with the spread of the Unemployment Rate and Core CPI. In essence, the yield curve usually correlates with the "net" of the Fed's twin mandate. The curve has steepened in the last year largely because core inflation decelerated while the unemployment rate rose slightly. It's not simple math, but the Fed's 2018 framework on tariffs point to a sharper rise in core inflation this year than in the UR. So, the "net" should be lower on this chart. It does not mean that the curve has to follow this or that the Fed has to ease policy, but it does speak to how challenging this is for the Fed. Interesting stuff. FT
Activate to view larger image,
Ever wonder where stock jockeys get some signals from?
April 18, 2025 at 05:27 PM StockCharts.com: Stay Ahead of the Stock Market: Key Bond Market Signals Explained with Charts
…It's All About Bonds
The recent wild swinging market activity can be encapsulated in the price action of Treasury yields. Since 2024, yields have been swinging up and down. In the past year, the 10-year Treasury yield has ranged from 3.60% to 4.81%, and when the range is this wide, it's an indication of economic instability. Not to mention, economic instability could result in a weaker economy.
The daily chart of the 10-Year US Treasury Yield Index ($TNX) gives you an idea of the range of yields in the last year. More recently, the yield has risen from 3.89% to 4.59%, and has now pulled back to its 50-day simple moving average (SMA).
FIGURE 1. DAILY CHART OF 10-YEAR TREASURY YIELDS. Yields have been seeing some large up and down swings.Chart source: StockCharts.com. For educational purposes.
Generally, when stock prices fall, bond prices rise. Since bond yields move inversely to bond prices, you'd expect yields to fall. This scenario isn't playing out. Instead, we're seeing yields move erratically while bond prices remain suppressed. There needs to be stability in bond yields before a stock market recovery, and one way to do that is to monitor the chart of the Merrill Lynch Option Volatility Estimate, referred to as the MOVE Index ($MOVE).
The MOVE Index tracks bond volatility. Think of it as the bond counterpart to the Cboe Volatility Index ($VIX). The chart below displays the $MOVE/$VIX relationship, with the correlation between the two in the lower panel.
FIGURE 2. THE MOVE INDEX VS. VIX. A high correlation between the MOVE Index and VIX suggests interest rates and stock prices are tightly connected. A lower correlation would indicate stability in equities.Chart source: StockCharts.com. For educational purposes.
The two have been highly correlated since the end of March, which indicates that stocks and interest rates are tightly connected. This means the wild up and down swings in equities could continue. When the two are less correlated, we can expect equities to start settling down. Looking at the above chart, a correlation of 0.80 would be sufficient for signs of stability.
Both $VIX and $MOVE have come back slightly, but their correlation is at 0.93, which is relatively high.
Be sure to save both charts displayed in this article to your ChartLists. They could alert you to stability in the stock market ahead of other indicators.
The Bottom Line Until stability returns, you could do the following:
Stay on the sidelines and keep some dry powder.
Invest in risk-off instruments such as gold and silver.
Park some of your money in defensive sectors.
Equities could slide lower before stability returns. If this happens, you could pick up some growth stocks for a bargain.
An empowered investor comes out ahead after market instability. So monitor the market closely and, when the time is right, make wise investment decisions …
Finally, WolfST on USTs and mortgages … visual caught MY attention …
Apr 18, 2025 WolfST: The Spread between 10-Year Treasury Yield & Mortgage Rates Is Historically Wide and Widened Further: Some Thoughts
…The average 30-year fixed mortgage rate rose to 6.83% (Freddie Mac). It has been above 6% since September 2022.
Historically, the average 30-year fixed mortgage rate didn’t drop to 5% until the Fed started QE in 2009, which included the purchases of massive amounts of MBS, which helped push down mortgage rates and was part of the Fed’s scheme of interest-rate repression and asset-price inflation. But then raging inflation broke out in 2021 and put an end to it.
MBS come off the balance sheet mostly through passthrough principal payments as mortgage payoffs (sales or refis) and principal portions of mortgage payments are forwarded to the holders of MBS, such as the Fed.
These passthrough principal payments have been running at about $15 billion a month for the past year. If mortgage rates drop a lot, the pace would speed up. The Fed has said many times in its official announcements that it plans to get rid of all its MBS. It stepped away from the MBS market in September 2022, and that market has been on its own ever since, unleashed from the Fed’s controlling fist.
Before QT started, the Fed held $2.74 trillion in MBS. QT has whittled that down to $2.19 trillion, and whatever comes off via passthrough principal payments comes off and goodbye.
But the Fed further slowed the pace of the Treasury securities roll-off to just $5 billion a month, starting in April. The Fed then reinvests the amounts that mature in excess of $5 billion a month by buying equivalent Treasury securities at Treasury auctions. So the Fed is again with both feet in the Treasury market, replacing a big part of its maturing securities with new securities.
And this asymmetry of leaving MBS yields, and thereby mortgage rates, entirely up to the market, while still meddling in the Treasury market has increased the spread between the 10-year Treasury yield and mortgage rates.
AND … the latest craze ‘out there’, courtesy of Jim Bianco: