Good morning … spin machines into overdrive in the wake of CPI report …
WSJ: Inflation Slipped to 2.9% in July, Lower Than Expected Report likely seals case for the Fed to begin cutting interest rates at its next meeting
… compare and contrast with …
ZH: Core Consumer Prices Hit New Record High - Up For 50th Straight Month
Following last month's 'deflationary' print (-0.1% MoM), analysts expected headline CPI to rise 0.2% MoM and they were spot on, shifting the YoY CPI print to 2.9% (from 3.0%) - the lowest since March 2021....
… ultimately, and there will be more victory lapping and recapping below as Global Wall Street narrative machine cranks up ahead of the weekend.
Inflation did NOT surprise to the upside and as you’ll see below, everyone’s got this continued sense of comfort things are going in the right direction (or going too far) and so the Fed will respond in September with a cut of some magnitude. Furthermore, it’s widely anticipated that JPOWs speech in one weeks time will set the table for the magnitude OF whatever cut is to be expected.
In the meanwhile and in light of the great / terrible <choose one> CPI report, my view doesn’t really matter … I’m always and forever MOST interested in the (bond)markets translation OF the data and perception / pricing of the whatever NEXT.
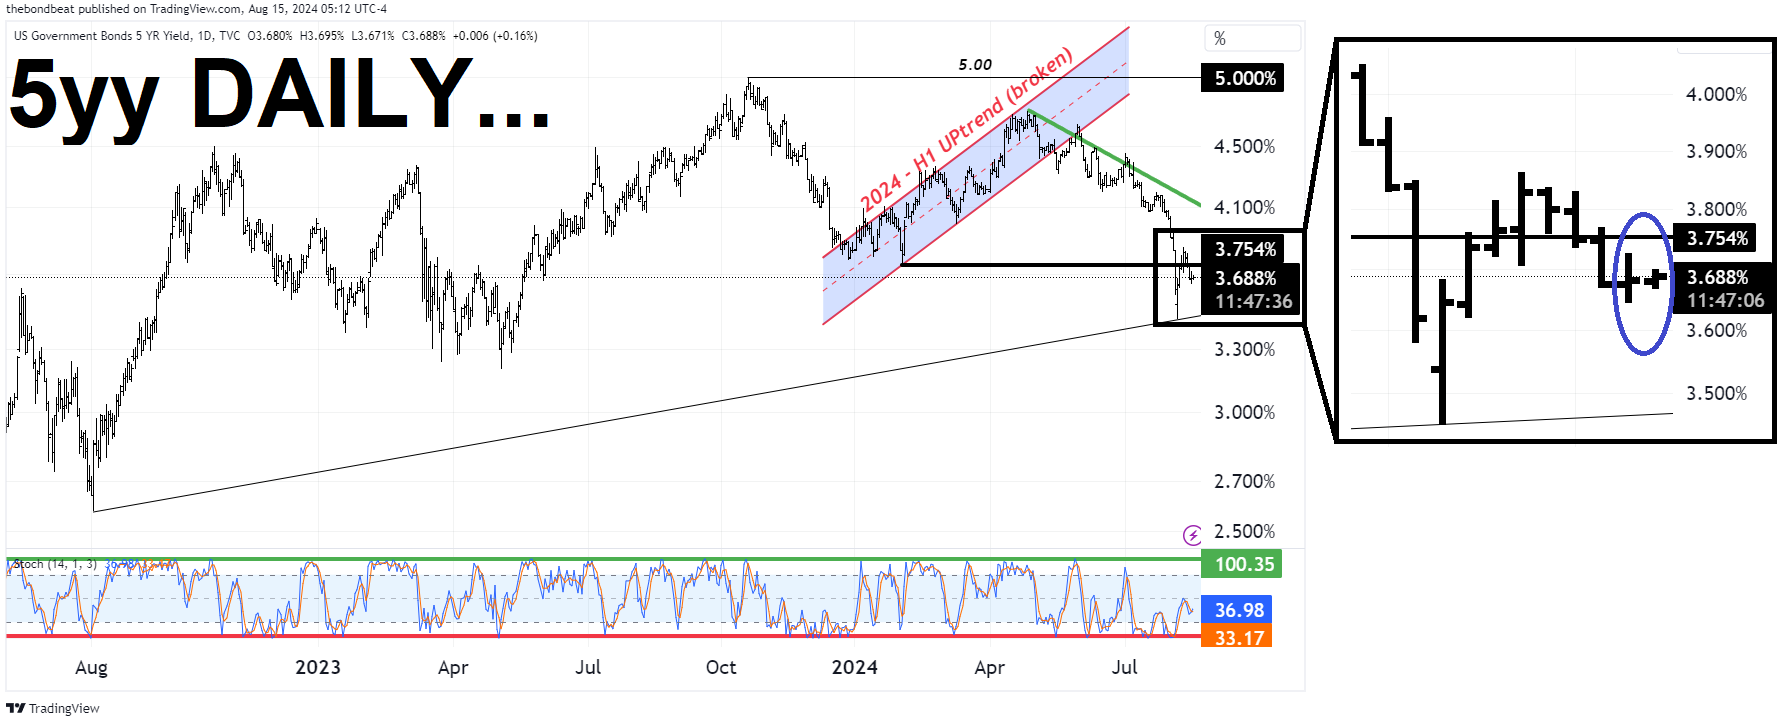
For THAT a quick look at 5s
5yy: price response TO CPI … ‘aggressively UNCH’ and momentum offers little
… good luck then as you plan your trades and trade your plans…
… isn’t it remarkable that Mr. Market found all the data … well … nearly unremarkable?
ZH: Bullion, Bitcoin, & Black Gold Battered But Sanguine CPI Slams Leaves Stocks & Bonds Confused
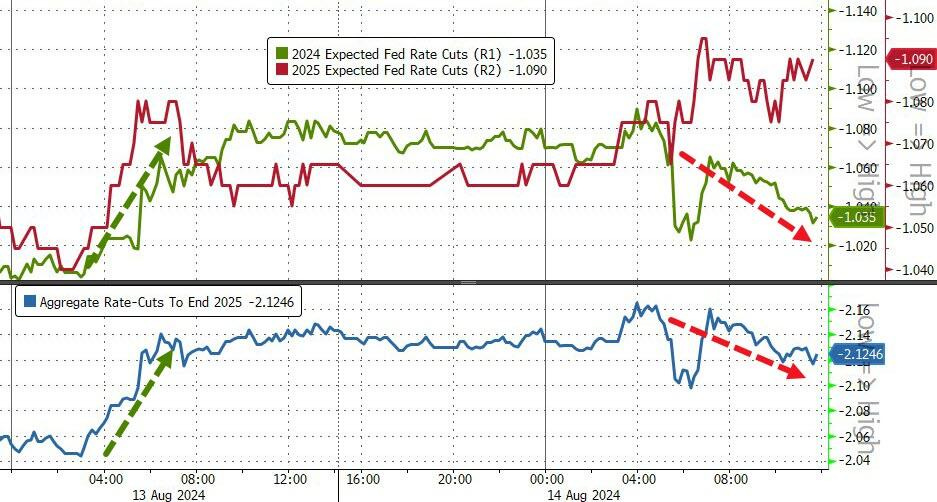
… ..and it is that potential growth scare that is dominating traders' minds as they reduce rate-cut expectations...
… Go figure. Perhaps this mornings ReSale Tales and WMT earnings will do a better job of helping churn the narrative machine?!
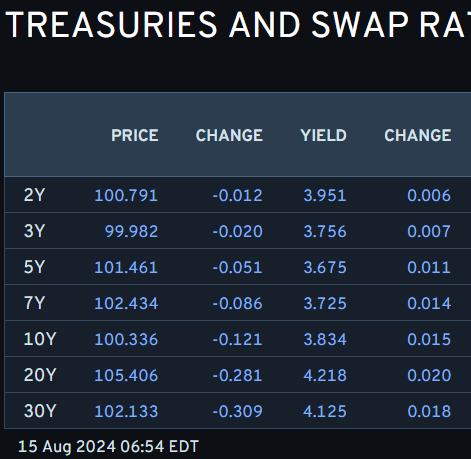
And so with that in mind I’ll get to it and first, here is a snapshot OF USTs as of 654a:
… and for some MORE of the news you might be able to use…
NEWSQUAWK: US Market Open: US equity futures are mixed & DXY flat ahead of US IJC/Retail Sales, AUD bid post-jobs data … Bonds are modestly lower, with slight underperformance in Gilts while USTs are contained into data … USTs are lower, but only modestly so, into a packed data docket. Headlined by Retail Sales while the weekly jobless claims data will draw particular focus as participants increase their focus on the jobs-side of the Fed’s dual mandate. USTs at a 113-18 base which is comfortably above the last two session’s 113-13+ and 113-02+ lows.
Reuters Morning Bid: Doldrums at last, with US retail and China housing in focus
Finviz (for everything else I might have overlooked …)
Moving from some of the news to some of THE VIEWS you might be able to use… here’s SOME of what Global Wall St is sayin’ … CPI recapAthons, victory laps and more …
July core CPI inflation surprised to the downside yet again, printing at 0.17% m/m (3.2% y/y), 10bp faster than in June. Interestingly, while core services inflation accelerated as expected, it was partly offset by sizable deflation in core goods prices. The data translate to a core PCE estimate of to 0.19% m/m.
… Looking ahead, we do not expect this magnitude of deflation to repeat on the core goods side, while do see scope for some softening in shelter inflation. With wholesale used car prices, such as the Manheim measure, indicating a firming in prices, we do not expect another month of decline in used car prices. On the other hand, we think OER CPI could soften next month, given the Feb/Aug cohort is running below the Jan/Jul cohort (Figure 6). The run-up in rents CPI struck us as odd given market rent series lagged by 12-14 months are still indicating disinflation. In addition, looking at the regional profile of rents, it appears that the acceleration in July was helped by a handful of small regions that had underperformed relative to their 12m trend in June, and more than retraced that move in July. All told, we think rents CPI could return to a more benign trajectory in coming months, leading us to retain our baseline that rent CPI will slow to 0.25% m/m and OER to 0.30% m/m by year-end.
These July inflation outcomes are likely to bolster the FOMC's confidence that the disinflation process is intact. Core CPI and core PCE prints rounding to 0.2% m/m are on a path that is consistent with the Fed's 2% inflation target. We think this shifts the focus on upcoming economic activity and labor market data, especially after the July nonfarm payroll report stoked market concerns about a rapid cooling in labor market conditions. We retain our baseline that the FOMC will deliver three 25bp cuts this year, in September, November and December, assuming the inflation data remain on a benign trajectory, and labor market conditions proceed to cool gradually. Tomorrow's July retail sales release will be closely watched.
BARCAP: US CPI Inflation Monitor (July CPI): Disinflation intact
Core CPI inflation rose 10bp in July to 0.17% m/m (3.2% y/y), led by a re-acceleration in shelter inflation that was partly offset by core goods deflation. We continue to anticipate a run rate of about 0.2% m/m for core CPI in the coming months. Our year-end core CPI forecast has shifted lower to 2.9% after today's data
BAML: Global Fund Manager Survey (days late but better than not at all…) Shaken, not stirred
Bottom Line: cash levels up from 4.1% to 4.3%, investors OW stocks down from 51% to 31%, capex optimism drops to 9-month low; but core optimism on soft landing (76%) & US large cap growth stocks unbowed…just that investors now think Fed needs to cut harder to guarantee no recession (60% say 4 or more Fed cuts next 12 months).
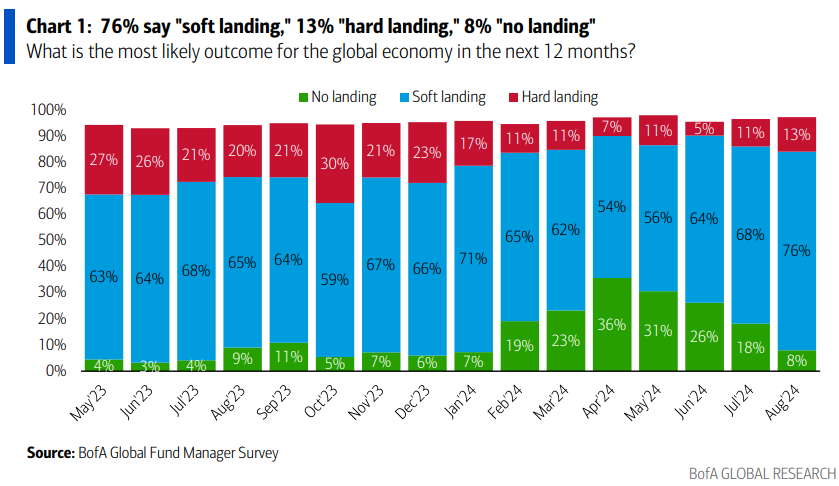
FMS on Macro & Micro & Profits: global growth expectations drop from net -27% to -47% (optimism on China lowest since May'22); but investor probability of “soft landing” jumps from 68% to 76% (“no landing” drops from 18% to 8%, “hard landing” up from 11% to 13% - Chart 1) …
… On monetary policy…55% of FMS investors believe that global monetary policy is too restrictive, the most since Oct'08. Investors' belief that policymakers must ease monetary policy rapidly driving expectations for lower rates...
… "Soft landing" economic conviction driven by expectations for lower interest rates…93% of FMS investors expect short-term rates to be lower in 12 months' time, highest in the past 24 years.
… Within the details, we see Rent at +0.488% and OER at +0.362% with Used Cars at +2.3% and New Cars down -0.2%. If anything, the stickiness of Rents/OER was the one notable aspect of the report but overall, it was a remarkably as-expected update that keeps a 25 bp Fed cut in September as our base case assumption…
The details of the in-line July CPI report continue to tell a story of disinflation that should persist through the rest of the year, in our view.
An expected bounce in Western region shelter drove a firmer print relative to June, but we think the overall trend remains squarely downward.
With CPI and PPI now in hand, we marginally mark up our July core PCE forecast to 0.18% m/m (from 0.16% prior).
The CPI report should be the last required data for Fed officials to gain confidence that inflation is headed sustainably back to 2%, clearing the way for a rate cut in September.
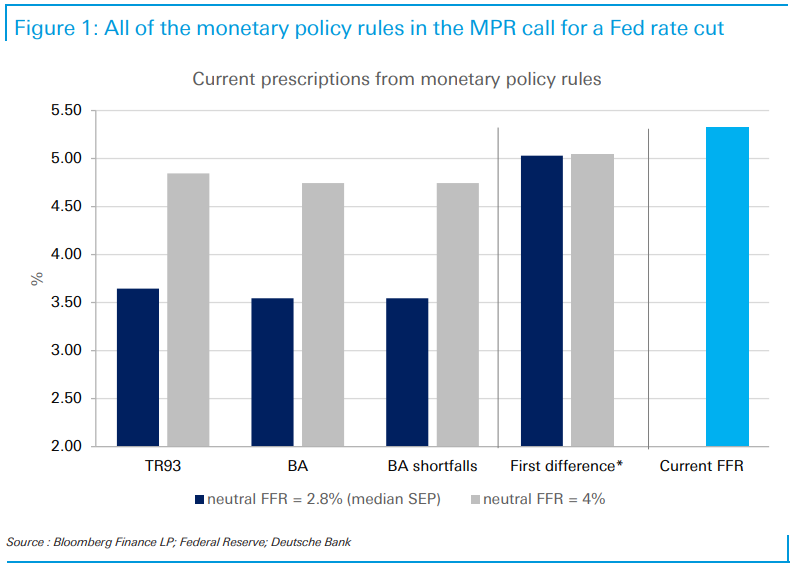
DB: Applying the rules (written and sent BEFORE CPI and rules SAY — CUT!!)
A key question running through Chair Powell’s recent press conference was why, with the Fed close to its goals and mounting downside labor market risks, was it not already lowering the policy rate.
The clearest way to dimension the issue is in the context of policy rules.
Today’s chart shows the level of the fed funds rate called for by the various rules detailed in the Fed’s Monetary Policy Report (leaving off the rule that seeks to make-up for an extended period at the ZLB)…
… So why hasn’t the Fed cut ? First, its only recently that the rules uniformly call for cuts. Second, the FOMC often departs significantly from the rules, and in particular outside recessions typically adjusts policy more gradually than they call for. And third, uncertainty and risk-management considerations have likely factored in; the Committee has long signaled a relative preference for easing too late rather than too early, even if they see the relevant risks as having come into better balance.
FirstTrust: The Consumer Price Index (CPI) Rose 0.2% in July
…Implications … Meanwhile, a subset category of prices the Fed has told investors to watch closely and is a useful gauge of inflation in the service sector – known as the “Supercore” – which excludes food, energy, other goods, and housing rents, rose 0.2% in July. These prices are still up 4.5% in the last year but have showed some signs of slowing, up at a 0.4% annualized pace in the last three months. Although inflation risks are dissipating, we are not at the finish line yet. Inflation is still running above the Fed’s 2.0% target (now for the 41st consecutive month) and could re-accelerate should the Fed overreact and ease policy too much.
ING: Cooling US inflation keeps the Fed on track for rate cuts
July inflation data suggests the Federal Reserve remains on track to hit its 2% target, which should allow the Fed to increasingly focus on its other target of maximising US employment. A September interest rate cut is broadly expected, but the question of magnitude remains and puts the focus on the August jobs report, due 6 September
Incorporating inputs from CPI, we now forecast core PCE inflation increased 0.184%M in July vs. 0.18%M in June. This would raise core PCE y/y from 2.63% to 2.70%. Headline PCE is forecasted at 0.174%M vs. 0.08%M the month prior. Core services ex housing translation points to 0.24%M in July vs. 0.19% prior. Our updated forecast includes information from today's CPI print and yesterday's PPI data.
A core PCE print aligned with our expectations would be the forth consecutive month of sustained disinflation adding to the evidence the Fed will start cutting rates. We expect relatively weak prints the rest of the year and we maintain our call for a first cut in September, followed by cuts at every meeting through mid-2025. We don't think this print is weak enough to drive the Fed to cut 50bp in September…
… On a 3-month annualized rate, core CPI decreased from 2.1% to 1.6%. Headline was below expectations due to a step down in food prices, coming in at 0.15%M (MSe 0.21%M, consensus 0.2%M) vs. -0.06%M prior.
RBC: U.S. inflation continued to edge lower in July Another downside surprise in U.S. June inflation
…Bottom line: The U.S. economic backdrop isn't collapsing in a way that would force the Federal Reserve to panic. But a gradual rise in the unemployment rate is increasing the odds that wage growth and inflation will continue to drift lower, and interest rates are still at levels well above the Fed's estimate of long-run neutral. The Fed will still get another jobs and inflation report ahead of the next scheduled interest rate decision in September, but we continue to look for a 25 basis point rate cut at that meeting and think risks of a larger 50 basis point reduction would be contingent on a significantly more pronounced (and unexpected) deterioration in labour market data for August.
US July consumer price inflation data continued recent trends. Most sectors of the US economy have deflation somewhere (furniture prices seem to be plunging in California. Clothing prices are falling in New York). Fictional prices for housing are propping up the inflation data—which means middle income homeowners have more spending power than consumer price numbers imply.
The spending power is relevant with today’s US July retail sales data. The force of hedonism remains strong in the US consumer. While the ongoing trend toward spending on fun is not captured in these numbers, they matter as a reflection of the labor market—both as a driver of employment and as a signal of low fear of unemployment. Weekly initial jobless claims figures are also due…
Summary The July CPI data were largely in line with expectations. Both headline and core CPI increased by 0.2% in July (0.15% and 0.17%, respectively), just a basis point or two off from our forecast going into the release. The details of the report contained a few surprises. Core goods prices fell more than we expected, led by another large (-2.3%) decline in used vehicle prices. Core services inflation was a bit hotter than anticipated, led by rebounds in inflation for housing, recreation and communication services.
The broad narrative of continued disinflation remains unchanged. Headline CPI fell below 3% year-over-year for the first time since March 2021. Core CPI declined to 3.2% year-over-year, the slowest pace since April 2021 and roughly half the 6.6% peak hit in September 2022. Furthermore, the annualized pace of core CPI inflation over the past six and three months has been 2.8% and 1.6%, respectively.
Today's data leave the FOMC in a holding pattern and do not settle the 25 bps or 50 bps debate for September. As we go to print, markets view September as roughly a coin flip between the two outcomes. The continued steady slowdown in inflation, when paired with the rise in the unemployment rate and deterioration in other labor market indicators, leads us to believe the FOMC will want to move quickly towards a more neutral policy stance in the months ahead. As a result, we expect a 50 bps rate cut at the September FOMC meeting, but the decision ultimately may be determined by the August employment report to be released on September 6 and the August CPI report to be released on September 11. Chair Powell's expected speech at the Jackson Hole conference on August 23 looms large as the FOMC weighs the balance of risks to its dual mandate.
Wells Fargo: Soft-Landing, or No Soft-Landing, That Is the Question Part II: Quantifying Episodes of Soft-Landing, Stagflation and Recessions
Summary
In the second part of the series, we quantify episodes of soft-landings, stagflation and recessions during the post-1950 period.
To the best of our knowledge, we are the first to present a framework to quantify periods of soft-landing for the U.S. economy.
Our work estimates that there are 13 episodes of stagflation and 13 episodes of soft-landings in the post-1950 era.
According to the NBER, there are 11 recessions during the same period.
In the next installment of the series, we'll introduce a probit framework to generate four-quarter-out probabilities of the three scenarios. These probabilities would be helpful to determine the magnitude and duration of upcoming policies, as monetary policy decisions are influenced by the near future economic outlook.
…Testing, Not Assuming, Would Be a Better Way To Project the Near-Term Policy Path
Rather than assuming that the FOMC may repeat the past easing cycle's behavior, we suggest that predicting the potential growth scenarios is a better path, as it is more consistent with the FOMC's mantra of “data-dependent decision-making.”
We believe NBER’s recession dates methodology and our approach of soft-landing episodes are valuable inputs to policy decisions, as they capture the recession risk and the soft-landing scenario. Including our stagflation work in the mix would complete the three major economic scenarios for monetary policy decision-making. In the next installment of the series, we'll introduce a probit framework to generate four-quarter-out probabilities of the three scenarios. By predicting the near-term likely growth scenario, the probit framework could be a valuable input to project the possible path of the upcoming easing cycle.
… And from Global Wall Street inbox TO the WWW,
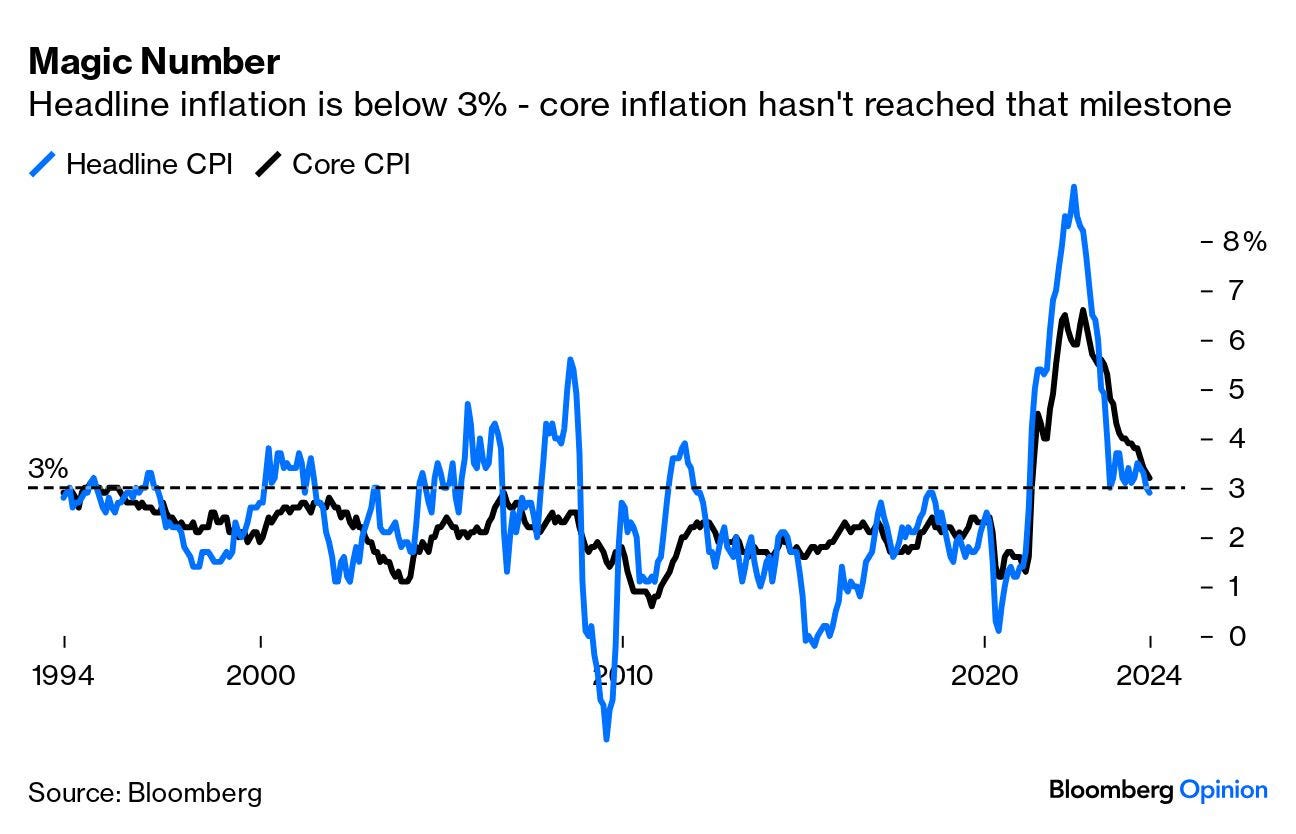
Bloomberg: Inflation's below 3%: Time to worry about something else (Authers’ OpEd where he’s spiking the football … too soon? good charts and worth a look)
The US just published inflation data. They included a big breakthrough, with headline consumer price inflation dropping below 3% for the first time since 2021. That’s the magic number putting price rises within the Federal Reserve’s official target range (one percentage point either side of 2%). That said, core inflation excluding food and fuel remains just above 3%. Before the current spike, it hadn’t been so high since 1994:
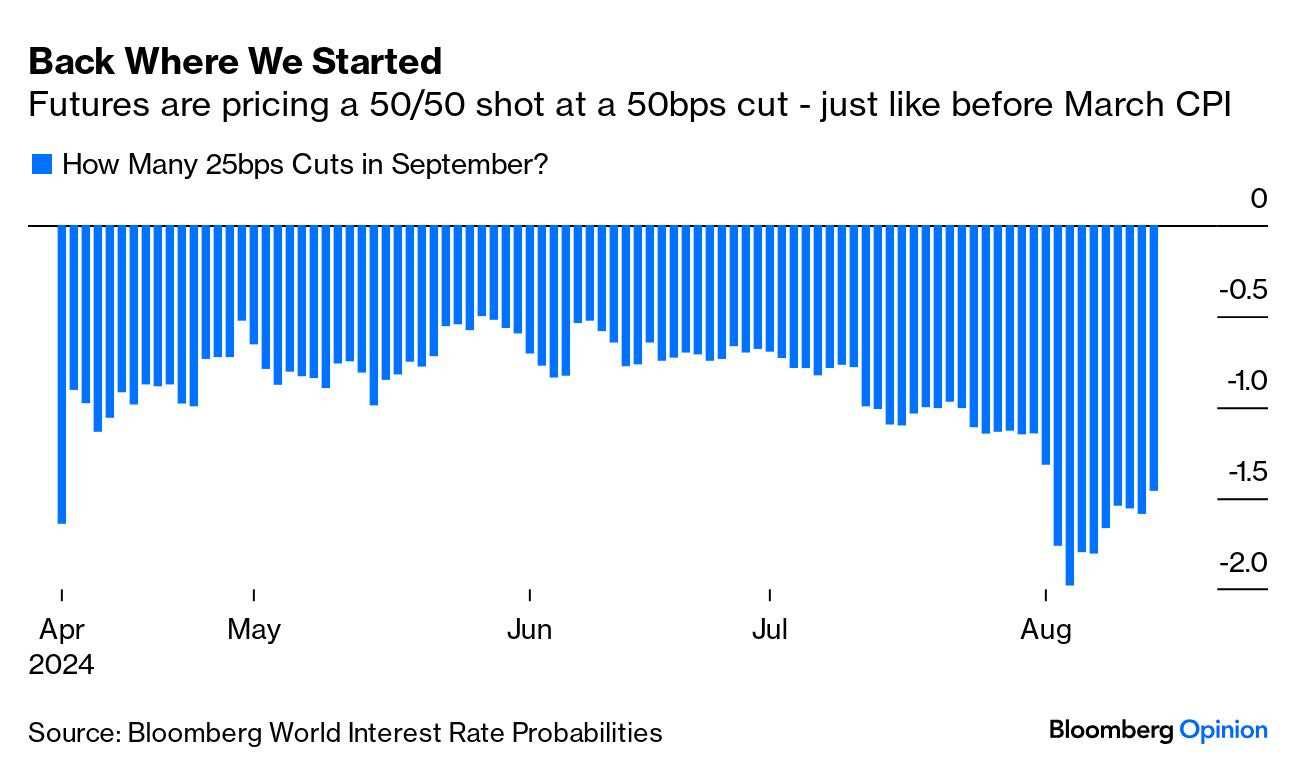
… Thus it was that futures traders greeted breaking the 3% barrier by reducing the odds of a 50-basis-point cut next month. A 56% shot before the July CPI, it’s now been trimmed to 40%:
The broader market reaction was reassuringly measured. The Nasdaq Composite fell by 0.03%, while the 10-year Treasury yield dropped by 0.8 basis points. Rightly or wrongly, investors are now assuming that inflation is on course for 2%, just as the Fed has always needed before it can start cutting rates. After three years of inflation obsession, it’s encouraging that the focus can turn to other factors.
FRB Atlanta: Atlanta Fed's Sticky-Price CPI Remained Elevated in July - August 14, 2024
… The bottom line remains the same, and that is that inflation continues to decelerate but median is going to end up in the “high 3s, low 4s.” I keep thinking that we will dip below that for a little while when the base effects of shelter pass through, before reaccelerating to what I think is the new ‘normal’ level, but shelter is being persnickety and resistant to that deceleration. Either way, there is nothing here that would encourage the Fed to aggressively ease 50bps. Or, for that matter, to ease at all. If the Fed eases in September (which I expect, even though if I were a member of the Board I wouldn’t vote for one), it will be because its members fear recession and not because there is evidence that inflation is licked. That evidence is still elusive.
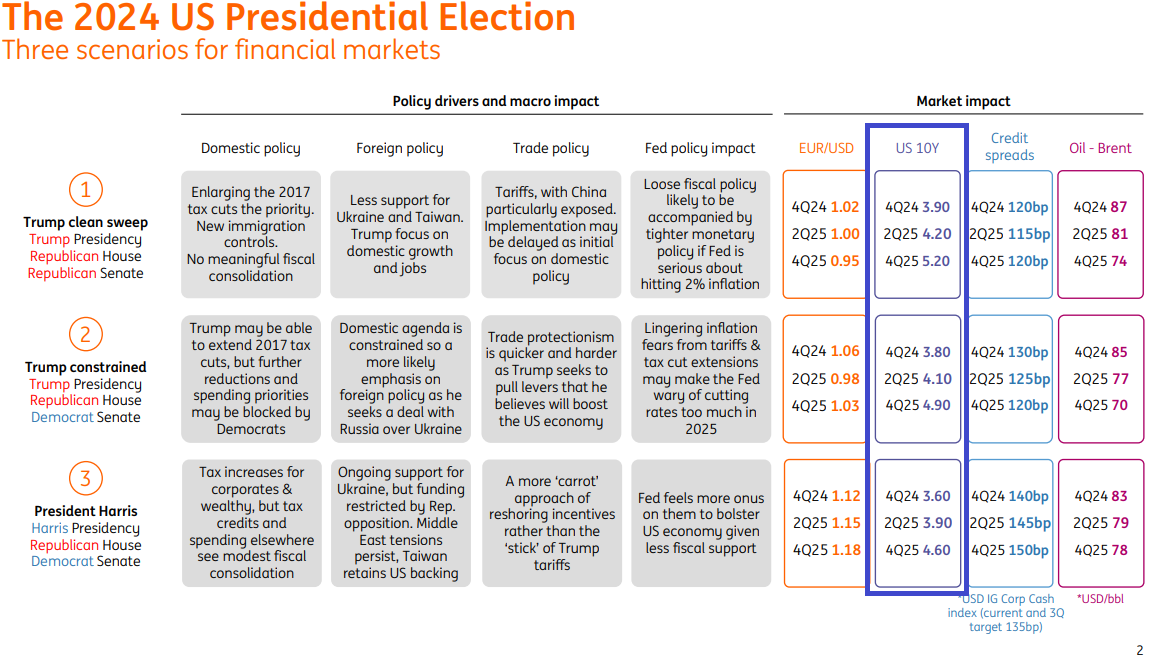
ING: US presidential election: Three scenarios for markets
The next president of the United States and the parties that will control Congress will have a major say in where financial markets head over the coming years. So, just what might happen to FX, Rates, Commodities, and Credit Markets whoever wins? Welcome to our scenarios
Because long-term investment returns are largely a function of the abundance or scarcity of capital, the current flood of capital toward AI investments suggests better longer-term investment opportunities might be elsewhere.
Deglobalization and the dire need for the US economy to regain its independence seems a much more ignored and, therefore, attractive long-term theme. The US economy could be in the early stages of a 10- to 20-year metamorphosis.
The next chart highlights one reason why deglobalization likely means higher secular inflation. Tariffs can sometimes be a tool used to protect under-utilized domestic production, but the US lacks enough productive capacity to meet demand so tariffs have directly contributed to higher prices. If deglobalization does indeed continue, then secular disinflation seems behind us.
WolfST: Beneath the Skin of CPI Inflation: Broad Month-to-Month Acceleration, Services CPI Bounces Back from Outlier, Plunge in Durable Goods Prices Slows
Housing CPI re-surged in July from the June outlier.