while we slept; macro charts updated & where to SELL bonds into weakness; a case for a tactical (2s10s)steepener; wanna dance (the growth / rates tango)
and a few other items of interest from the sellside inbox
Good morning and welcome to that placeholder of a day between ADP (-301k) and NFP. Today we can all sit around and consider how / why it is so hard to imagine that with hikes and QT coming, Treasury decided to reduce issuance (and hey, prolly more CUTS in issuance on the way). Quid Pro Quo defined?
ZeroHedge: US Treasury Cuts Size Of Long-Term Debt Issuance, Projects More Auctions Size Reductions
… The changes in nominal coupon auction sizes announced today will result in a $111 billion reduction of issuance to private investors during the February – April 2022 quarter compared to the November 2021 – January 2022 quarter…
…As part of its refunding commentary, the Treasury Borrowing Advisory Committee (TBAC) said that Treasury should slow or halt coupon reductions sooner than previously anticipated, “there is significant uncertainty in forecasted deficits and SOMA redemptions, warranting gradual adjustments under the regular and predictable paradigm while continuing to evaluate the financing outlook,” according to a statement committee presented to the U.S. Treasury Secretary from the following a Feb. 1 meeting.
… TBAC said it reviewed several possibilities for future Treasury issuance assuming the Federal Reserve’s balance sheet runoff begins in July 2022 and ends when SOMA reaches 23% of nominal GDP. The Committee unanimously agreed that Treasury should continue with cuts in auction sizes for its coupon securities this quarter at the same pace as the prior quarter, noting this path would continue to reduce the supply of 7-year and 20-year securities by a disproportionate amount to address the imbalance and would help to maintain T- bill share within TBAC’s recommended range of 15-20%.
… Looking ahead to the next quarter, the TBAC expects further reductions may be necessary “but likely at a slower pace, noting a high degree of uncertainty around future funding needs including those tied to evolving expectations for SOMA redemptions.”
… The full TBAC presentation discussing "Developments Affecting Future Changes in Treasury Auction Sizes" is below (pdf link)
For MORE see Goldilocks recap HERE. With that (quid pro quo — change my mind) in mind, here’s a peak into what did / didn’t happen overnight.
… WHILE YOU SLEPT Treasuries are mixed with the curve modestly steeper ahead of this morning's central bank events. UK gilts have underperformed ahead of an expected BOE hike- the first back-back hikes by the BOE since 2004 if the consensus is right. Not that the BOE needed a nudge... but their energy regulator just lifted the cap on UK energy bills by 54% a few minutes ago (see above). DXY is higher (+0.3%) while front WTI futures are lower (-1.5%). Asian stocks that were open were mixed, EU and UK share markets are all modestly in the red while ES futures are -1.2% here at 6:30am after a big miss by a big tech name after hours yesterday. Our overnight US rates flows saw 'uninspiring' volumes again overnight with two small FV blocks posted and some better buying in the long-end about the only activity noted. Overnight Treasury volume was ~55% of average all across the curve.
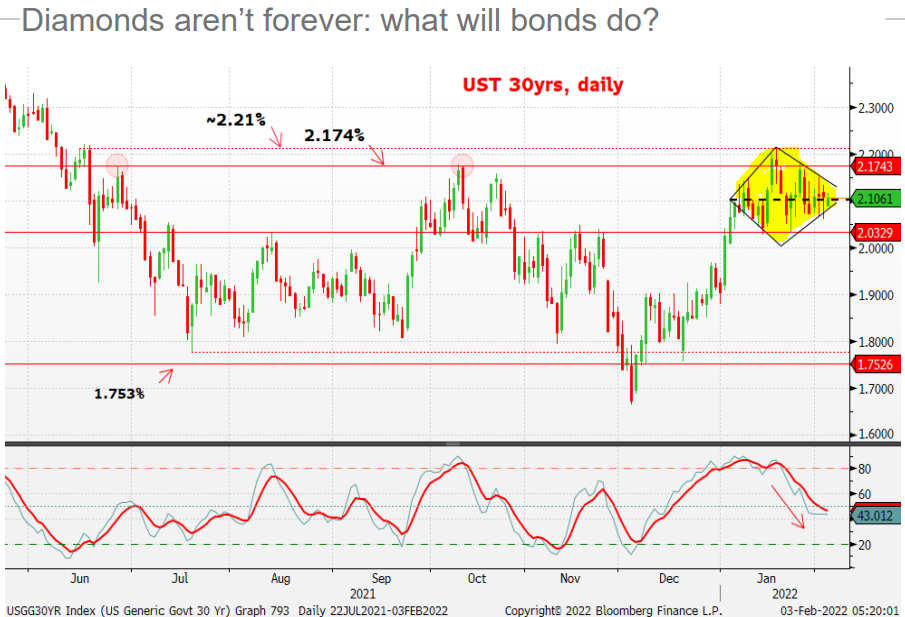
AND then offers a couple updated visuals of DIAMONDS — a bond strategists besty?
… Diamonds are a rates strategist's worst friend. This year the markets appear smitten with the ~2.10% level in UST 30y bonds as you can see in today's first attachment. We posted this picture yesterday and here we are opening near the level again today. We're closing in on the apex of the ' diamond ' today and it will be interesting to see if we go through it sideways (holding near 2.10%) or if we leave this formation behind and kick-off a new, local trend. If bonds break bearishly out of January's price pattern (something not yet hinted at in our work), the pre-pandemic rate range (roughly 2.175% to 2.44%) might be a next upside target range as we show in today's second attachment.
And for some more of the news you can use » IGMs Press Picks for today (03 FEB) to help weed thru the noise (some of which can be found over here at Finviz). This one — another day, another deadline — caught MY attentions,
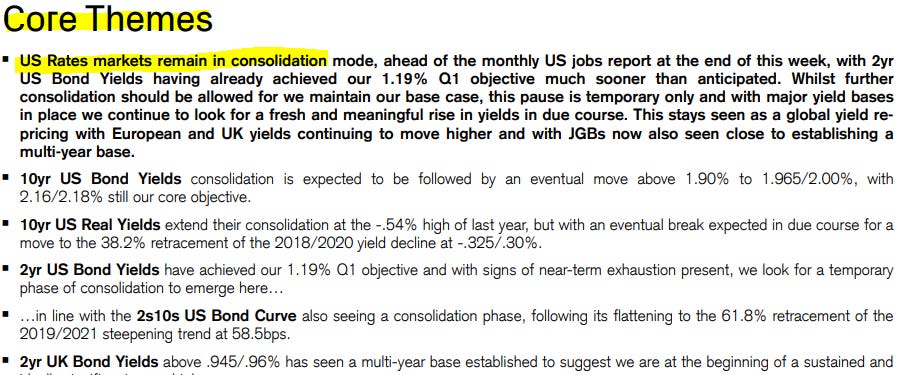
Moving on to some updated macro charts / themes (via 1stBos), I cannot harp on them too much because, well, 2.10% long bonds require one NOT get too wound up. This won’t prevent others (and most of the SellSide) from doing so because, well, without hype, there are no commission dollars!
But not to worry, core BEARISHNESS remains largely intact
And for your inner curvologist,
And more. MUCH, much more for those who like or follow along.
Speaking further TO the curvologists out there, a large German bank makes case for,
… a tactical UST2s10s steepener The flattening of the UST2s10s curve since the FOMC meeting, and new elements lead us to consider the merits of a tactical UST2s10s steepener. Besides short-term tactical considerations, we maintain the strategic view that the Fed has more catching up to do.
The case is then made, step by step, factoid by factoid and arrives at, well, how there’s only ONE conclusion based on these factoids
Walk back from the Fed… Risks of a soft patch in Q1… Positioning is likely to be in bear flatteners: The aggregated positioning indicator's predictive power of future returns is limited. This being said, several components of the indicator such as net specs positioning in futures and mutual fund / ETF flows suggest that short positioning is large and curve positioning is into flatteners. Figure 4 above shows our aggregated positioning, aligned with inverted 10y Treasury yield, reached short duration levels last seen in early to mid-2018.
Valuations - term premium is too low… Seasonality - Term premium tends to rise early February… Strategically the Fed remains very much behind the curve
And with THOSE factoids each discussed in some further detail,
Portfolio update - a tactical steepener: We enter a tactical UST2s10s steepener (target 75bp, stop 55bp), and exit the short UST2s and the UST5s10s + 20% short in 2s term premium trade. We maintain a bearish bias in our portfolio expressed via a short 10y Bund. For all the reasons mentioned above, this portfolio adjustment is purely tactical and will be reassessed relatively soon.
Clearly working without a net here on THIS side BUT a daily going back TO 2018,
Looks to ME they are all on to something. Momentum (Stochastics, bottom panel) does look extended and we’re right at / near fibo retracement so perhaps some (corrective?) steepening worth a look.
… Interestingly, a “camp” of investors believes the rise in rates has already occurred. I think the Fed will have something more to say about that going forward, and while the march toward higher yields has begun, we may still be in the early innings. In fact, the Fed seems poised to be the catalyst for higher rates not just for this year but for 2023 as well. -Kevin Flanagan, head of FI for WisdomTree
… Since the shorter end of the curve has ripped higher, the moves in these contracts and ETFs are extended. They simply don’t offer favorable risk/reward trade setups at current levels.
… First up is the 30-year Treasury bond futures:
T-bonds are carving out a multi-year head-and-shoulders top above their pivot lows from last March.
We want to sell weakness on a decisive break below the neckline and those former lows at 153’07, targeting the 2019 lows around 136’16.
We can only be short on a completion of this topping pattern. Our bias is neutral until we get a clear resolution lower.
Next is the 20+ Year Treasury Bond ETF $TLT:
This T-bond ETF has gone nowhere since last March. But it’s currently testing the lower bounds of a six-month range that coincides with a key extension level around 141.80.
We have to imagine if the 30-year yield is catching higher and T-bond futures are breaking down, then TLT is most likely following suit.
If that’s the environment we’re in, we want to sell a break below the year-to-date lows around 140 with a downside target of 123.
To be clear, we can only be short below last month’s low.
Last but not least we have the 10-year Treasury note futures:
T-note futures are retesting a former level of resistance turned support around 127’27. Price is currently coiling in a bearish continuation pattern and threatening to violate this key level to the downside.
If and when we get a break below the pivot lows, we want to be selling weakness with a downside target around 123’28. Like the previous setups, this trade is not valid if it’s above the year-to-date lows. That’s our line in the sand.
Remember, we can’t be short any of these bonds until we have confirmation in the form of valid breakdowns. Maybe they trigger, maybe they don’t…
While SOME believe it’s settled, there are others — leaders of the muppets, for example, who believe there is more to it … In typical global Wall Street fashion, a problem is created and over emphasized so that a firms team of quants can, well, untangle the mystery and in doing so, curry ALL of your favor (and flow with commission revenues). To that point, the latest from Goldilocks,
Untangling the Growth-Rates Tango ■The impact of the interplay between growth and policy on asset prices—what we have referred to as the “growth-rates tango”—is again in focus as markets have simultaneously confronted an increasingly hawkish Fed and slowing growth in recent months.
■In today’s Daily, we update a framework that we have used in the past to parse out “growth” and “policy” shocks inferred from yields and equity prices. We then use these disentangled “growth” and “policy” shocks to make sense of recent price action and to decompose recent changes in financial conditions.
■We identify three broad stages beginning from the September FOMC meeting where positive growth shocks, growth fears, and hawkish policy shocks have alternately been in the driver's seat. Cross-asset performance largely bears that out. We also find that while positive growth shocks were important in keeping financial conditions easy in the last quarter of 2021, over the last month, hawkish policy shocks alongside negative growth shocks have instead driven the recent tightening in financial conditions.
■Going forward, in the language of this framework, we are wary of ongoing policy shocks but less worried about large negative growth shocks. Taken together, we would avoid assets that are highly negatively exposed to higher rates while leaning into cyclical exposures particularly when the market falters. So our strongest views are still in paying rates and staying long commodities and equity sectors that benefit from higher yields or oil prices—unlike last year, we see the opportunities in US equity indices coming mostly when the market worries about the growth and risk outlook.
I don’t know anyone who refers to it as a tango … I guess I ran in different circles. Let me know if you wanna dance…I’d love to watch!
As goes the bond bearishness so widely embraced by global Wall Street, there are even models created to support it. Here’s an update from MS,
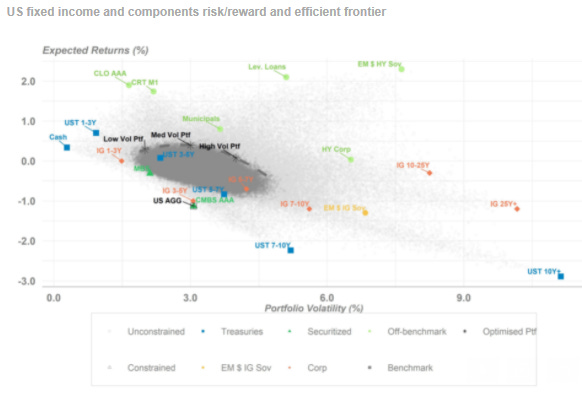
US Fixed Income Rotation Model (FIRM): 1Q22 Our fixed income asset allocation model (FIRM), based on Morgan Stanley strategists' forecasts, suggests that for better total return/volatility than the US Aggregate Bond Index, portfolios should be EW US Treasuries, EW EM $ IG, UW MBS, EW IG corporates and OW off-benchmark assets.
With our expectations for higher Treasury yields and wider credit spreads, expected N12M total returns are low across the board: Continued macro progress and expectations for policy tightening lead to our strategists forecasting US Treasury yields to rise through 2022. Together with expectations for wider spreads across most risk assets, N12M total returns are likely going to be low or negative for most US fixed income.
FIRM continues to favour short duration and low quality: The optimal portfolio aiming to maximise total returns while targeting similar volatility as US AGG is EW UST, EW IG EM sovereigns, UW securitized, EW corporate credit and OW off-benchmark assets.
Compared to six months ago, FIRM has lower exposure to corporates: The optimised portfolio has cut exposure in IG and HY corporates. Off-benchmark assets see the biggest increase in allocation, in particular CLO AAA, EM $ HY sovereigns and municipals; allocation to front-end US Treasuries has also increased.
Speaking of low duration and low quality, how about this note on STOCKS from Barcap,
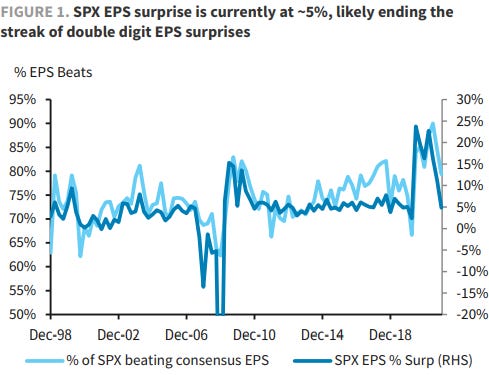
Equity Compass - Earnings not Surprising anymore SPX EPS surprise has been much lower than recent quarters due to falling Goods consumption. Margins also softened, driven lower by high input costs and diminishing accumulated inventories. The shift of focus from Omicron to Fed Hikes has Value better positioned than Growth, but we prefer to combine Value and Low Vol.
… Margins see biggest decline since start of the pandemic Although EPS surprise has fallen sharply for the quarter so far, Sales surprise has been consistent with recent levels (+2.8%). Assuming the level of EPS/Sales surprise holds for the rest of the quarter, SPX profit margins would have their largest QoQ decline (from 13.7% to 12.7%) since the start of the pandemic (Figure 8)
In closing, and from THIS DAY IN HISTORY (2008) files, THE (other)CATCH,