while WE slept; "Global bonds surge toward best month since 2008 financial crisis" and yet 'another hike unprecedented but NOT impossible'
Good morning … it would appear that Fedspeak …
Something Appears to Be Giving - Remarks by Christopher J. Waller
… I am encouraged by what we have learned in the past few weeks—something appears to be giving, and it’s the pace of the economy. Data for October indicated an easing in economic activity, and forecasts for the fourth quarter show the kind of moderation that is more in keeping with progress on lowering inflation. In addition, after watching core PCE inflation increase in September from its summer lows, the latest data showed inflation moving in the right direction in October, albeit gradually …
… and data …
ZH: Massive Downward Revisions For Conference Board Confidence Leave 'Present Situation' At April 2021 Lows
ZH: "Tremendous Economic Slowdown...High Rates Are Killing Us" - Dallas Fed Services Survey Tumbles Back Into Contraction
… combined …
ZH: Waller Whacks The Dollar: Dovish Fed-Hawk Sparks Bid For Bullion, Bonds, & Bitcoin
… And did so middle of the session ROBBING Mr. Market of whatever concession was to be had for yesterdays 7yy but then …
ZH: VIX, Yields Spike As Ugly 7Y Auction Buyers' Strike Sends Tail To One Year HIgh
… The internals were even uglier: foreign buyers (i.e. Indirects) took down just 63.9%, down sharply from 70.6% in October and the lowest since March. And with Directs also dropping from 18.4% to 15.9% (below the recent average of 17.2%), Dealers - who are mandated to buy no matter what - ended up with 20.3% of the auction, almost double from last month's 11.0% and the highest since last November…
… Overall, this was a piss poor auction, one which was ugly on all verticals, and a start reminder to the market that even if the US enters a soft landing - as today's dovish sentiment clearly hopes - there is still the issue of trillions and trillions in debt issuance on deck that will have a big problem getting funded at current levels.
… less than good auction aside, bond market has continued along its way, with BIG names betting on rate CUTS …
Bloomberg: Bill Ackman Bets Fed Will Cut Interest Rates as Soon as First Quarter
Investor sees risk of ‘hard landing’ if Fed doesn’t cut
Ackman said he has observed evidence of weakening economy
… The Pershing Square Capital Management founder said such a move could happen as soon as the first quarter. Traders are fully pricing in a rate cut in June, with the chance of a cut happening in May priced at about 80%, according to swaps market data…
… “What’s happening is the real rate of interest, which is what impacts the economy, keeps increasing as inflation declines,” Ackman said in an upcoming episode of The David Rubenstein Show: Peer-to-Peer Conversations…
… “I think there’s a real risk of a hard landing if the Fed doesn’t start cutting rates pretty soon,” said Ackman, noting that he’s seen evidence of a weakening economy.
… AND thanks largely TO these rate cut bets NOT being limited TO Ackman but rather spread far and wide, the entire bond market participating …
Bloomberg: Global bonds surge toward best month since 2008 financial crisis
There’s still some tension between the views of credit investors and rates traders, whose forecast of rapid Fed rate cuts seem to require a significantly harder economic landing.
A Bloomberg gauge of global sovereign and corporate debt has returned 4.9% in November, heading for the biggest monthly gain since it surged 6.2% in the depths of the recession in December 2008…
While Mr. Ackman’s TIMING of playing the rate cut GAME seems to be decent, the short covering continues (see more from Citi just below), a look at 10yy …
… momentum (stochastics, bottom panel) remains overBOUGHT and global bond markets reflecting the past several weeks where, for example, the 10yy has dropped better part of 70bps. Clearly an impact on POSITIONS and those thinking higher for longer … adding TO the buying, some hawk in doves clothing language by Wally and it begins to make sense.
Frankly, I believe BOTH arguments and think more tactically minded opportunities will present themselves — to be long AND short (see Ackman selling short in September and swaying populism towards LONGS given rate cuts NOW) as an example.
At days end the rate cut GAME is just that — a GAME which the Fed does not play and will prefer weeks and months maybe even QUARTERS more of data before weighing in. Meanwhile, WALLY says what he says and sparks a continued short-covering fuse…
… here is a snapshot OF USTs as of 705a:
… HERE is what this shop (different group than normal as they are travelling to the FAR East) says be behind the price action overnight…
… NY Open - Talk the talk
Central banks take center stage, allowing for a busy overnight session. While RBNZ held rates, they surprised markets by offering more hawkish messaging. NZD outperformed briefly, though retraced lower after the USD rally extended in the European session. AUD underperformed after Oct CPI miss. RBA Feb hike odds pare back, though ultimately Q4 CPI remains the key print (out in Jan). Bunds outperformed after state-level Germany and Spain CPI misses, which should be replicated in the national print at 08:00 EST. ECB Stournaras was quick to discourage earlier rate cuts, also noting an early end to PEPP QT would hurt ECB "credibility".UST rally continues, though lost slight momentum overnight. Fedspeak will be crucial rather than Secondary Q3 GDP data (08:30 EST). Mester features at 13:45, ahead of the Fed Beige Book release at 14:00. BoE Bailey delivers remarks at 10:05 EST. Otherwise, month-end could keep choppy market conditions. In EM, MXN awaits the Banxico inflation report at 13:30 EST. THB saw a rate hold, though growth forecasts were revised lower.
… and for some MORE of the news you can use » The Morning Hark - 29 Nov 2023 and IGMs Press Picks (who CONTINUES to be sportin’ that new, fresh look) in effort to to help weed thru the noise (some of which can be found over here at Finviz).
Moving from some of the news to some of THE VIEWS you might be able to use… here’s SOME of what Global Wall St is sayin’ …
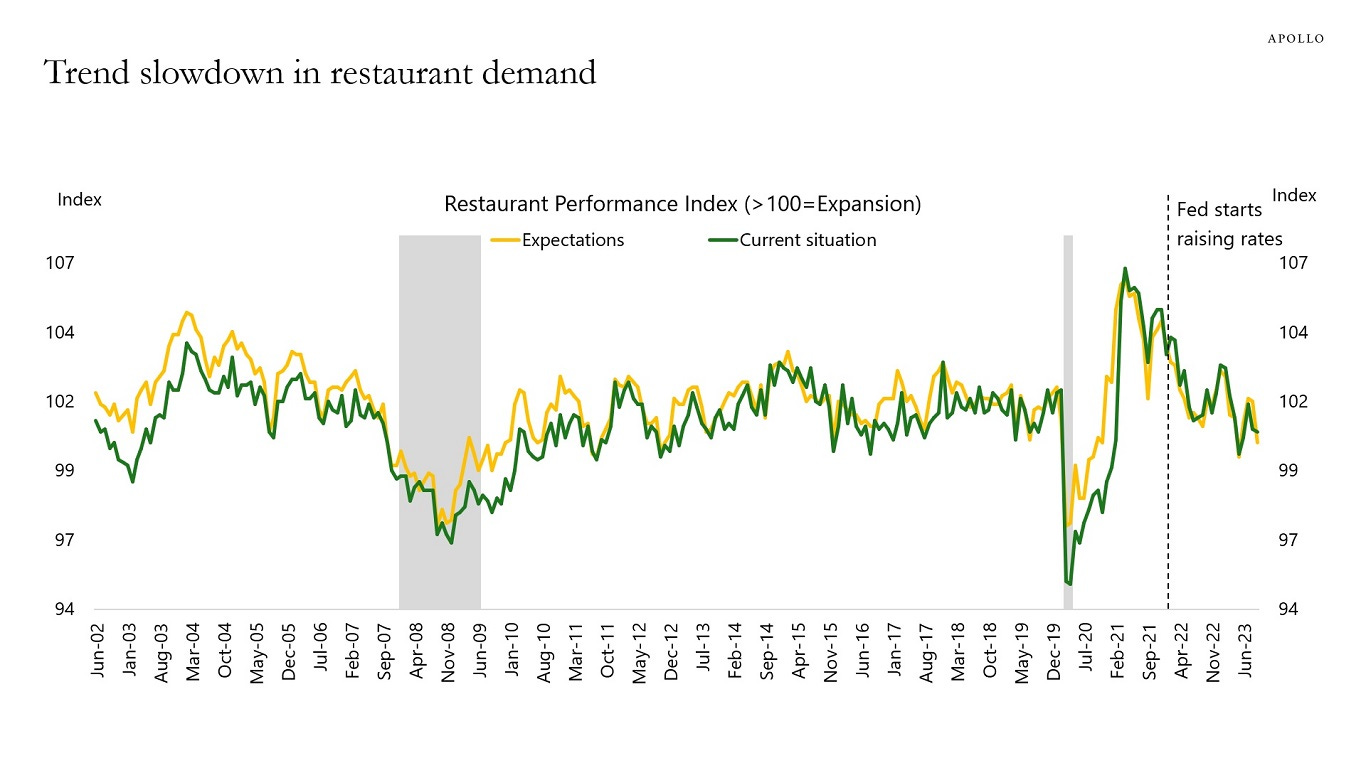
Apollo: Restaurant Activity Starting to Slow (fed WINNING)
Indicators of restaurant activity continue to show signs of weakness, see chart below. This is not surprising. The Fed is trying to slow down the economy, and weakness is now starting to appear in consumer services.
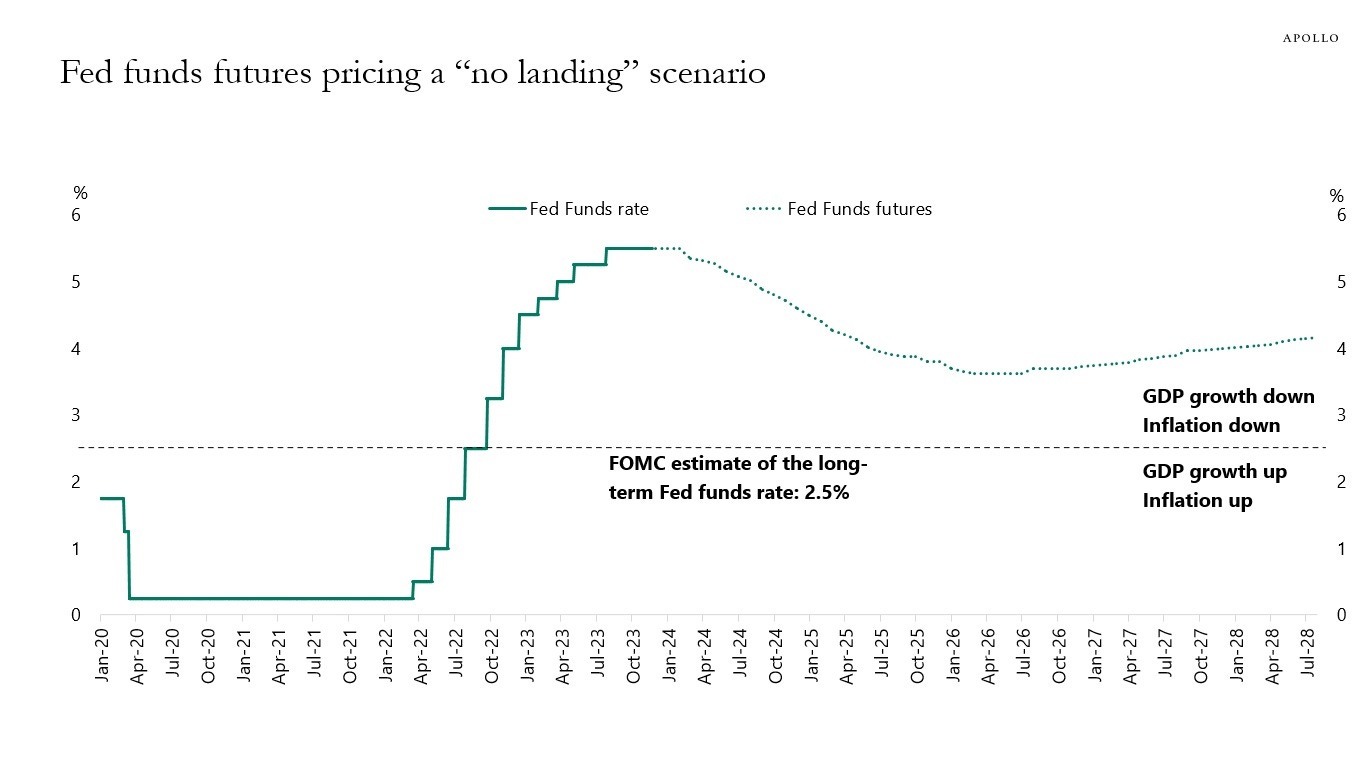
Apollo: Fed Funds Futures Pricing in "No Landing" (cuz, you know, it’s gonna be different this time?)
Fed funds futures show that the market is currently pricing that the Fed funds rate over the next five years will bottom at 4% and then slowly start to rise again, see chart below.
In other words, the market is pricing that monetary policy will remain restrictive and above r-star (2.5%) for the next five years. Put differently, the market is currently pricing a “no landing” scenario where monetary policy will have to put downward pressure on GDP growth and inflation for the next five years. In short, the market is extremely bullish on the economic outlook over the next five years.
A different way to look at current Fed pricing is to compare Fed funds futures to the longer-run dot in the Fed’s dot plot, which shows that the FOMC expects the Fed funds rate in the longer run to be 2.5%.
The bottom line is that the FOMC and Fed estimates of r-star are saying that the Fed funds rate will move down to 2.5%. But the market disagrees and says that rates will stay around 4% for the next five years, see again the chart below.
Barclays: September house prices push higher again (?)
Both the FHFA and S&P CoreLogic CS 20-City measures of house prices posted gains in September, rising 0.6% m/m and 0.67% m/m, respectively. Both indexes continue to grow past their July 2022 peaks and show no signs of slowing.
Barclays: November consumer confidence shows optimism of the future
The Conference Board's index of consumer confidence increased to 102.0 in November, due to increased optimism about future expectations. This increase has now broken the three-month string of declines in confidence after recently peaking at 114.0 in July.
Barclays: Equity Strategy - Who Owns What: Less short, but still plenty of dry powder
Falling rates have prompted short covering and real money buying of equities. Rally looks exhausted, but overall equity exposure is only about neutral and cash holdings are high. Although a soft landing feels consensus, poor MF returns in Nov suggest positioning is defensive and pain trade remains to the upside into '24.
BNP: Global rates: Year-end liquidity, and beyond!
Year-end pressure on banks has come off considerably, supported by a combination of the bank capital picture and muted QT impact on reserves.
Additional relief is likely to be limited, however; signs of a collateral imbalance are starting to show, corresponding to some premium in US funding markets. Meanwhile, the ECB’s imposed 0% remuneration on required reserves will likely act as a cap.
The move higher in front-end EURUSD xccy bases and EUR repo rates looks durable amid a sharper contraction in EUR liquidity and building EGB supply.
Into and beyond 2024, Treasury supply should still meet a more leverage-reliant, price-sensitive buyer and keep upward pressure on secured funding costs.
Citi: The Structural Short Squeeze (helping understand WHY global bonds having best month since ‘08)
Structural short squeeze dominates with more than $15m of short closed out in USTs as key technical levels were breached. Tactical positioning is now extended long (at $32m / 85th percentile) and structural position in move closer to neutral. Trading from the long side with recent longs onside above 109-00 in TYs
DB: Early Morning REID (on Waller)
… The main catalyst for this bond rally were comments from generally hawkish Fed Governor Waller, who said that he was “increasingly confident that policy is currently well positioned to slow the economy and get inflation back to 2%”. His off the cuff Q&A responses even suggested cuts were potentially possible in H1 if inflation behave as he thinks it could. So surprisinginly explicit. That was taken as another sign that the Fed were done hiking rates, and investors moved to price in a noticeably more dovish path for rates over the year ahead. For instance, the chance of a rate cut as soon as the March meeting rose from 16% to 35%, and the chance of a cut by May was up from 58% to 86%. And if you look at 2024 as a whole, the amount of cuts priced in was up from 89bps to 103bps following those comments. A reminder from our World Outlook that we expect 175bps of rate cuts in 2024 and a big rally down to 3.15% for 2 year yields. But this is more on the recession view rather than a soft landing one that markets are pricing…
DB: 2024 Rate Outlook: Priced for perfection
We expect 10Y UST to decline to 4.05% and 10Y Bund to remain broadly unchanged around 2.6% at the end of 2024. The most salient feature of our forecast is a significant steepening with 2Y UST declining to 3.15% and 2Y Bund declining to ~2%. As markets are already pricing a soft landing close to perfection and term premia remain too low, the risk reward for steepeners is attractive, notwithstanding the current uncertainty about the timing of an easing cycle. On the other hand, the BoJ is significantly behind the curve in tightening policy. The more the easing cycle in the US is delayed, the more likely it is that the BoJ will have to hike interest rates substantially more than currently priced.
DB: US rate futures during Fed pauses
We’ve written recently on policy rules (here and here), arguing that if the unemployment rate rises materially above 4% with inflation heading convincingly towards 2%, the Fed will cut rates next year much more aggressively than the market is pricing. Based on that view and DB’s forecast of a mild US recession that brings unemployment to 4.6% by mid-next year, we like SOFR H4-U5 flatteners.
For context around this, today’s chart looks at historical returns to interest rate futures, showing the difference (in bps) between the implied rate on the 6-quarter-ahead Eurodollar futures contract and realized 3m LIBOR at contract settlement six quarters hence. A positive value indicates that rates realized below futures pricing – i.e., a positive payoff to being long the futures contract.
The chart shows a clear pattern, with realized returns rising as the Fed finishes hiking (grey shaded area) and moves into a pause and then cuts (blue shaded area). The reason: the market under-prices the extent of subsequent Fed rate cuts, reflecting some combination of forecast errors and risk premia.
The red dots indicate returns to positions established four months into a pause – roughly where we are now if, as we expect, the Fed is done hiking. Across historical cycles, realized returns at that point ranged from 47bps to 448bps and averaged 220bps. Given the degree of cuts the market is already pricing we don't expect returns that large this cycle, but our modal forecast for the fed funds rate in Q2 2025 is about 115bps below OIS.
DB: Mapping Markets: The treacherous path to a soft landing (thematic from Apollo and DB)
In some ways, market pricing looks fairly benign for 2024. For instance, inflation swaps show that CPI is expected to continue its path back to target in the US and Europe. And both the Fed and the ECB are seen cutting rates in Q2, followed by a steady pace of cuts over the rest of the year.
That optimism has helped support a major market rally in November. But as we’ve been writing a lot over the last couple of years, a soft landing is likely to prove a tricky process. Plenty of obstacles are still in the way, and it’s important to remember that market pricing reflects an average path between various outcomes, and some of those look quite different from the baseline scenario.
Navigating this difficult path to a soft landing has been a consistent story over 2021-23. In 2021, the surge in inflation was a significant surprise that few had anticipated at the start of the year. Then in 2022, that inflation proved far more persistent than the consensus had expected, meaning that central banks launched one of the biggest tightening cycles in decades. Then in 2023, although growth surprised on the upside, the Fed didn't deliver the cuts that markets had priced at the start of the year, with monetary policy still in restrictive territory and concerns about a recession remaining elevated.
So as we approach 2024, we look at some of the potential risks around current market pricing.
1. The first risk is that we see a sharper deterioration in growth, as per our latest World Outlook, which expects a recession in the US and the Euro Area.
2. A second scenario is if growth surprises on the upside, broadly as happened in 2023.
3. A final risk is if inflation remains more persistent than expected, rather than continuing its decline back to target.
… So even as markets hope for a soft landing, it's worth bearing in mind that getting there is likely to prove difficult. After all, the story of the last 3 years has been this cycle playing out very differently to expectations.
Goldilocks: Consumer Confidence Increases More Than Expected
BOTTOM LINE: The consumer confidence index increased by more than expected in November—led by a rise in the expectations component, while the present situation component edged down—and the October level was revised down. The labor differential edged up.
JEFF: Nov Consumer Confidence Shows Resilience, Bouncing Off 16-Month Low
Key Points
■ The headline confidence index from the Conference Board showed a m/m sequential increase for the first time since July 2023 as it improved to 102.0 from 99.1. The downwardly revised October reading is now the weakest since July 2022.
■ Slowing inflation and a solid labor market are supporting confidence and preventing further decline, but the pace of improvement in the inflation picture has been frustratingly low.
■ The downward revision to the October data may also have reflected some late responses that were dragged down by the outbreak of the Israel-Hamas war.
■ Inflation expectations for the next 12 months fell to 5.7%, marking the 6th month in which the measure printed between 5.7% and 5.9%. This is the lowest level since October 2020 but still inconsistent with the Fed's 2% target and indicative of a loss of disinflationary momentum.
■ The labor market differential improved to +23.9 from +23.8, which was the weakest reading since April 2021. The response rate for "Jobs Hard to Get" rose to 15.4 from 14.1, hitting the highest level since March 2021.UBS: Consumer Confidence Stabilizes
Existing home prices continued to trend upward in September
Conference Board confidence measure increases moderately, but consumers still disconsolateRichmond Fed manufacturing index falls back in November
Services business activity remains soft in the 5th district tooUBS: Rising confidence the FOMC has done enough
Increasing confidence in the current stance of policy
Federal Reserve Board Governors Bowman and Waller delivered speeches today in which they offered divergent views on the economic outlook and the appropriate path of monetary policy. However, Governor Waller appears increasingly confident the FOMC has done enough, and Governor Bowman's support for additional rate hikes is becoming more conditional. Both reiterated their commitment to closely watch incoming data before committing to future rate decisions. We briefly previewed this week's speaker lineup last week, and both appeared to take comfort in the progress revealed in the incoming inflation data but stopped far short of declaring victoryHawks getting on board with broader message…
Wells Fargo: Slipping Confidence Finds Foothold With First Rise in Four Months
Summary
An uptick in November puts consumer confidence at just 102.0, its second-lowest reading of the year. The move was largely driven by expectations and offered a mixed take on the labor market. Still, recession expectations receded and consumers have not put off their big holiday shopping plans.Yardeni: Loose Fed Lips Sink Yields (Waller)
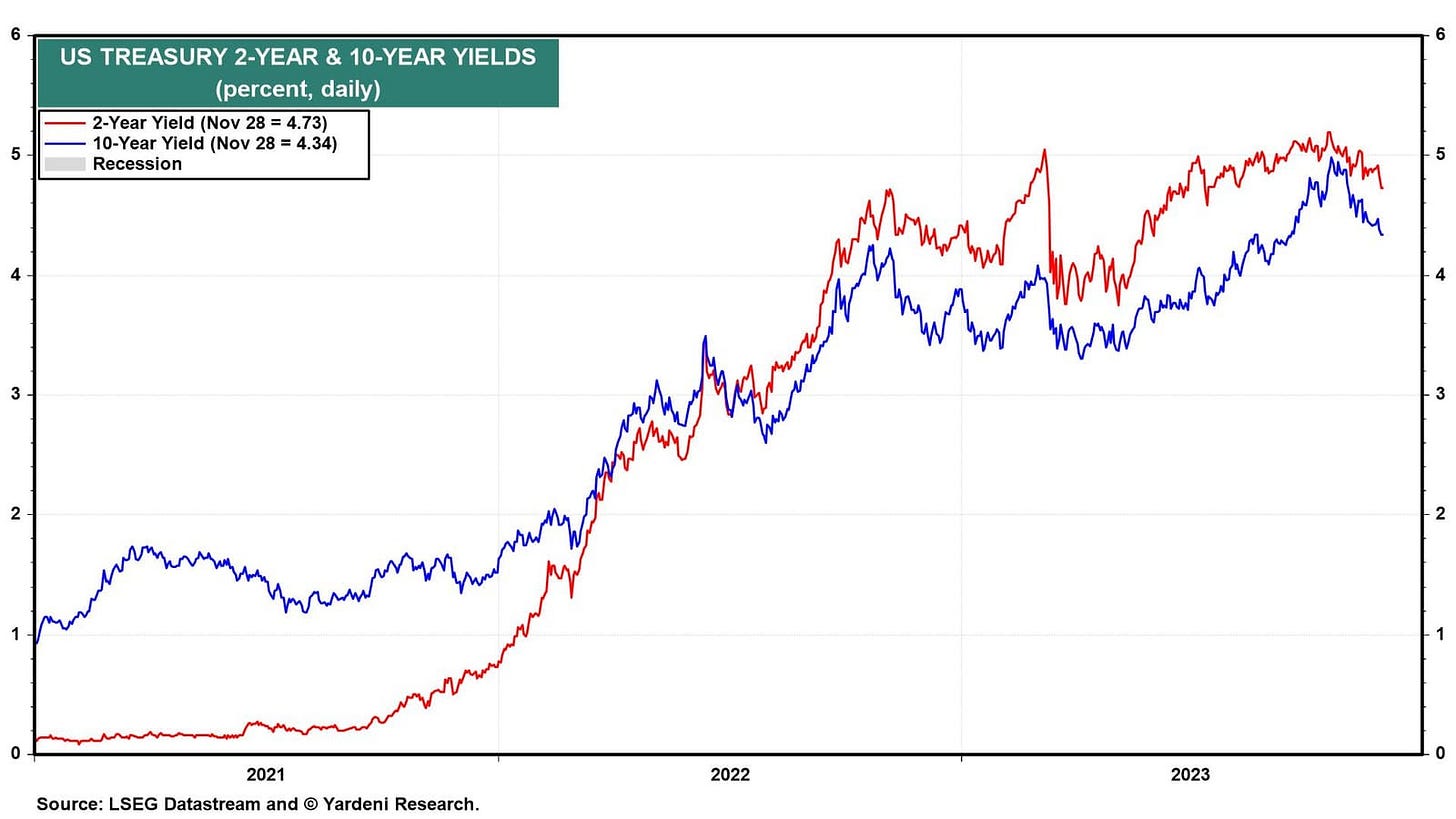
Not much happened in the stock market today even though the 10-year bond yield fell to 4.34% from a high of 4.98% on October 19 (chart). The 2-year yield sank to 4.73%, the lowest since July 17.
This morning, Fed Governor Christopher Waller warned that inflation is still too high. But he also said that if inflation continues to cool “for several more months—I don’t know how long that might be—three months, four months, five months—that we feel confident that inflation is really down and on its way, you could then start lowering the policy rate just because inflation is lower.” Waller said that in remarks at the American Enterprise Institute in Washington, D.C. “It has nothing to do with trying to save the economy or recession,” he added.
… And from Global Wall Street inbox TO the WWW,
Bloomberg: Another Fed Hike Would Be Unprecedented, But Not Impossible
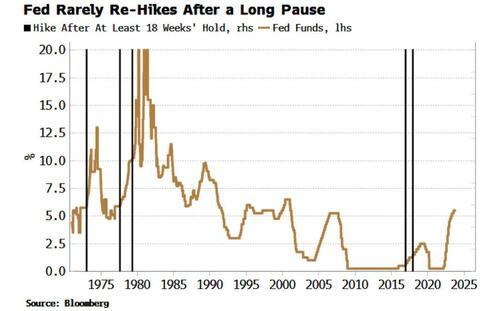
… The Fed last hiked its policy rate on the July 26, 18 weeks ago. It would be rare for the central bank to hike rates again after such a lengthy pause. There have been five occasions since 1971 when the Fed has done so (specifically, hiked rates after a pause of at least 18 weeks when the last move was a hike).
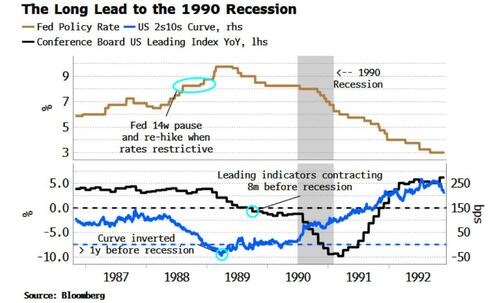
But when rates are already restrictive as they are today, it would be unprecedented. The longest the Fed has held rates after last hiking them, and then raising them again when rates are already restrictive - i.e. when the real Fed rate is greater than the neutral rate (using the Holston-Laubach-Williams estimate) – is 14 weeks, between August and November 1988.
This was another time when there was a long lead into the next recession, with several reliable signals flagging a contraction many months or years in advance. As the bottom panel of the chart below shows, the yield curve was inverted more than year before the recession began in July 1990. The Conference Board’s Leading Index was contracting at least eight months before the slump.
Nonetheless, the Fed resumed its hiking cycle, taking rates from 8.25% to a peak of 9.75% in 1989. They were then cutting them for over a year before the recession finally began. Ten-year yields continued to rise on net through 1988 and into the first quarter of 1989 as inflation began to re-accelerate…
Bloomberg: Charlie Munger wrote his own best eulogy (Authers OpED with visual of 2yy and one of rate bets and GOLD …)
… What was so exciting? Christopher Waller, a Fed governor, said policy appeared tight enough to contain inflation. New York Fed President John Williams said he was “encouraged” that “the inflation trajectory has turned.” Fed Governor Michelle Bowman suggested her support for additional tightening was growing more conditional, but made a hawkish warning:
We should keep in mind the historical lessons and risks associated with prematurely declaring victory in the fight against inflation, including the risk that inflation may settle at a level above our 2% target without further policy tightening.
Taken together, the Fed seems to be letting everyone know that more hikes are probably not in the pipeline. That had the kind of effect on short-term bonds that might be expected — this chart was drawn by my colleague Felice Maranz:
What’s more contentious is the apparent sentiment that by going squishy on the prospects for more hikes, the Fed is letting us know that cuts will soon be here. Personally, I don’t see any strong hints to that effect, but others plainly did. This chart grasps the fed funds futures market’s implicit expected rate as of the January 2025 meeting (as calculated by the Bloomberg World Interest Rate Probabilities function) against the gold price. The market is back to thinking that fed funds will get below 4.2% by then, an opinion it appeared to have left behind in August. Meanwhile, gold has blasted sharply higher:
Bloomberg: If QT Is Doing This, No Wonder Stocks Are Rallying (this requires a couple reads to grasp as many have had an EXCELLENT YEAR this November — one of the best Novembers on record, to boot!!)
Authored by Simon White, Bloomberg macro strategist,
Quantitative tightening isn’t working. At least not in the way you’d expect it to, with central-bank reserves rising, not falling. On top of that, excess liquidity remains high and is increasing, while rates are becoming less restrictive. Stocks have thus been rallying, and will continue to experience tailwinds as long as liquidity conditions remain favorable.
Soft, hard or no landing?
When it comes to stocks, at least in the medium term, it matters little. What does matter is liquidity, and its recent rise explains one of the best November performances in the S&P over the past 90 years.
Liquidity conditions have been improving in three key ways:
central bank reserves,
excess liquidity,
and the restrictiveness of rates.
With no sign that any of them is about to turn much lower imminently, stocks will continue to enjoy supportive liquidity tailwinds once the current overboughtness has been worked out.
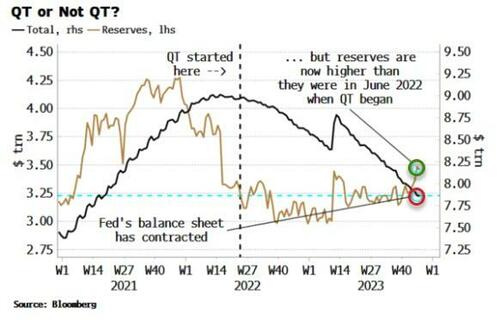
The rise in reserves is the most surprising. The Federal Reserve began QT in June 2022; since then, its balance sheet has contracted by more than $1 trillion to sit at just under $8 trillion. But reserves, which underpin deposits and the liquidity of the banking system, are now higher than in June last year.
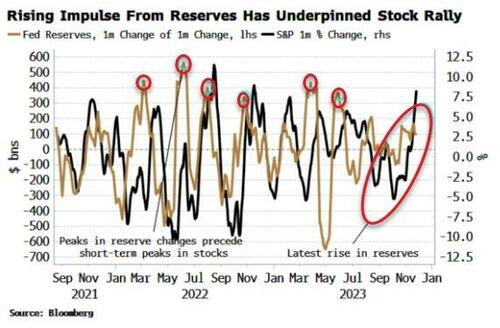
The change in the change of reserves typically leads the one-month performance of the S&P (as shown in the chart below). Reserve growth began to accelerate about a month ago, the same time as when the market began to rally.
The key factor leading to rising reserves despite ongoing QT is the government’s decision to fund a significant proportion of the fiscal deficit using T-bills. Make no mistake: if they had not, risk assets this year would have been in a much more precarious spot.
Funding much of the deficit using bills as opposed to longer-term debt has allowed money market funds (MMFs) to absorb the new supply of government debt. The Fed’s higher-for-longer message has kept the rate on bills higher than the rate on the reverse repo facility (RRP), meaning that MMFs have been incentivized to draw down on the RRP to buy bills.
If, instead, a non-bank corporate or a household were to have bought the bills, reserves would have fallen as they would have had to use bank deposits to pay for them. MMFs drawing down on the RRP, on other hand, mitigates the fall in reserves.
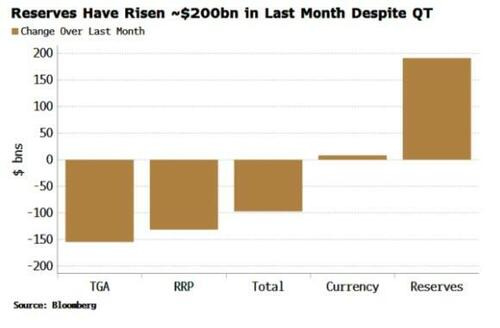
We can see how the liabilities on the Fed’s balance sheet have changed over the last month in the chart below. The fall in the RRP of ~$130 billion more than offsets the ~$100 billion fall in the total size of the balance sheet, driven by QT as the Fed reduces the amount of assets it holds. That would mean about a $30 billion rise in reserves.
But reserves are in fact up much more than that as they have been boosted by the $150-$160 billion fall in the Treasury’s account at the Fed (the TGA). When the Treasury draws down on the TGA, reserves rise.
The resulting almost $200 billion rise in reserves has been a formidable tailwind for stocks over the last month.
Further, with the Treasury’s most recent quarterly refunding announcement the government implied they would continue skewing issuance towards bills, meaning that with still ~$1 trillion in the domestic RRP this dynamic can continue for the time being. This is a pro-cyclical fiscal deficit on speed.
Adding to stock tailwinds is excess liquidity – real money growth minus economic growth of the G10 countries in dollar terms – which continues to rise. By now it might have been expected to start rolling over, but there is little sign of that yet. Buoyant excess liquidity conditions since around March this year have been a key driver of this year’s stock rally.
Excess liquidity is the growth in liquidity “excess” to the needs of the real economy, and therefore available to support risk assets. Slowing growth, falling inflation and a weaker dollar have all boosted excess liquidity this year.
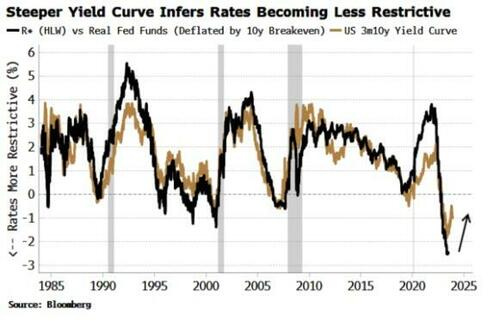
Also beneficial for stocks has been the easing in the degree of the restrictiveness in rates. The Fed has been on hold since July and the market is pricing in more rate cuts for next year. The yield curve has thus been steepening.
As the chart below shows, the yield curve is a close analogy of the degree of restrictiveness of the Fed’s policy rate (notwithstanding the vagaries of pinning down the neutral rate; here I have used the Holston-Laubach-Williams estimate). The yield-curve’s steepening is consistent with the real Fed rate becoming relatively less restrictive.
These are pretty benign conditions for stocks, and there are few obvious signs any of them - reserves, excess liquidity or the restrictiveness in short-term rates - are about to markedly deteriorate in the very near future.
Whether the US faces a near-term recession or not will ultimately be important for the path of stock prices, but in the interim liquidity conditions will offer one of the first clues as to when equities are about to face a harder ride.
InvestOpedia Chart Advisor: Discovering Actionable Charts (bonds have more fun)
1/ This Time is Different
There aren’t too many times when one can observe the markets and truly, authentically state that “this time is different,” but… this time is certainly different when it comes to the interest rate and bond markets.For years, I’ve been talking to our clients about how, “One day, rates are going to stop trending down, and when they do, not only is it going to be painful for borrowers, but more importantly, it’s going to be painful for late-career working professionals and retirees who have been taught all their lives that “bonds are safe.”
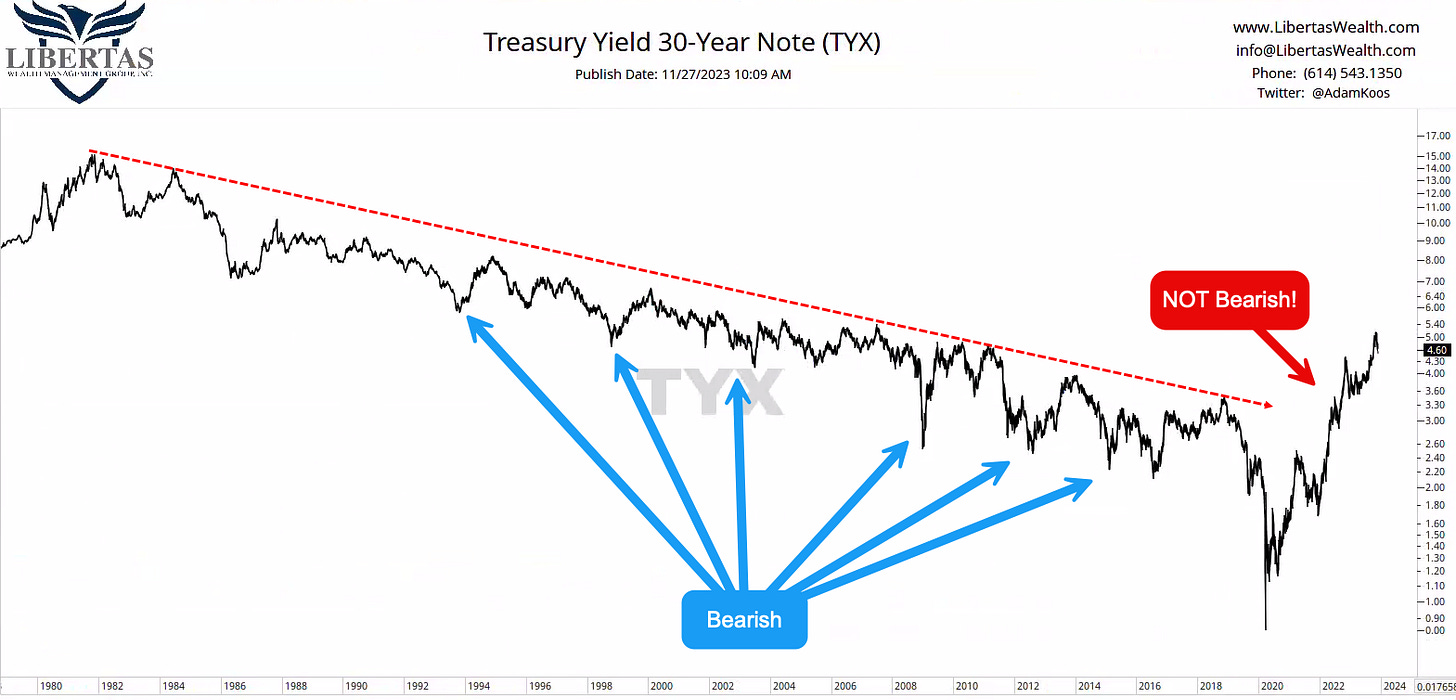
The chart above is the 30-year Treasury Yield – so think, “government bonds with a 30-year maturity.” My 4th grader can look at this chart and see that, over the course of four decades, rates trended down with brief mean reversions back to the trendline…
…but things are different now, and we all know that rates have been driven higher by the Fed and inflation. The problem is, of course, that rates have been going up for more than two years now, but most investors haven’t been paying attention. Instead, their 60/40 portfolios have been decimated, not only because stocks have gone down, but moreso due to the vaporization of money in the bond market.
When a “balanced” portfolio is down -37% in 2022, and the reason is “Well, bonds were down a lot,” is that a satisfactory explanation?
2/ Ever Since Covid...
In the chart above, I zoomed in on the same 30-year Treasury yield in the previous chart, but now we’re looking at it since the COVID bottom.
Notice how there have been brief periods of time over which an investor might’ve thought to themselves, “this is the top in rates, now bonds will be safe again,” but that simply wasn’t (and still isn’t) the case.
Even now, as Jerome Powell and the Fed hint at pausing rate hikes, there is still too much economic uncertainty to know for sure whether we’ve seen an intermediate-term high in rates, or if this is just another pause before a new climb higher.
Look at the chart – can you tell whether or not this is the big peak in rates?
3/ Bond and Rates
4/ A Divergent Weekly ChartLPL: Who is Going to Buy Bonds? Pension Funds
… The Milliman 100 Pension Funding Index chart below shows pensions, in aggregate, are overfunded (104.2% of target), which means the value of their assets are currently more than their liabilities. Prior to 2022, pension funds were generally underfunded so to help fill those deficits, plans were generally overweight equities. In theory, fully funded pension plans de-risk portfolios by selling equities and buying bonds to lock in a more certain return stream and to lock in higher yields that can be used to offset/cover future liabilities. So now that plans are running surpluses, pension investors have been net sellers of equities and buyers of corporate bonds, which has helped support prices.
Demand for these higher yields comes at a time when high grade corporate bond issuance remains muted. Many corporations termed out debt in 2020, i.e., they issued a lot of debt at very low interest rates for long maturities. As such, high grade corporations, in general, don’t need to access the capital markets anytime soon (2025 will be a large year for maturities). Thus, supply of new bonds remains below historical averages.
As such, positive demand to go along with muted supply should provide stability for prices within the category. While our preference has been to stay in the short-to-intermediate parts of the corporate credit universe, with the Federal Reserve likely done raising rates, extending duration and locking in high yields for longer may make sense for those investors with longer time horizons.
AT NautilusCAP (they report, YOU decide but a GREAT hot take on 100dMA)
#10year #yields Chatter about U.S. 10-year yields crossing below their 100-day MA - here are the numbers in case anyone is interested.
In closing, this regularly scheduled spammation will be placed on HOLD tomorrow due to travels AND should, in theory, resume on Friday (and hopefully on into the weekend, ‘weather’ permitting).
IF you should require a refund, just ‘have yer girl reach out to my girl’ and something will be arranged. Sorry. Not sorry.
AND finally, as holiday deals (not unlike the TV situation at Target — look it up) loom large into end of the year, AND as we’ve just passed Small Business Saturday (a holiday brought to you BY AMEX but one which I fully endorse) …
AND … THAT is all for now. Off to the day job…











I've recently learned a lesson in NFL bubbles: being in the 'NorCal' area, after the SNF 49er beat down of 'deem BOYS', the niners going undefeated this season was all the rage....at which point I was getting that nagging feeling on the back of the neck....
And all this poppycock talk of Goldilocks, perfectly priced markets & rates of late, I'm getting that back of the neck feeling again....
Will read soon...
Posting this:
https://www.dickmorris.com/why-hamas-invasion-is-turning-point-for-election-24/