… The eurozone economy is quite like the water quality of the Seine: some days it may look okay but overall it’s poor enough to continuously worry about it. For the European Central Bank, this means that rate cuts very much continue to be on the table as domestic demand is unlikely to cause much of an inflation push.
AND as it nearly months end where there will surely be some demand for duration, a quick peek at 10s …
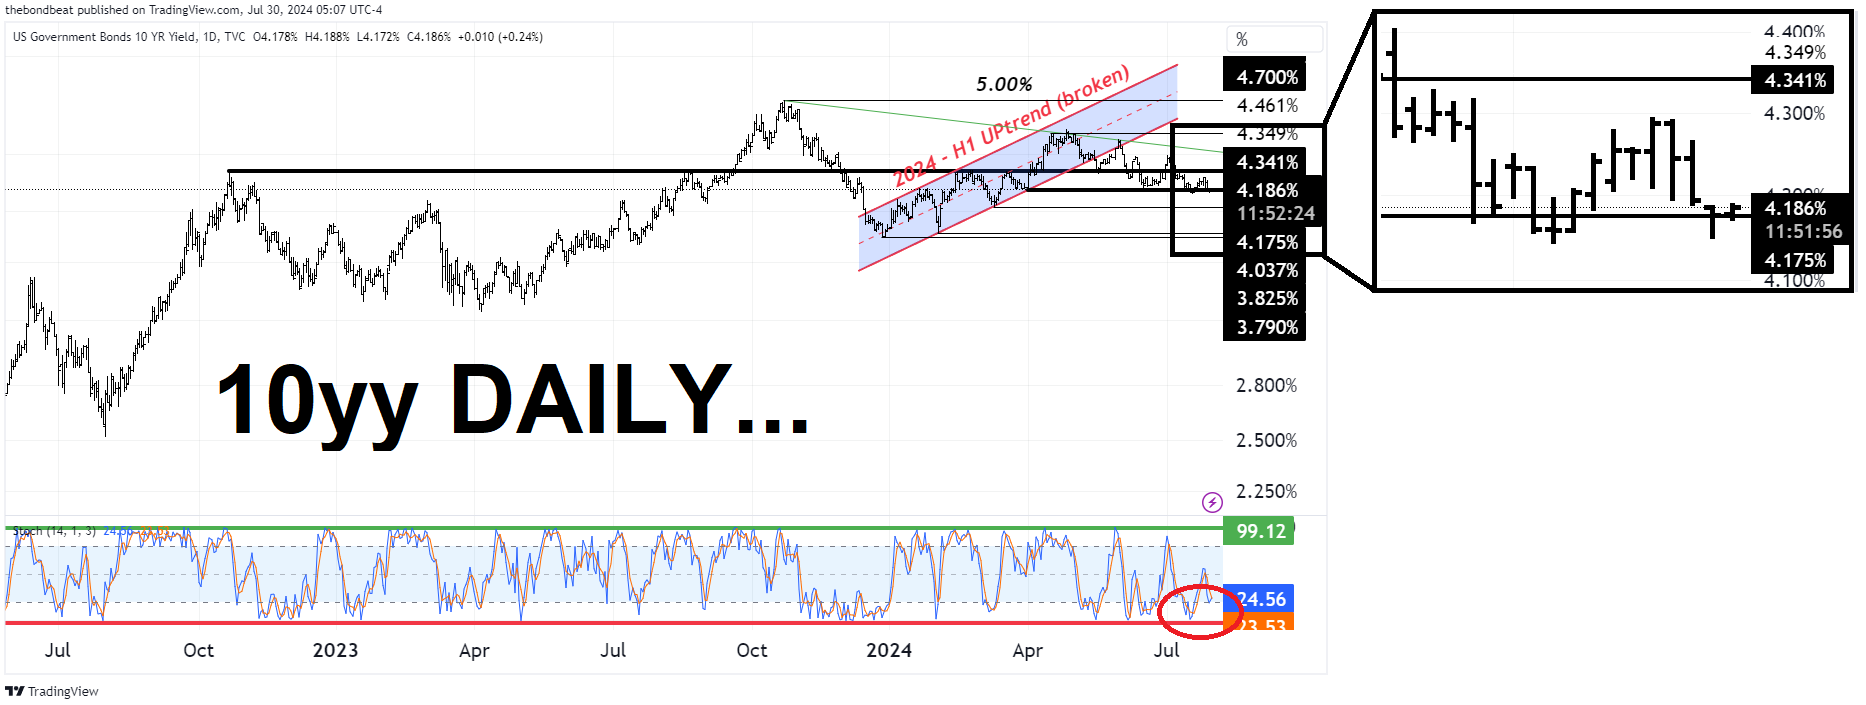
10yy: a bullish break towards 4.00% close at hand …??
… I’m watching 4.34% on the ‘downside’ and, well, 4.18% — here and now — with a trade slightly lower opening the door TOWARDS 4.00% (just another TLINE drawn off the 2024 H1 UPtrend in yields) … NOT impossible but momentum already leaning overBOUGHT, would definitely take / need some sorta surprise …
… for a bit MORE and a healthier look out the curve, you’ll wanna keep scrolling for some insights from the best ‘techAmentalists’ out there (CitiFX).
For now, I’ll ask if you heard the ‘good news’?
The rate at which we’re sinking further into debt may … MAY … be slowing somewhat! By now you’ve heard …
Bloomberg: US Cuts Borrowing Estimate, Sees Smaller Cash Buffer at Year-End
US Cuts Borrowing Estimate, Sees Smaller Cash Buffer at Year-End
December $700 billion cash estimate precedes debt-cap return
Dealers had expected current-quarter borrowing to be trimmed
… I see a h’line that reads CUTS BORROWING and I am programmed to think GREAT NEWS, lower rates ahead, buy buy buy … but before getting all worked up and excited … one realizes it’s SPIN by the media and … well …
ZH: Treasury Estimates $1.3 Trillion In Borrowing Needs For The Remainder Of 2024
… And at exactly 3:00pm the Treasury published the anticipated numbers, which came close to our estimates for Q3, but well above our forecast for Q4, specifically:
Q3 funding needs were revised lower to $740 billion (just below our forecast of $750 billion) from $847 billion projected last quarter. According to the Treasury, the borrowing estimate was "is $106 billion lower than announced in April 2024, largely due to lower Federal Reserve System Open Market Account (SOMA) redemptions and a higher beginning-of-quarter cash balance." In other words, the slower QT taper is primarily responsible for the lower funding needs. The Treasury also kept its quarter-end cash balance estimate unchanged at $850 billion.
Q4 funding needs (released for the first time) are estimated at $565 billion, $115 billion above our estimate of $450 billion, which is quite a bit higher obviously than expected, but which is also due in part to the higher TGA estimate of $700 billion vs our assumption of $650 billion.
In summary, the Treasury expects to borrow just over $1.3 trillion by year-end (although this number will end up being much higher if Trump becomes president and the US "unexpectedly" collapses into recession in the first days of the new presidency).
There's more, because while the Treasury projects $850BN cash balance at end of Q3, this number then drops to $700BN at end of Q4 (which is above our estimate of $650 billion) and since the streetwide estimate for Q3 end of quarter cash was ~$650BN, this suggests that the real funding needs (on an apples to apples basis) is actually $515BN, which is modestly above the median Wall Street estimate. For context, JPMorgan expected a Q4 marketable debt borrowing need of $496BN, while Wrightson was on the high end at $670 billion.
… Bottom line: contrary to its activist tactics to boost the market and to front-load debt needs, this quarter the Treasury reported numbers that came in line with expectations for Q3, and slightly above blended estimates for Q4.
Then again, the real question should be not what the Treasury projects for Q3 and Q4, but Q1 which is when as we now know Biden will finally leave the White House forever, and be replaced by either Trump or Kamala (or Big Mike) and when all the lipstick on this pig will finally wash off.
… Never mind. TRUST (everything … you read) but VERIFY.
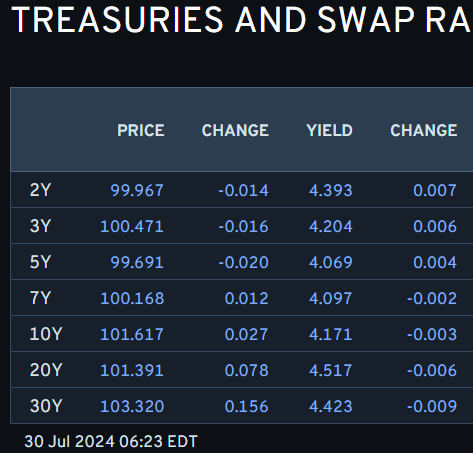
In fact, I’ll just quit while I’m behind and am thankful Global Wall has so much to say and so I’ll share. But first, here is a snapshot OF USTs as of 623a:
… and for some MORE of the news you might be able to use…
Finviz (for everything else I might have overlooked …)
Moving from some of the news to some of THE VIEWS you might be able to use… here’s SOME of what Global Wall St is sayin’ …
ABNAmro: FOMC Preview – Increased confidence on inflation, patience running out | Insights newsletter
The FOMC will keep its key policy rates on hold this week, but will start paving the way for a September rate cut. In recent months the balance of risk between price stability and full employment has shifted towards a more even stance. While inflation is generally coming down in line with expectations, and growth continues to surprise to the upside, signs of a weakening labor market are becoming increasingly clear, leading to an increasing amount of calls for a rate cut as early as this July meeting.
CitiFX: US rates: A big week (bonds ahead of months end…)
Weekly techs developments in US rates are significant, though given the number of major risks events this week, we prefer to wait for weekly close to confirm. If seen, we could see a ~28bps move lower in 2y yields, and ~15bps for 10y yields. We also highlight short term support and resistance levels to watch
US 2y yields Yields have closed weekly below the 4.40% support level that we were watching (March 2024 low). This also happens while we posted a bearish outside week. This opens up a 28bps move lower towards 4.12% (2024 low), though we do note the large number of event risks ahead that could turn the narrative. Another weekly close lower would add to the case for lower yields.
On the flip side, resistance will first be seen at 4.54-4.55% (March 27 low, recent high). We also keep a close watch on weekly slow stochastics, which is in 'oversold territory'. A cross higher would suggest a pause in downward momentum.
…US 30y yields Yields are still hovering around the 55w MA (4.44%), still having failed to close decisively lower on a weekly basis in recent weeks. IF we see a decisive close below 4.33%, the main support level, (March 28 low) on a weekly basis, it would open a move towards 4.19% (March 2024 low)
Weekly slow stochastics is on the verge of crossing higher, and is holding just above the oversold territory.
…With much to look forward to, the one event that did happen yesterday was the latest QRA borrowing estimates from the US Treasury. The borrowing estimate for Q3 was revised down from $847bn to $740bn, effectively in line with our US rates strategists’ expectations (here), while the Q4 borrowing estimate ($565bn) was slightly above their expectation. In any case, this did little to move markets unlike the shock of a big increase in supply this time last year. Longer dated yields rallied by a touch over 1bp on the announcement, with 10yr yields falling -2.0bps on the day. By contrast, 2yr yields ended the day +1.7bps higher at 4.40% …
As we approach this week’s FOMC (DB preview here), optimism has again been building that we’re about to embark on a notable Fed easing cycle. Over the next 18 months to January 2026, markets are now pricing in exactly 175bps of cuts - which is the most since early March.
As you can see from the CoTD, such a degree of easing over an 18-month period has only previously been associated with recessions, apart from during the mid-1980s when real rates were still extremely high given the legacy from the late 1970s/early 1980 Volcker tight policy cycle. So there was structural room to cut rates from highly restrictive territory outside of the usual business cycle needs.
So there are three possible outcomes from here.
For the 8th time in this rate cycle, the market has jumped the gun on a dovish pivot and we eventually see this pared back. DB economists see three rate cuts before year-end but then a pause until September 2025, and a final two cuts in December 2025 and March 2026. So DB expect 125bps to the market’s 175bps over the next 18 months. See our econ team’s rationale for their rates view here.
The level of easing only happens because we eventually see a recession.
Due to the peculiarities of the Covid cycle, we find we can ease rates by the amount the market is expecting without a recession. The perfect soft landing.
In our premium research over the last few months, we've done a lot of analysis comparing the launch of ChatGPT and the AI Boom that has ensued with other major technological advances over the last few decades.
One of the most correlated periods to now in terms of the Nasdaq 100's performance was the launch of the modern web browser (Netscape) back in late 1994.
As shown in the chart below that was included in our latest Bespoke Report newsletter, if we tie the release of ChatGPT in November 2022 to the release of the Netscape web browser in December 1994, the Nasdaq 100 is up about the same amount, and we would currently be around August 1996 on a time scale.
What's interesting about August 1996 is that we'd be about four months away from Fed Chair Alan Greenspan's famous "Irrational Exuberance" comments that were meant to highlight some of the frothiness that he was seeing in markets at the time.
Those comments by Alan Greenspan turned out to be correct, but if we expand the chart above out ten years, they were about three years early! As shown below, the Nasdaq would go on to experience an absolutely massive bubble for years after Greenspan's first mention of "Irrational Exuberance" in late 1996.
There are currently plenty of investors saying the same thing about Tech/AI stocks right now, but keep in mind that we've yet to see a pick-up on the M&A and IPO fronts that usually accompany bubbles. Some of that can be tied back to the current regulatory environment, but overall, the AI Boom, while certainly hot, still seems far more subdued than what we saw during peak Internet boom back in the late 1990s.
Of course, every boom/bust cycle is different, and the chart below is not to suggest that the Nasdaq will continue following the path it took back in the 1990s. We just thought it was helpful to see the two periods side by side when comparing the launch of ChatGPT to the launch of the Netscape web browser.
Bloomberg: When will the Fed finally start down the mountain? (Authers’ OpED) The US looks lonelier than ever at peak rates. The FOMC’s options seem to be a first cut, or a step toward it.
… The Fed’s Next Move … Former doves have moved in the opposite direction. Absent a black swan event, SMBC Nikko’s Joseph Lavorgna — formerly an economist in the administration of Donald Trump — argues that there’s now no fundamental argument for a July cut; heavy fiscal outlays at a time of low unemployment combine with strong animal spirits in markets to make conditions quite easy enough without help from the Fed:
The dramatic equity-led easing of financial conditions is keeping growth afloat through positive wealth creation and changing corporate and household behavior. Rising stock prices are creating enough wealth that households feel comfortable running down their savings. And rising stock prices are lifting CEO confidence enough to reduce the risk of any sizeable, economy-wide downsizing of headcount.
This is how Bloomberg’s indicator of financial conditions, which combines a range of markets including stocks, captures this. Higher numbers indicate looser conditions. In the eurozone, and the US, the recent equity turbulence has had little effect, and it’s hard to see any urgency for cuts:
However, the markets are warming to the notion that the Fed’s cutting cycle is running late. Some traders are even betting on a half-point cut in September. PGIM Fixed Income’s Tom Porcelli doesn’t expect this, but spells out a scenario that might justify it:
It would have to be a reaction to something dramatic happening. We will get two more inflation reports and two more payroll reports between now and the September meeting. It would take a zero or near-zero print from a labor perspective over the next couple of months. Or inflation month on month, slowing to zero… I’m simply saying you would need some sort of notable deterioration in the data for the Fed to tee up a 50.
There will soon be an opportunity for such a dramatic happening. By week’s end, new data for July could make the issue a lot clearer. Bloomberg Economics believes that July’s ISM manufacturing survey (Thursday) and nonfarm payrolls report (Friday) will show the Fed is cutting too late:
We expect the former to print in contractionary territory, while the unemployment rate will signal the Sahm Rule is close to being triggered. On average, the US economy had already been in recession for five months by the time the rule was triggered.
The back ends of curves have been dipping as growth concerns in the US and eurozone lurk. Second-quarter eurozone GDP figures are expected to remain in positive territory, but only by a small margin. The US re-funding announcement is due on Wednesday, teed up by the latest pre-funding data issued yesterday. Steady as she goes until payrolls on Friday
Oil prices have formed a pennant pattern in the past 12 months. That is, since topping in September last year, they have been making lower highs; as well as higher lows since last December. The second major high (April 2024), for example, was on the Israel/Iran conflict, while the second major low (early June) was on news that ‘OPEC+’ would begin to reverse its voluntary production cuts (starting Q4). Currently, therefore, with an 8.8% pullback since early July, oil is trading ~3% above the bottom of its pennant pattern (i.e. it’s next key support level).
Nautilus Research: U.S. Yield Curve Steepening on Tap U.S. 10-year Yield - U.S. 2-year Yield Cross above 3-year (36-month) Moving Average
Historically, when the spread between the U.S. 10-year and U.S. 2-year Treasury yields crosses above the 3-year (36-month) moving average after having been below it for at least 1 year (12 months), it indicates a clear shift towards curve steepening 1-12 months forward. For this study, we have chosen not to delve into the intricacies of bull or bear steepening and have not differentiated when these signals occur when the curve is above or below zero. We deliberately chose to perform a relatively simple and clean study where the return profiles are highly statistically significant from random.
Paulsen Perspectives: A Mag 7 Stock Market Calamity OR the Start of another Bull Market Leg?
… Is the Mag 7 Collapse about over or will it get much more frightening?
I wish I knew the answer to this question. Certainly, in the next few weeks, the Mag 7 rout could spread affecting other areas of the stock market if a panic results. We are only a couple weeks into this latest crisis and predicting an emotional panic is very difficult if not foolhardy…
… Finally, as chart 2 highlights, the concentration risk of the Mag 7 compared to the overall S&P 500 index - which worried many before this selloff began -- has already been lessened considerably. In only 12 days since the July 10th Peak in the Mag 7 Index, its market cap relative to the S&P 500 index market cap has already been reduced by about 2.8%. Consequently, its concentration has already lessened by about two-thirds (i.e., (31.6 - 34.4) / (34.4 - 30) = (-2.8/4.4) = -64%) compared to when it broke above 30% and became widely considered extreme. You could reasonably argue that 30% of total capitalization is still quite a concentration. However, the Mag 7 did reach almost 30% in both 2020 and again in 2021 and had been hovering near 30% since November 2023 until it broke above that level this year.
… This week, all eyes are on the Fed’s upcoming meeting. I anticipate Jerome Powell will indicate the potential for easing of monetary policies in September if the current economic trends continue. He is unlikely to fully commit to this, as there’s a lot of data before that September meeting—but the Fed’s confidence in the inflation trajectory should have increased enough to start cutting rates. The market even started pricing in some probability of a 50-basis point cut, which I have alluded to in prior commentaries, but that will only occur if there is a sharp slowdown, and the jobless claims data doesn’t point to that now.
Lastly, the political landscape is as complex and uncertain as ever. The dynamics here could play a crucial role in shaping tax and economic policies going forward. As markets continue to digest these developments, the intersection of economic data, Fed policies, and political dynamics will be key areas to watch.
Within the market, we’ve experienced major market rotation. The last two weeks of strong performance for value and small caps just reversed the last 2-3 months of mega cap growth’s surge and brings us back to a long-term trend for the growth stocks. We could see a short-term bounce for growth, but I do not think we will get back to the highs of growth versus value reached in the middle of July. When rates start to come down, we could see a longer-term shift in the small cap and value stock relative performance trends.


Great information!!!!
Thanks a lot...