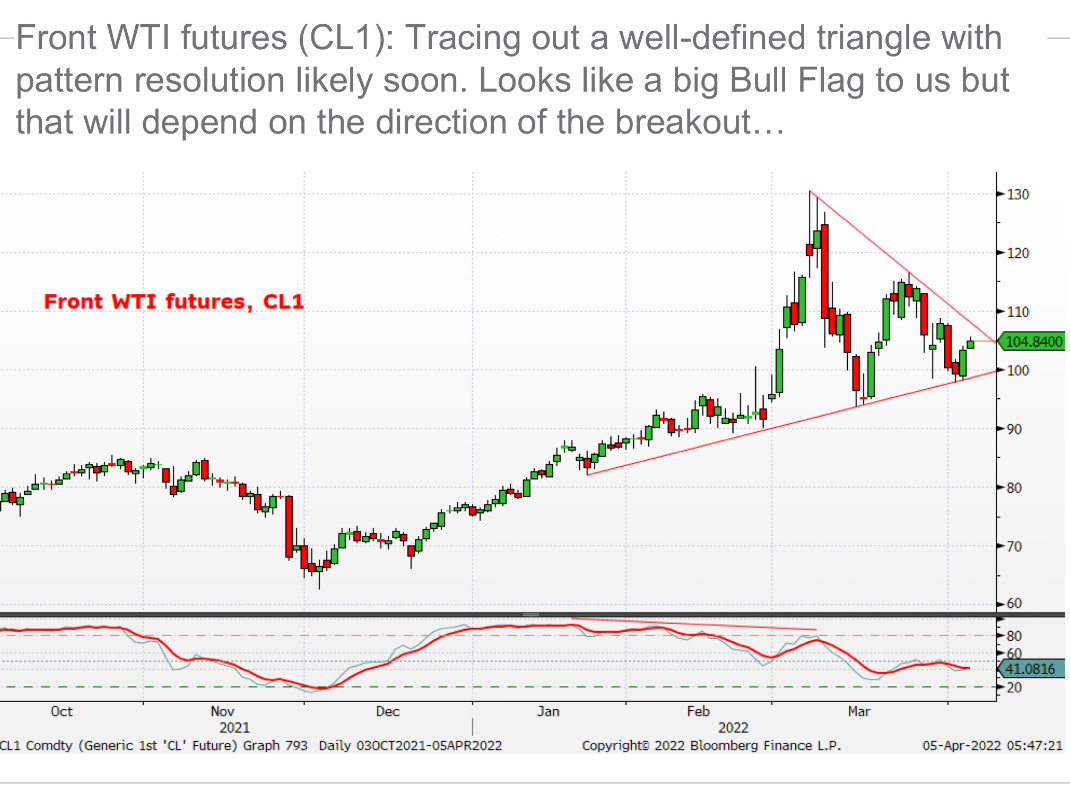
Treasuries are lower and the curve steeper after Australia's RBA opened to door to earlier rate hikes while the UK and EU services sector PMIs scored beats in March. DXY is modestly lower (-0.1%) while front WTI futures (see attachments) are modestly higher (+0.5%). Asian stocks that were open (China holiday) were little changed, EU and UK share markets are mixed/lower while ES futures are showing -0.25% at 6:15am. Our overnight US rates flows were 'uneventful' with a bias to sell the long-end from Asian real$ noted by our colleagues. Indeed, overnight Treasury volume was ~85% of average overall with relatively high average turnover seen in 30yrs (114%)…
…Up next is a look at the nicely-defined triangle that front WTI futures (CL1) has worked its way into in recent weeks. It's a consolidation pattern, obviously, but also potentially a big Bull Flag if that downtrend off last month's high is taken out and closed through. For now, the two lines are probably your tactical support and resistance levels. We'll be watching this pattern to see how its resolved.
… and for some MORE of the news you can use » IGMs Press Picks for today (5 April) to help weed thru the noise (some of which can be found over here at Finviz).
In as far as what’s hit global Wall Street’s inbox and which may be of some interest,
10yy in shorter-term: We would turn tactically bearish again at resistance at 2.325%, with support then seen at 2.645%, where we would turn tactically neutral. Resistance below 2.325% is seen at 2.20%, below which we would also turn tactically neutral.
BUT in the longer term (ie MONTHLY)
10yr US Bond Yields look likely to see further short-term consolidation, but we still like tactically fading rallies.
Moving along and thinking about more macro, this from JPMs stock jockey in chief (Kolanovic) yesterday,
… Still too early to own duration: Bonds’ valuations are more attractive after their recent sell-off, but not yet compelling, especially vs Stocks. The direction of travels is likely to remain higher for yields given high inflation and tightening central bank liquidity. Credit is looking better, with spreads in-line with their longterm median. Recent sector relative performance shows a defensive tilt as the yield curve inverted; however, inversion is not the death knell for the cycle, but rather the beginning of the countdown to the end
Which is interesting and upon further inspection, you’ll find a stunning admission
… The peak might be getting closer. In a recent thematic publication we looked at patterns around the start of hiking cycles (see Cross Asset Strategy: Rising Rates and the 60/40). Usually, 10Y UST yields don’t peak until late in the hiking cycle (Figure 15). Our economists have also revised their Fed call to expect two 50bp hikes in May and June, followed by 25bp at each meeting. This implies that we are still at an early stage of the normalization cycle, but also that the length of this cycle should be shorter than the 2015-2018 one. OIS swaps price the Fed funds rate to peak around 3% in the next 12m. If previous patterns repeat themselves, perhaps the peak in UST yield is more a matter of quarters than years. In terms of magnitude, it is also possible that the peak is not too far from 2022’s high of about 2.5%. Terminal rates pricing (at 2.1%) is only 40bp below the Fed's estimate of neutral, and our fair value model for ACM term premium suggests the market already prices in a lot in terms of reversal of QE. Similarly, for those looking at nominal yields as the sum of real yields and expected inflation, 10Y breakevens at 2.85% look elevated and should eventually moderate and offset some of the likely increase in real yields. Our revised forecasts for nominal UST yields see 10Y at 3% in 1Q23.
… Bonds have certainly lost some weight. This is evident from multiple perspectives: a) our tactical positioning indicators span CFTC data, JPM surveys and fund betas and are on average 0.6 sigmas below their 5Y averages (Figure 12);
b) on the AAII asset allocation survey, the % allocation to Bonds is close to 10Y lows (Figure 13) and; c) our estimated allocation to bonds by investors globally stands at only 18% currently, the lowest level since 2008. 14 years of previous bond overweights have been already erased and investors’ positioning has transitioned to the pre Lehman crisis norms. Investors globally appear to be currently very underweight bonds both outright and vs. equities.
From one heavyweight to another, Goldilocks expanding on whether or not a soft landing can / will be achieved,
in coming months. Such an FCI tightening could occur spontaneously, as equity and credit markets respond to higher interest rates, further energy shocks (e.g. an end to European imports of natural gas from Russia) weigh on growth and boost inflation, or China locks down more in response to covid outbreaks. Alternatively, FCI tightening might require an even more aggressive rate hike path from the Fed and other global central banks than markets are now pricing. Consistent with these observations, our strategists expect higher long-term interest rates, wider credit spreads, a “fat and flat” path for the equity market, and further gains in commodity prices despite the record Strategic Petroleum Reserve release.
Sounds to me like they read (wrote) Jamie Dimons’ latest shareholder note or perhaps some of the writings of Gary Shilling (such as this — Sell Stocks; A Recession is Coming — from last week, noted HERE)
… So the US economic outlook is in the hands of households and their purchasing power is falling. Average hourly wages rose 5.6% in March from a year earlier, the Labor Department said on Friday, but impressive as that is, they’re still below the 7.9% rise in the CPI. And households are reluctant to spend their accumulated savings, with the University of Michigan sentiment survey revealing a 30% drop in confidence over the past year.
Furthermore, there is no evidence that households expect inflation to remain high for years to come and will therefore rush to buy goods now before prices rise even further, as they did in the late 1960s and 1960s was the case in the 1970s. Such excess demand strains inventories and capacity, causing prices to rise, confirming inflation expectations and creating a self-feeding spiral. Today, however, New York Fed surveys show that consumers expect annual inflation to be 3.8% over the next three years …
The OpED concludes,
With real incomes falling and US consumers reluctant to spend their accumulated savings from pandemic-related stimulus, let alone spending on current income, economic growth will be minimal this year. And it can be negative as a previous inventory accumulation is reversed.
Citigroup on POSITIONS | Profits Taking in Rates
>>> US Thematics:
UST - Extended short and profits: $85m shorts (40bps profit) vs $23m longs (8bps loss). Over the week flows strongly biased to flatteners at the long end. Large profits concentrated at the frontend (at 70bps) and flatteners (2/10s).
Extended Shorts/profits in eurodollar - Eurodollar white highly extended => short momentum / profits squeezed at ED Mar 23 at 97.10
10y shorts / short momentum - one-side short (at $24m / 90th percentile) and 37bps in profit below 125-02 => short profits squeezed at 123-00 (which matches where pin risk in on put) vs with next support at 121-00 (pin risk)
Moving neutral in 30y (at 2m / 55th percentile) => balanced longs (at $12m /0bps profit at 175-08) offset by shorts (at $14m / 7bps in profit at 179-20) and long side focus and flatteners with 10/30s onside below 15bps
Liquidity: Liquidity stressed remains raised and fragile
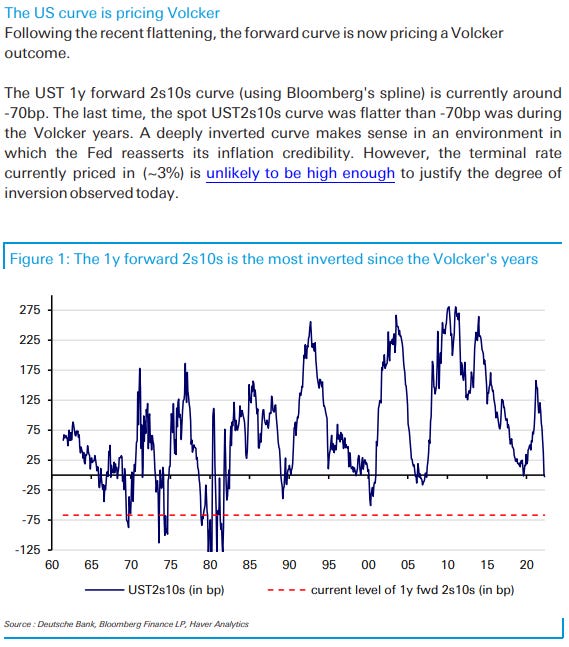
Hay being put in the barn and and old-school barn it is … DB chart showing, “The US curve is pricing Volker”
And another day brings with it another higher rates forecast from across the pond where,
Morgan Stanley is revising higher EZ yield f’casts. Ok … in OTHER news and VIEWS, an options based yield curve comment from MR Convexity himself,
Yield Curve comments for option geeks
This is a quick off-cycle Comment to explain what is happening to the Yield Curve.
Indeed the FED has been slow in shutting down the money printing; and the market is anticipating a quickening of policy that may well lead to a recession sometime in the summer of 2023, but that does not explain the extreme volatility in the bond market, usually a bastion for safety.
Over the years, Wall Street devised Structured Notes to offer civilian investors a way to earn an above market yield, without any credit risk.
These Notes, issued by the To Big To Fail banks, might offer an 8% yield for a year, and then pay 5-times the spread between the 2-year rate and the 30-rate. So if that spread was 150bp, a level it was at just last year, the Note would kick off a coupon of 7.50%. (Well above the Junk Bond yield of ~5%.)
This Structured Note would also have a "zero-strike floor", so if this spread ever went negative, the client would NOT owe Wall Street any money.
Wall Street dealers would hedge this risk via various means, but this included being short this "zero-strike option", which I will tell you is tremendously hard to manage.
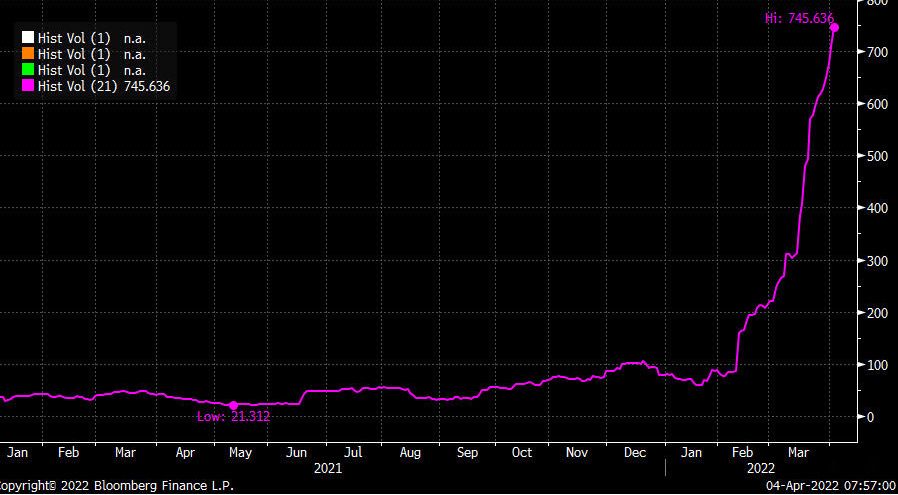
When the 2s vs 30s spread approached zero in February, Wall Street dealers went into panic mode as they were Short Convexity on the Curve via this option; to hedge this risk, they quickly started selling 2yr bonds and buying 30yr bonds. And as you know, each time they did this, the Negative Convexity made it worse.
Below is the Actual Volatility of the 2s vs 30s Yield Curve spread.
A similar occurrence happened in 2008, which I detailed here >>>
What is important to note, is that unless these Structured Notes mature (or are called), this option is still in the market, and if the Yield Curve starts to flatten such that the 2s vs 30s spread again approaches zero, it will be as violent in the other direction.