Ok good to know. HEREare the alleged fake as well as last months report. I’m glad we know what is NOT going to print at 830a, setting the table for this afternoons long bond auction. Speaking of long bonds, here’s a quick visual of 30yy YTD trading right at 50dMA (3.154%)
Thanks for reading The BondBeat! Subscribe for free to receive new posts and support my work.
Momentum (slow stochastics, bottom) are not sending any imminent signal and by the looks of things, a RANGE ‘call’ seems to be most appropriate one.
As far as that idea where bull markets love supply? Along came the 10yr auction just ahead of CPI and, well,
JEFF: 2bp Tail, Soft Indirects … Overall, the stats generated by today's auction are on the weaker side. The market rallied significantly since Monday morning, erasing a good bit of concession that had developed late last week. This was likely at least partially responsible for the soft bid …
At least this afternoons long bond auction will have the benefit of … here is a snapshot OF USTs as of 735a:
… HEREis what another shop says be behind the price action, you know,
WHILE YOU SLEPT Treasuries are holding onto minor gains, outperforming EGBs by 3-4bps ahead of CPI data. Both the RBNZ and BoK 50bp hikes were met with better Asia/Antipodean FI performance overnight, while APAC risk-assets also stabilized (NKY +0.5%, SHCOMP +0.1%). Commods are also seeing a bounce after yesterday’s downdraft: CL +1%, NG +5%, BCOM +0.9%. USD-crosses are stable too, EURUSD holding just slightly over parity, AUDUSD bouncing moderately +0.5%, USDCHF -0.6%. Rather uneventful flows reported, some FV upside in listed space noted (FVU2 112.75 calls in 20k) and a TY block buyer in 1.3k in Tokyo. DAX futures are -0.9% and SPX futures are +0.2% here at 7:15am.
… and for some MORE of the news you can use » IGMs Press Picks for today (13 July) to help weed thru the noise (some of which can be found over here at Finviz).
Now for a few words from Global Wall Streets sponsors
HEREis direct link without the ZH snark where Gross concludes,
… Investment implications? Bonds are at levels which represent diminished risk but little reward. Don’t buy them. Stocks must contend with future earnings disappointments and are not as cheap as they appear. Don’t buy them just yet. Commodities are out of gas. Alternatives? Well Jim Cramer famously says there’s always a bull market somewhere but I’m straining to find one now. Be patient. 12 month Treasuries at 2.7% are better than your money market fund and almost all other alternatives.
Year bills! FanTASTIC!
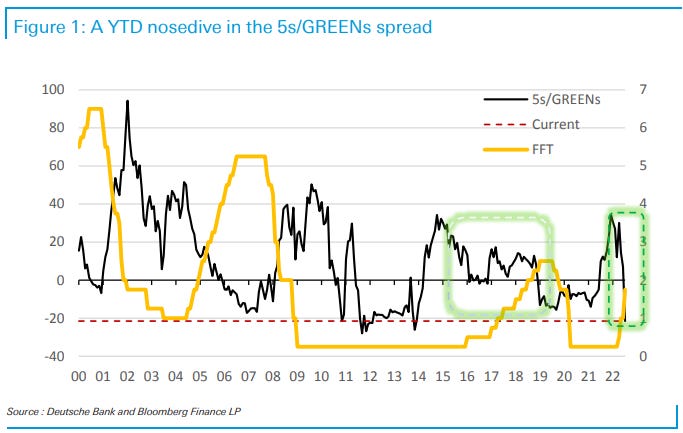
A large German bank weighing in on a specific part of the yield curve which those who know, well, know. 5sGREENS
As far as the front end is concerned, in this cycle things are moving about 6 times faster than before. In only three months, Fed funds have reached 1.75%. In 2016, starting with the same initial conditions, it took about 18 months to reach these levels. Similarly, Red and Green contracts have risen by about 150bp since March, while it took also about 18 months for this sector to reach the same levels in the 2016-2019 cycle.
The spread between 5s and GREENs (2Y1Y forwards) captures the shape of the Eurodollar sector of the curve. It summarizes the essence of the current tensions between the Fed and the curve. Normally, 5s/GREENs starts its widening around the beginning of the easing cycle and continues to widen as cuts are administered reaching its widest levels somewhere in the second half after which it begins to flatten towards the end of the easing and beginning of the rate hikes and eventually inverts as rate hikes progress. This is pure cycle mechanics of the curve driven by the logic of optimal control. The Figure shows the spread overlaid with Fed funds target rate with the last two tightening cycles highlighted for comparison.
… The snapshots of the Eurodollar sector of the curve capturing the end points of the two cycles look very similar -- the shapes levels are practically indistinguishable from each other. When one puts this coincidence of curves across the two tightening cycles in the context of underlying constellations of risk, the inevitable conclusion emerges that transcription of the economy offered by the curve can be incomplete and deceptive.
Oh, ok. THAT makes me feel so much better. Clearly this large German bank is not in the ‘make ‘em feel good’ biz as this chart (Devil’s Advocate Week….) from the other day might suggest,
… The three-month growth rate in M2 hit only 0.02% at the end of May, that’s the 2nd percentile of M2 growth in data going back to 1959 as you can see in the chart, and on the precipice of turning negative. As you can see, negative M2 growth rates are extremely rare in the modern era, even during recessions.
Notably, the data is only through May, before the Fed’s QT began in June, which should continue to lead to deposit growth being as weak as it has been recently. When the Fed lets securities mature un-reinvested, the Treasury Department (or MBS issuers) must turn to the public to finance the balances rolling off the Fed’s balance sheet. When the public pays for those balances out of current cash on hand, their deposits are transferred to the Treasury Department (or MBS issuer), effectively removing them from the banking system and monetary aggregates.
… Where does that leave me? I still think my core inflation view holds. Not only are we still experiencing an inflationary overhang from the tremendous growth in monetary aggregates (see the peak in the chart), even if monetary aggregate growth stalls, the level of excess savings remains extraordinary, all while labour markets are still historically tight, thus replenishing those bank accounts with pay checks. In fact while the correlation between M2 and inflation isn’t perfect, the correlation works best with around a 30-month lag. Given that M2 YoY growth was 26.9% in February 2021, the overhang might last a while yet.
Moving right along to some other conceptually BELOW ZERO type of talk, UBSs Paul Donovan asks / frames an interesting question
Twitter did what social media does best—circulating fake news (my Twitter account does not do this, comprising sensible economic comment and photographs of my sheep). A fake report pretending to be today’s US consumer price inflation data was released. It is telling that someone thought faking a CPI report was worth doing, and that markets reacted to an obvious fake.
The genuine report should show June headline consumer prices rose, and core (ex-food and energy) consumer prices fell. Inflation is the change in price levels, and so these numbers say as much about last year’s price levels as they do about this year’s price levels—important for oil prices and thus headline inflation.
How much more deflation and disinflation is evident in the detail will matter. Central bankers must offset inflation in prices they cannot control (commodities, or made-up prices) with more deflation or disinflation in prices they can control. Deflation is evident in some sectors of the US—will more sectors see slowing price inflation? …
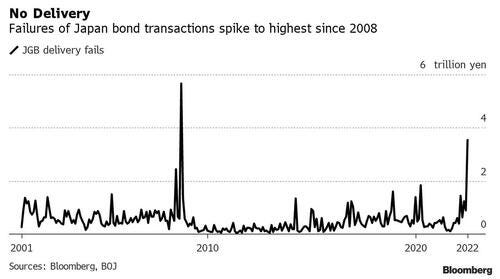
With de / disinflation in mind, here’s an interesting tidbit from BBG via ZH on how fails (trades not settling) in JGB market indicate …
… The impact of the BOJ’s shock intervention in the bond market in June is quite visible in the central bank’s latest report on transaction failures. Sellers in the JGB market failed to deliver securities worth 3.53t yen in face value last month, the second-largest amount on BOJ data going back to 2001.
Finally, from the Federal Reserve Bank of Dallas comes the latest question / topic / analog on many of our minds — namely where / what is the Fed going to break on its road to tighten and Whip Inflation NOW:
… Chart 4 presents reserve adequacy as well as its three components for the major emerging-market economies at the end of 2021.
Reserve adequacy is negative only in Turkey and Argentina, with their low stock of reserves and high amounts of short-term foreign currency debt. Colombia and Chile have relatively high current account deficits but, at least for the time being, have a high stock of reserves and a relatively low stock of short-term foreign currency debt.
Mexico is in a much different place than it was in 1994. It boasts a relatively high stock of reserves, a small current account deficit and a stock of short-term foreign currency debt that is among the lowest in the major emerging markets.
This suggests that as the Fed tightens monetary policy and raises interest rates, many major emerging-market economies—notably including Mexico—are in a much safer place than they were in 1994, the last time the Fed was so aggressive.
So … it IS different this time, then. (Happy I’ve stopped drinking tequilla and started drinkin’ gin, instead … better to be safe than sorry, right?)
Thank you for stopping by to read this — whatever it is you’ll want to call it …
… THAT is all for now. Off to the day job…
Thanks for reading The BondBeat! Subscribe for free to receive new posts and support my work.