After three straight down weeks, both large- and small-caps rallied strong last week. More could follow should non-commercial futures traders, who remain heavily net short S&P 500 e-mini and Russell 2000 mini-index contracts, are forced to cover.
We’re ALL (stock jockeys and bond folks) watching but for now, here is a snapshot OF USTs as of 706a:
… HERE is what another shop says be behind the “Low Conviction Conditions”
… WHILE YOU SLEPT Treasuries are modestly higher and the curve has modestly steepened ahead of this week's back-end-loaded supply and Wednesday's CPI. Much of (East) Asia was out on holiday. DXY is notably lower (-0.7%) and, in turn, front WTI futures are +1%. Asian stocks that were open were almost all higher, EU and UK share markets are solidly higher (SX5E +1.4%, SX7E +2.2%) while ES futures are showing +0.5% here at 6:55am. Our overnight US rates flows saw one of the quietest Asian sessions of 2022 according to our colleagues there. Tsy prices fell early and recovered with mildly better real$ buying seen in intermediates. Overnight Treasury volume was ~70% of average overall with 3yrs (138%) seeing the highest average turnover ahead of this morning's auction of the same.
… Treasury 30yrs, daily: Added this one since 30's flirted most of last week near their mid-June move highs with the rich-on-curve 10's still below theirs. So the 3.50% area remains a key, local support for UST 30yrs while the next notable support after 3.50% appears to be ~3.97%- the late 2013, early 2014 monthly closing move highs then.
TLT's, monthly: No surprise, TLT's, like Tsy 30yrs, back at and around their mid-June move low (108.115). If that level is taken out, next solid support is seen at TLT's late 2013/early 2014 move low near 101.17... All of the longer-term momentum studies still guide bearishly with no hints yet of a threatened upside reversal...
… and for some MORE of the news you can use » IGMs Press Picks for today (12 Sep) to help weed thru the noise (some of which can be found over here at Finviz).
From overbought to oversold: We called time on the summer rally in August with the S&P 500 at 4300 – see Striking shallow hedges, dated 15 August. The squeeze amidst illiquid summer trading had left the market looking overbought and richly valued. We have since seen a sizable retracement and US equities have started to look a little oversold. In our view, this type of volatile but mean-reverting price action could continue into Q4. Our message is to carry on trading ranges.
Fundamental headwinds versus positioning tailwinds: We see P/E multiple contraction as more likely than expansion given the backdrop of tightening monetary policy. At the same time, earnings forecasts are starting to roll over. These twin headwinds leave a challenging fundamental backdrop. However, despite the rapidly decelerating growth outlook, we do not anticipate a full-blown US recession. Equities are already down ~15% YTD, and it is not obvious to us that the fundamental backdrop is bad enough to warrant a much deeper and more volatile correction.
The positioning narrative from US equities is supportive – Hedge fund short positioning is three standard deviations below the five-year mean, asset managers appear conservatively positioned, index put volumes have increased, and retail euphoria has faded. The largest marginal buyer of equities, US corporates themselves, remain very active via stock buybacks.
Volatility within the range: From an optionality perspective, the breakeven for a year-end ATM straddle (+/-10% on SPX) looks wider than our anticipated trading range. As such, investors may consider structures with a short tail bias. These trades could be well-suited for a range-bound trading environment, even if those ranges are choppy and wide by historical standards.
From France to the UK where a large British bank talks of RATES,
Macro House View Weekly: Pedal to the metal Growth momentum is fading around the world, as central bankers unite behind the drive to prioritise inflation
… US rates risks remain skewed towards more restrictive policy than is currently priced, so we maintain our flattener recommendations. In Europe we keep our long in the belly of the EUR 2s10s30s fly, as the ECB is in a hurry to raise rates. In the UK, fiscal support to contain rising energy costs means gilt supply could soon eclipse the height of the pandemic. GBP 1y1yf looks cheap as a hedge for a longer period of tighter monetary policy.
This week the focus is on US CPI (Tue): We expect core to have risen 0.3% m/m and see only an outside chance that a soft number will swing the Fed's pendulum back toward 50bp. But any strengthening of the "peak inflation" narrative could provide relief to JPY. The MPC meeting originally scheduled for Thu 15 was postponed for a week as the UK entered a period of mourning after the death of Queen Elizabeth II.
Moving swiftly from country to country, a large German bank survey results say
Respondents are expecting the next big move in the S&P 500 to be lower over higher, and more than 90% of respondents still think the S&P 500 has yet to find its bottom for the cycle
Respondents are also structurally bearish on sovereign bonds as well, where nearly 80% expect the next move in 10yr Treasuries and Bunds to be notably higher (to 5% for TSYs, 3% for Bunds), than lower (to 1% for TSYs, 0% for Bunds).
Nearly 90% of respondents expect the next US recession to start before the end of 2023 but less think 2022 than before the summer break.
Most expect that Europe will have to institute some form of gas rationing to get through the coming winter, with most respondents in Europe expecting to curb their own energy usage
On other market risks, respondents are expecting Covid (ex-China’s impact) and the impending Italian elections to prove benign affairs
When everyone thinks one thing is going to happen, typically something ELSE does?
And from everyone’s favorite bearish stock jockey right here in the ‘ole USofA,
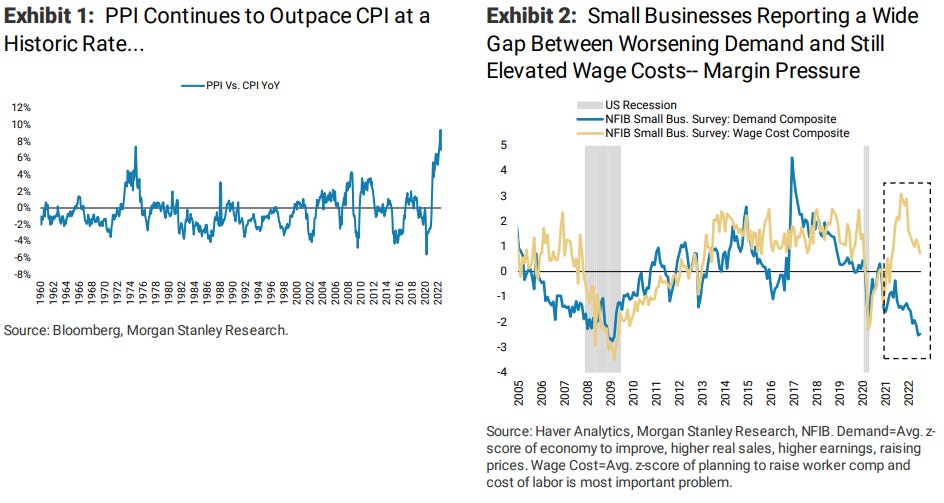
… We spent this past week marketing our views with clients in London which provided a fresh reaction to our earnings cuts and feedback on how best to trade them.First, on the earnings cuts, most clients agree the consensus numbers are too high. That said, there is a wide range of views on how much the estimates need to come down. As noted, our base case point estimate for 2023is $212for S&P 500 EPS which is 13% below the bottoms up consensus. Based on our meetings, that is lower than what most are currently thinking. Without taking a formal survey, we think the buyside is closer to $225 on '23 EPS or abouthalf as bad as our forecasted cut. The bulk of the disagreement continues to be centered on the argument that inflation will protectnominal profits for many companies and lead to smaller downward EPS revisions than whatusually happens during a meaningful earnings correction. As a result, we spend much of our meetings discussing our view that inflationary periods do lead to higher operating leverage but that operating leverage cuts both ways. Most importantly,given the fact that costs are now rising faster than end point pricing, that operating leverage is now starting to work against profitability,and so there is a good chance the higher inflationary world we live in could lead to worse profit erosion than normal,not better (Exhibit 1 and Exhibit 2). This is probably the key differentiated view we have based on our interactions with clients,and many were more in our camp after our meetings.
… specifically, the ERP is now 252bps which is ~10bps lower than it was in August when the S&P 500 topped at 4,325. Not only is the ERP ~150bps below the average of the past 15 years, but this is occurring at a time when our forward NTM EPS model is at one of its largest spreads to the consensus forward estimates (Exhibit 3)—i.e.,a time when the ERP should be elevated…
And from US stock jockey’s to a VIEW that THE Widowmaker trade — short JGBs — might, in fact be back. To whit, Russell Clarck from Capital Flows and Asset Markets
IS THE WIDOWMAKER TRADE DEAD? Yen weakness normally encourages other countries to devalue. China looks to be different - and hence deflation looks less and less likely…
… What is the conclusion of all this analysis? Traditional free market analysis would suggest buy yen and JGBs as Japan will see capital and tourism flows from China, forcing the currency up and being deflationary. Political analysis says the Yen will keep falling until the BOJ changes course, as China is under no threat of devaluation at the moment. This makes Yen tricky - it is a political call, not a macro call. But JGBs look like a short - the widowmaker trade might now be a moneymaker.
Finally as we enter that part of the programming where traders begin THINKING about thinking about reducing risk ahead of years end, you know, in order to preserve any chance at a bonus, here’s a visual of how the process of thought going early on
Jello mold anyone? … THAT is all for now. Off to the day job…